In silico evolutionary dynamics of tumour virotherapy†
Carlos L.
Reis
a,
Jorge M.
Pacheco
ab,
Matthew K.
Ennis
c and
David
Dingli
*cd
aATP-group and CFTC, Complexo Interdisciplinar da Universidade de Lisboa, P-1649-003 Lisboa Codex, Portugal. E-mail: clr@cii.fc.ul.pt; Fax: +351 21 7954288; Tel: +351 21 7904817
bDepartamento de Matemática da Universidade do Minho, Campus de Gualtar, 4710-057 Braga, Portugal. E-mail: jmpacheco@math.uminho.pt; Fax: +351 253604369; Tel: +351 253604367
cDepartment of Molecular Medicine, College of Medicine, Mayo Clinic, Rochester, MN 55905, USA. E-mail: ennis.matthew@mayo.edu; Fax: +1 507 284 8388; Tel: +1 507 266 0586
dDivision of Hematology, College of Medicine, Mayo Clinic, Rochester, MN 55905, USA. E-mail: dingli.david@mayo.edu; Fax: +1 507 266 4972; Tel: +1 507 284 3417
First published on 14th October 2009
Abstract
Replication-competent viruses based on the Edmonston vaccine strain of measles virus (MV-Edm) have potent and selective activities against various types of tumours in vitro but the responses in vivo are more variable. Some tumours are eliminated consistently while others persist despite evidence of ongoing viral propagation. In order to understand these disparate results, we have developed a model for the spatial growth of a tumour population followed by infection with a replicating virus that can spread by cell-to-cell fusion ultimately leading to cell death. We utilize the model to explore both the impact of tumour architecture and the dynamics of tumour cell-virus interactions on the outcome of therapy.
Insight, innovation, integrationSuccessful therapy with oncolytic viruses requires dissemination of these agents in the tumour. Hence, the architecture of the tumour may be an important determinant of the outcome. In this work, we integrate the known biology of replication and spread of an oncolytic virus that is being tested in humans, with insight from computational physics to understand the importance of tumour architecture on the outcome of virotherapy. The innovative component lies in the combination of a computational model, which captures the diversity within the three dimensional architecture of tumours, and the intrinsically stochastic nature of the dynamics that unfold between the virus and cancer cells. |
Introduction
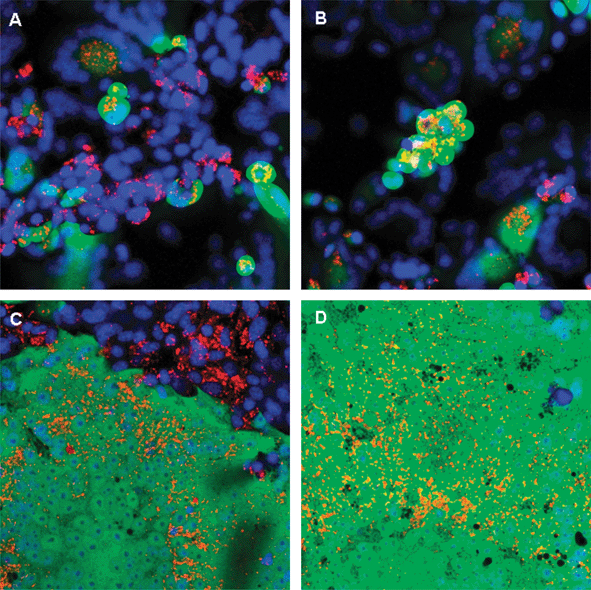
Replicating viruses hold great promise as cancer therapeutic agents.1,2 Advances in molecular biology have led to the identification of specific mechanisms utilized by replicating viruses to hijack the cellular machinery for their own replication. Interestingly, several of the mechanisms used by viruses to achieve their aim of propagation are also responsible for tumour growth, making many viruses, naturally tropic for tumours. Other viruses can be engineered to increase both their binding selectivity and/or selective killing of tumour cells.1,2 In addition, viruses can be armed to enhance their ability to kill tumour cells, by engineering them with suicide genes such as thymidine kinase,3,4 immune response activators such as GM-CSF and co-stimulatory molecules,5 or radioactive isotope concentrators such as the sodium iodide symporter,6,7 which enables infected tumour cells to concentrate radioactive iodide that decays by emission of electrons that have a bystander effect.8,9Virus-induced cell killing can be described as either lytic or due to cell-to-cell fusion. Lytic viruses such as adenovirus, reovirus and vesicular stomatitis virus amplify rapidly in the cell, and finally lead to cell death by lysis. In contrast, viruses such as measles (MV) induce cell death by the formation of syncytia that ultimately die,10,11 as illustrated in Fig. 1.
 | ||
| Fig. 1 Infection and syncytium formation after MV infection of tumour cells. In order to illustrate syncytium formation, we infected a malignant melanoma cell line (Mel 624) with MVeGFP, a recombinant replicating measles virus that induces expression of green fluorescent protein which enables tracking of virus propagation. At regular intervals after infection, representative cultures were selected, and the cells stained with Hoescht 33258 (Invitrogen) to visualize the nuclei, followed by incubation with the lipid avid dye DiI (Invitrogen) to stain the plasma membrane (orange). Subsequently, the cells were imaged with a confocal microscope using the appropriate lasers. Single infected cells (green, A) progress to incorporate surrounding cells to form multinucleated giant cell syncytia (B–D). | ||
MV infection starts by binding of the viral haemagglutinin protein (H) with its cognate receptor on the target cell. Wild-type H preferentially binds to SLAM (signaling lymphocyte activation molecule) while H from the Edmonston vaccine strain (H-Edm) preferentially binds to CD46.12 Many human tumour cells over-express CD46, thereby partly explaining the natural tropism of MV-Edm for tumours.13,14 Binding of H to its receptor triggers conformational changes in the viral fusion (F) protein leading to mixing of the viral envelope with the plasma membrane of the target cell, enabling the viral genome to enter the cell. Infected cells transcribe the viral RNA and synthesize the various virus encoded proteins required for virus assembly. These include the viral H and F proteins that after synthesis in the endoplasmic reticulum, are trafficked to the plasma membrane of infected cells. The F and H proteins expressed by such a cell can interact with CD46 expressed by neighboring tumour cells, leading to fusion of the two cells. Consequently, syncytium formation is due to cell-to-cell fusion and, as a result, an infected cell serves as a focus that expands to engulf surrounding tumour cells into a syncytium that ultimately dies; syncytium formation leads to a bystander effect with a single infected cell inducing the death of many surrounding cells.
Tumour virotherapy is at odds with any other form of cancer therapy, since the fundamental concept is the establishment of an infection within the tumour cell population that leads to further amplification of the virus and therefore an improved oncolytic effect. However, the interaction between oncolytic viruses, the tumour and the host is a complex process to which many factors concurrently contribute. Access of the virus to the tumour depends on the vascular supply to the tumour,15 intratumoural pressure gradients,16 the immune response to the virus and virus-infected cells17 and the presence of an extracellular matrix that may trap or help virus propagation.18 Various investigators have attempted to model the dynamic interactions of such systems.19–30 However the impact of stochastic effects—that are fundamentally at work when the virus interacts with a particular cell—and the impact of the tumour architecture on the outcome of therapy have not been evaluated to date. In the following, we provide an analysis of the role of stochastic effects and tumour architecture on the outcome of tumour therapy with replication-competent MV where spread of the virus is from cell to cell.
Model
We discretize real 3D space into a regular mesh corresponding to a face centred cubic (FCC) crystal-lattice, which warrants a high-density, close-packing structure in which each site has 12 nearest neighbours. The regularity of the underlying lattice allows us to keep track of only two types of cells: cancer-cells (C), and virus-infected cancer cells (V). Lattice points not occupied by C-cells or V-cells are assumed to be occupied by normal tissue cells.We simulated two patterns of tumour growth on this discrete lattice: a standard spatial growth model leading to compact three-dimensional tumour shapes, and a fractal-like tumour31 that may more realistically represent tumours with a rich extracellular matrix such as some types of breast cancer and pancreatic carcinoma. In both cases, tumour growth is stochastic in nature, and proceeds according to the rules specified in the ESI.†
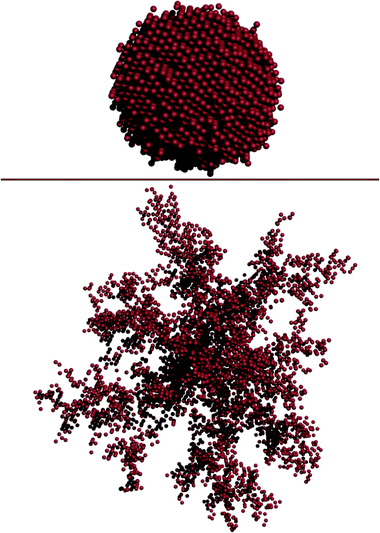
In its compact form, whenever a tumour cell reproduces (chosen at random), it creates a replica of itself which will fill a site if it is empty or will ‘push’ a cell away, hence generating pressure within the tumour.16 By imposing that the previously resident cell displaces itself, this will start a random, domino-like effect, in which cells push other cells away until one reaches normal tissue—that is, some external edge of the tumour—where this cell dynamics stops. In the case of fractal tumour growth, each cell division is viewed as the result of a biased random walk in which the daughter cell will occupy a lattice site close to the parent cell. These different tumour growth models lead to very different architectures, as shown in Fig. 2, for 2 tumours with the same number of cells.
 | ||
| Fig. 2 Patterns of growth of tumour cells on the discrete (FCC) lattice. The number of cells in each case is 6000. Upper panel: compact growth pattern. Lower panel: fractal-like growth pattern. | ||
The virus is subsequently introduced at localized regions of the tumour, where virus infection of each C-cell occurs with a given probability (η). Infected cells can fuse with surrounding cells with a finite probability (β) and infected cells die with a probability (δ) that is higher than that of cancer cells (d). Virotherapy was applied either close to the surface or in the centre of the tumour. The simulation stopped when the population of uninfected C-cells reached a pre-defined carrying capacity (ESI†) or when it went extinct. Since MV is selective for cancer cells, infection of normal cells is not considered since these cells will prevent virus replication. In other words, a virus that enters a normal cell is effectively eliminated.32
Results and discussion
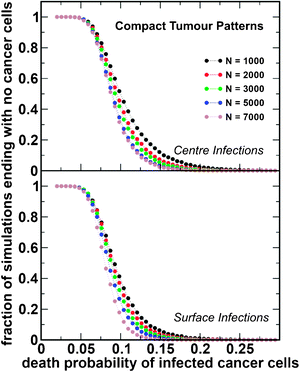
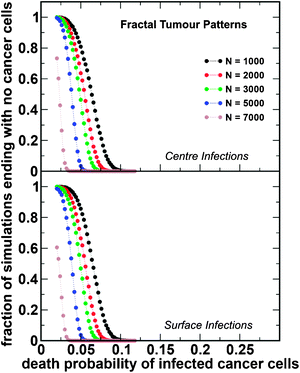
We performed 106 simulations for each set of parameters and for each pattern of tumour growth: compact and fractal tumours. The results are shown in Fig. 3 and 4, respectively. The starting tumour size at which infection takes place ranged from 10 to 90% of the tumour carrying capacity; subsequently, 1% of the tumour cell population was infected with the oncolytic virus MV-Edm. This is based on prior modeling approaches, as well as on studies of the infected cell burden in tumours, which show that only a small percentage of cells become infected with the oncolytic virus soon after vector administration.23,26,27 Our results can be summarized as follows:(i) smaller tumours are more likely to be eliminated by the virus, irrespective of the architecture;
(ii) tumours with fractal architecture are significantly more difficult to eradicate and, in such cases, viruses that kill tumour cells more slowly become more effective;
(iii) for a compact tumour, the sensitivity to the location of initial infection is less important compared to fractal-like tumours, for which a central infection is associated with a higher probability of eradication.
 | ||
| Fig. 3 Tumour eradication as a function of the rate of infected cell death. Results of the simulations for compact tumour patterns. The number of simulations (as a fraction of the total) ending with no cancer cells is plotted as a function of the death probability of the infected cancer cells (δ) for a range of starting tumour sizes (N). Infected cells fuse with surrounding cells with probability β = 0.5. The initial tumour cell population was infected at the centre (top panel) or on the surface (bottom panel) with a probability η = 1%. | ||
 | ||
| Fig. 4 Tumour eradication as a function of the rate of infected cell death. Results of the simulations for fractal-like tumour patterns. We use the same notation and parameter values as in Fig. 3. | ||
The outcome of tumour virotherapy is highly variable. Success or failure depends on the size of the tumour at the time of therapy, the tumour architecture, and the rate at which infected cells die. Given the specific dynamics that results from the interaction of tumour and normal cell sub-populations, various models that capture salient features of these systems have been reported.19–30 Essentially all of these models are based on the principle of mass action which assumes a uniform distribution of all the components relevant to the system. Clearly, it is quite unlikely that at a more refined level this assumption holds true. In addition, parameters estimated from fitting experimental data to such models, out of necessity, describe an average behaviour, since not every cell can be infected by any released virus. Given the variability of tumour dynamics, these average values may be misleading. Naturally, diffusion of the virus is limited and therefore, some cancer cells close to an infected cell may be much more accessible to the virus than other cells further away. Moreover, differential equation models can create a problem with the definition of a cure and invariably some form of discretization has to be imposed.23,26,27 In all of these respects, stochastic models, that consider cellular replication, virus infection and cell killing as a probabilistic process, may capture ‘reality’ more closely and overcome some of the above mentioned assumptions. In this sense, the present model provides arresting evidence of the influence of tumour architecture on the final outcome of virotherapy.
Although our model was intended to study a virus that spreads from cell to cell by syncytium formation, it appears that the general conclusions obtained here apply to lytic viruses that burst infected cells with the release of virions that then proceed to infect surrounding cancer cells. It is likely that the presence of the extracellular matrix will similarly hinder spread of these viruses, essentially limiting infection to surrounding tumour cells.
Conclusions
In this work, we used stochastic models to understand the dynamic interactions between an oncolytic virus that spreads from cell to cell by fusion and the impact of tumour architecture on the success or failure of therapy. Contrary to models based on differential equations, which suggest that ‘larger’ tumours may be better targets for virotherapy, we find that tumours that are smaller at the time of virotherapy, are more likely to be eradicated. This suggests that use of cytoreductive therapy to reduce the bulk of the cancer followed by administration of the virus may offer a superior outcome compared to the virus alone. Studies combining chemotherapy (such as cyclophosphamide) followed by replicating viruses, do support this model prediction.17,33–35 In the absence of a virus-induced anti-tumour immune response, therapeutic virus amplification is critical for an optimal outcome since tumour eradication requires that the majority (or all) of cancer cells have to be infected by the virus. It is often very difficult to administer enough virus to ensure that the majority of cancer cells are infected. In fact, studies in animal models suggest that only a small fraction of tumour cells are infected with the virus. For this reason, we consider that at most 1% of the cancer cells are infected with the initial virus administration. The present model restricts itself to a single viral administration. Multiple viral infections can be beneficial to the patient, in particular if one can control the location of virus re-administration. Clearly, the biological characteristics of the virus and the spatial location of tumour cells are crucial. One strategy that can improve virus amplification is by slowing infected cell death. In such a case, infected cells may produce more virus that can infect additional cancer cells, thereby increasing the odds of tumour control. Unfortunately, the field of cancer gene therapy has taken the diametrically opposite route—aiming for more rapid cancer cell destruction. Our results show that slower cancer cell killing may give superior results by enabling higher virus amplification. In this respect, our stochastic model provides clues similar to those predicted by deterministic models.19,20,26,27 Indeed, for tumours with an irregular architecture (fractal-like), slower cell killing is crucial for success. Of course, slower killing of infected cells or slower virus amplification may render the system more vulnerable to an immune attack. One may think that the immune response in such cases will rapidly neutralize the virus (and virus-infected cells) bringing the therapeutic effect to a halt. However, the therapeutic landscape need not be so bleak: several investigators have shown that the immune response can be controlled with pharmacologic agents that do not seem to adversely affect oncolytic virus production.33,34 Indeed, immunosuppressive agents may actually improve the outcomes even for viruses that can propagate in the presence of an immune response.33,36,37 Moreover, there is some evidence that one of the mechanisms by which viruses induce cancer control is by alerting the immune system to the presence of the cancer cell population (i.e. as immune adjuvants). In such a scenario, the immune response may be more of a blessing than a curse.38One of the major obstacles to successful virotherapy is access of the virus to the tumour. For localized disease, intratumoural injection of the virus may ensure high concentrations of the therapeutic agent, improving the likelihood of establishing an infection. However, for disseminated disease such as multiple myeloma or metastatic malignancy, systemic delivery of the vector will be necessary: our model simulations suggest that in cancers that have a significant supportive stroma, infection of the core of the tumour may be more likely to lead to cancer control or eradication, the site of initial infection playing an important role on the outcome of therapy. For a compact tumour, with minimal stroma, initial infection close to the growing surface versus infection within the core of the tumour does not make much difference. The centre of tumours is often hypoxic and hence cells may be dying or be less likely to reproduce the virus efficiently. However, our modeling provides some support to current clinical trial approaches where replicating viruses such as herpes simplex or measles virus are injected in the operative site of recurrent brain tumours in an attempt to control growth of tumours that are notorious for their irregularly defined margins that often defy complete tumour extirpation.
References
- D. Kirn, R. L. Martuza and J. Zwiebel, Nat. Med., 2001, 7, 781–787 CrossRef CAS.
- S. J. Russell and K. W. Peng, Trends Pharmacol. Sci., 2007, 28, 326–333 CrossRef CAS.
- M. Raki, T. Hakkarainen, G. J. Bauerschmitz, M. Sarkioja, R. A. Desmond, A. Kanerva and A. Hemminki, Gene Ther., 2007, 14, 1380–1388 CrossRef CAS.
- T. M. Pawlik, H. Nakamura, J. T. Mullen, H. Kasuya, S. S. Yoon, S. Chandrasekhar, E. A. Chiocca and K. K. Tanabe, Cancer, 2002, 95, 1171–1181 CrossRef CAS.
- K. J. Choi, J. H. Kim, Y. S. Lee, J. Kim, B. S. Suh, H. Kim, S. Cho, J. H. Sohn, G. E. Kim and C. O. Yun, Gene Ther., 2006, 13, 1010–1020 CrossRef CAS.
- C. Spitzweg, A. B. Dietz, M. K. O'Connor, E. R. Bergert, D. J. Tindall, C. Y. Young and J. C. Morris, Gene Ther., 2001, 8, 1524–1531 CrossRef CAS.
- D. Dingli, K. W. Peng, M. E. Harvey, P. R. Greipp, M. K. O'Connor, R. Cattaneo, J. C. Morris and S. J. Russell, Blood, 2004, 103, 1641–1646 CrossRef CAS.
- D. Dingli, R. M. Diaz, E. R. Bergert, M. K. O’Connor, J. C. Morris and S. J. Russell, Blood, 2003, 102, 489–496 CrossRef CAS.
- D. Dingli, S. J. Russell and J. C. Morris, 3rd, J. Cell. Biochem., 2003, 90, 1079–1086 CrossRef CAS.
- K. W. Peng, G. J. Ahmann, L. Pham, P. R. Greipp, R. Cattaneo and S. J. Russell, Blood, 2001, 98, 2002–2007 CrossRef CAS.
- D. Grote, S. J. Russell, T. I. Cornu, R. Cattaneo, R. Vile, G. A. Poland and A. K. Fielding, Blood, 2001, 97, 3746–3754 CrossRef CAS.
- U. Schneider, V. von Messling, P. Devaux and R. Cattaneo, J. Virol., 2002, 76, 7460–7467 CrossRef CAS.
- B. D. Anderson, T. Nakamura, S. J. Russell and K. W. Peng, Cancer Res., 2004, 64, 4919–4926 CrossRef CAS.
- H. T. Ong, M. M. Timm, P. R. Greipp, T. E. Witzig, A. Dispenzieri, S. J. Russell and K. W. Peng, Exp. Hematol., 2006, 34, 713–720 CrossRef CAS.
- K. Kurozumi, J. Hardcastle, R. Thakur, M. Yang, G. Christoforidis, G. Fulci, F. H. Hochberg, R. Weissleder, W. Carson, E. A. Chiocca and B. Kaur, J. Natl. Cancer Inst., 2007, 99, 1768–1781 CrossRef CAS.
- M. Stohrer, Y. Boucher, M. Stangassinger and R. K. Jain, Cancer Res., 2000, 60, 4251–4255 CAS.
- J. Qiao, H. Wang, T. Kottke, C. White, K. Twigger, R. M. Diaz, J. Thompson, P. Selby, J. de Bono, A. Melcher, H. Pandha, M. Coffey, R. Vile and K. Harrington, Clin. Cancer Res., 2008, 14, 259–269 CrossRef CAS.
- V. P. Chauhan, R. M. Lanning, B. Diop-Frimpong, W. Mok, E. B. Brown, T. P. Padera, Y. Boucher and R. K. Jain, Biophys. J., 2009, 97, 330–336 CrossRef CAS.
- D. Wodarz, Cancer Res., 2001, 61, 3501–3507 CAS.
- D. Wodarz, Hum. Gene Ther., 2003, 14, 153–159 CrossRef CAS.
- J. T. Wu, H. M. Byrne, D. H. Kirn and L. M. Wein, Bull. Math. Biol., 2001, 63, 731–768 CrossRef CAS.
- J. T. Wu, D. H. Kirn and L. M. Wein, Bull. Math. Biol., 2004, 66, 605–625 CrossRef.
- D. Dingli, M. D. Cascino, K. Josic, S. J. Russell and Z. Bajzer, Math. Biosci., 2006, 199, 55–78 CrossRef.
- A. Friedman, J. P. Tian, G. Fulci, E. A. Chiocca and J. Wang, Cancer Res., 2006, 66, 2314–2319 CrossRef CAS.
- Y. Tao and Q. Guo, J. Math. Biol., 2005, 51, 37–74 CrossRef.
- Z. Bajzer, T. Carr, K. Josic, S. J. Russell and D. Dingli, J. Theor. Biol., 2008, 252, 109–122 CrossRef.
- D. Dingli, C. Offord, R. Myers, K. W. Peng, T. W. Carr, K. Josic, S. J. Russell and Z. Bajzer, Cancer Gene Ther., 2009 Search PubMed in Press.
- S. C. Ferreira, M. L. Martins and M. J. Vilela, Physica A, 2005, 345, 591–602.
- L. R. Paiva, C. Binny, S. C. Ferreira Jr, and M. L. Martins, Cancer Res., 2009, 69, 1205–1211 CrossRef CAS.
- L. G. De Pillis, D. G. Mallet and A. E. Radunskaya, Computational and Mathematical Methods in Medicine, 2006, 7, 159–176 Search PubMed.
- J. W. Baish and R. K. Jain, Cancer Res., 2000, 60, 3683–3688 CAS.
- K. W. Peng, C. J. TenEyck, E. Galanis, K. R. Kalli, L. C. Hartmann and S. J. Russell, Cancer Res., 2002, 62, 4656–4662 CAS.
- G. Fulci, L. Breymann, D. Gianni, K. Kurozomi, S. S. Rhee, J. Yu, B. Kaur, D. N. Louis, R. Weissleder, M. A. Caligiuri and E. A. Chiocca, Proc. Natl. Acad. Sci. U. S. A., 2006, 103, 12873–12878 CrossRef CAS.
- M. M. Alonso, C. Gomez-Manzano, H. Jiang, N. B. Bekele, Y. Piao, W. K. Yung, R. Alemany and J. Fueyo, Cancer Gene Ther., 2007, 14, 756–761 CrossRef CAS.
- D. Hoffmann, J. M. Bangen, W. Bayer and O. Wildner, Gene Ther., 2006, 13, 1534–1544 CrossRef CAS.
- N. Smakman, J. D. van der Bilt, D. J. van den Wollenberg, R. C. Hoeben, I. H. Borel Rinkes and O. Kranenburg, Cancer Gene Ther., 2006, 13, 815–818 CrossRef CAS.
- G. Ungerechts, C. Springfeld, M. E. Frenzke, J. Lampe, W. B. Parker, E. J. Sorscher and R. Cattaneo, Mol. Ther., 2007, 15, 1991–1997 CrossRef CAS.
- R. M. Diaz, F. Galivo, T. Kottke, P. Wongthida, J. Qiao, J. Thompson, M. Valdes, G. Barber and R. G. Vile, Cancer Res., 2007, 67, 2840–2848 CrossRef CAS.
Footnote |
| † Electronic supplementary information (ESI) available: Model implementation and initial tumour configuration details. See DOI: 10.1039/b917597k |
| This journal is © The Royal Society of Chemistry 2010 |
