Tea catechins modulate the glucose transport system in 3T3-L1 adipocytes
Manabu
Ueda
a,
Takashi
Furuyashiki
a,
Kayo
Yamada
a,
Yukiko
Aoki
a,
Iwao
Sakane
b,
Itsuko
Fukuda
c,
Ken-ichi
Yoshida
a and
Hitoshi
Ashida
*a
aDepartment of Agrobioscience, Graduate School of Agricultural Science, Kobe University, Kobe, 657-8501, Japan. E-mail: ashida@kobe-u.ac.jp; Fax: +81 78 803 5878
bCentral Research Institue, Ito En Ltd., Megami, Makinohara, Shizuoka 421-0515, Japan
cResearch Center for Food Safety and Security, Graduate School of Agricultural Science, Kobe University, Kobe, 657-8501, Japan
First published on 21st October 2010
Abstract
In this study, we investigated the effects of tea catechins on the translocation of glucose transporter (GLUT) 4 in 3T3-L1 adipocytes. We found that the ethyl acetate fraction of green tea extract, containing abundant catechins, most decreased insulin-induced glucose uptake activity in 3T3-L1 cells. When the cells were treated with 50 μM catechins in the absence or presence of insulin for 30 min, nongallate-type catechins increased glucose uptake activity without insulin, whereas gallate-type catechins decreased insulin-induced glucose uptake activity. (−)-Epicatechin (EC) and (−)-epigallocatechin (EGC), nongallate-type catechins, increased glucose uptake activity in the dose- and time-dependent manner, whereas (−)-catechin 3-gallate (Cg) and (−)-epigallocatechin 3-gallate (EGCg), gallate-type catechins, decreased insulin-induced glucose uptake activity in the dose- and time-dependent manner. When the cells were treated with 50 μM catechins for 30 min, EC and EGC promoted GLUT4 translocation, whereas Cg and EGCg decreased the insulin-induced translocation in the cells. EC and EGC increased phosphorylation of PKCλ/ζ without phosphorylation of insulin receptor (IR) and Akt. Wortmannin and LY294002, inhibitors for phosphatidylinositol 3′-kinase (PI3K), decreased EC- and EGC-induced glucose uptake activity in the cells. Cg and EGCg decreased phosphorylation of PKCλ/ζ in the presence of insulin without affecting insulin-induced phosphorylation of IR, and Akt. Therefore, EC and EGC promote the translocation of GLUT4 through activation of PI3K, and Cg and EGCg inhibit insulin-induced translocation of GLUT4 by the insulin signaling pathway in 3T3-L1 cells.
Introduction
Glucose transporters (GLUTs) are membrane proteins and play a role in transporting blood glucose into various tissues.1 GLUT1 is the most ubiquitous form expressed in brain, endothelial cells, erythrocytes, kidney, skeletal muscle and adipose tissue, and its expression level is usually related to the rate of cellular glucose metabolism. GLUT4 locates endoplasmic reticulum in skeletal and cardiac muscle and adipose tissue, and is translocated to the plasma membrane upon stimulation with binding of insulin to insulin receptor (IR) and subsequent activation of various protein kinases.2 In muscle and adipose tissue, GLUT4 translocates rapidly to the plasma membrane following insulin action, though more than 95% of GLUT4 is sequestered to intracellular compartment in the absence of insulin.3 Therefore, GLUT4 plays an important role in the maintenance of the postprandial blood glucose level by the insulin-dependent action.Insulin-induced translocation is initiated by the binding of insulin to IR α-subunit, resulting in phosphorylation of tyrosine residues in the SH2 domain of IR β-subunit (IRβ).4 The activated IRβ phosphorylates insulin receptor substrate-1 followed by phosphorylation of the p85 regulatory subunit of phosphatidylinositol 3′-kinase (PI3K) that induces phosphorylation of phosphoinositide-dependent kinase 1 (PDK1). In turn, PDK1 phosphorylates Akt (also termed protein kinase B: PKB). Akt has three isoforms (Akt1–3, also known as PKB α, β, and γ) in mammals, each encoded by a different gene. Akt2 rather than the Akt1 or Akt3 isoform appears to control GLUT4 trafficking in muscle cells and adipose tissue.5 Substantial evidence indicates that protein kinase C λ and ζ isforms (PKCλ/ζ) act downstream of PDK1 to relay insulin signals for GLUT4 translocation. It has been reported that treatment with a PKC inhibitor or the transfection of kinase-inactive forms of PKC ζ and λ in 3T3-L1 cells decreased the insulin-induced translocation of GLUT4.6 A recent study showed that RNAi-induced knockdown of PKC λ impaired the glucose uptake activity in 3T3-L1 cells.7 These results indicate that GLUT4 translocation is regulated by a complex cascade consisting of various protein kinases.
Tea is one of the most popular beverages consumed worldwide8,9 and tea leaves originate from the plant Camellia sinensis. Tea contains various polyphenols such as catechins, teaflavins, flavanols, and phenolic acids.10 Especially, green tea contains abundant catechins; the major tea catechins are (−)-epigallocatechin gallate (EGCg), (−)-gallocatechin 3-gallate (GCg), (−)-epigallocatechin (EGC), (−)-epicatechin gallate (ECg), (−)-epicatechin (EC), (−)-catechin 3-gallate (Cg), (+)-gallocatechin (GC), and (+)-catechin (C). Green tea has been regarded as possessing health promoting effects: recent studies demonstrated that green tea and tea catechins have anti-tumor,11 anti-inflammatory,12 and anti-oxidative effects.13 Moreover, it has been reported that green tea and tea catechins have an anti-obesity effect.14 Our previous report demonstrated that the intake of green tea for 3 weeks increased glucose uptake activity accompanied by the translocation of GLUT4 in skeletal muscle of male Wistar rats, while it decreased glucose uptake activity and the translocation in adipose tissue.15 Moreover, we showed that catechins stimulated glucose uptake activity in L6 myotubes and EGCg promoted the translocation of GLUT4 in skeletal muscle at physiological concentrations through activation of PI3K.16 However, it was unclear how green tea decreased glucose uptake activity and inhibited the translocation of GLUT4 in adipose tissue. Therefore, in this study, we investigated the effects of tea catechins on glucose uptake activity and the mechanism by which catechins modulate the translocation of GLUT4 in 3T3-L1 cells.
Materials and methods
Chemicals and antibodies
Catechins were obtained from Kurita Kogyo (Tokyo, Japan). For the glucose uptake assay, [3H]-3-O-methyl-D-glucose (3-OMG) was obtained from DuPont/NEN Research Products (Boston, MA). For the Western blot analysis, anti-GLUT4 goat IgG, anti-GLUT1 goat IgG, anti-β-actin mouse IgG, anti-IRβ rabbit IgG, anti-mouse IgG, anti-goat IgG, and anti-rabbit IgG antibodies were purchased from Santa Cruz Biotechnology Inc. (Santa Cruz, CA), anti-Akt rabbit IgG, anti-PKCλ rabbit IgG, and anti-phospho-PKCλ/ζ rabbit IgG from Cell Signaling Technology, Ins. (Danvers, MA), anti-PY20 mouse IgG from Transduction Laboratories Ltd. (San Diego, CA), and anti-phospho-Akt rabbit IgG from Sigma Chemical Co. (St. Louis, MO). All other reagents used were of the highest grade available commercially.Fractionation of green tea extract
Dried green tea leaves (Camellia sinensis) (500 g) were extracted with ethanol, and the extracts were separated into six fractions as described.17 Briefly, green tea leaves were percolated with 75% ethanol (F1), and the extract was partitioned between each organic solvent and water after the extract had been dried by evaporation in vacuo. Step-wise partition was carried out by using hexane (F2), chloroform (F3), ethyl acetate (F4), and n-butanol (F5) against the ethanol extract.Cell culture and glucose uptake assay
Cultures and the differentiation of 3T3-L1 cells were performed as described.18 The differentiated adipocytes on the 24-well plate were serum-starved for 18 h in DMEM containing 0.2% BSA at 37 °C. The cells were incubated with various catechins at 30 μM for 30 min in the presence or absence of 100 nM insulin in Krebs-Ringer phosphate-HEPES buffer (KRH; 50 mM HEPES, pH 7.4, 137 mM NaCl, 4.8 mM KCl, 1.85 mM CaCl2, and 1.3 mM MgSO4). Then a final concentration of 6.5 mM (0.5 μCi) [3H]-3-OMG was added and incubated for 1 min at 37 °C. As positive and negative controls, 100 nM insulin and DMSO (final concentration, 0.1%) as a vehicle were given to the cells for 15 min, respectively. The uptake was terminated by immediate washing the adipocytes four times with ice-cold KRH, and the cells were solubilized with a 0.5% SDS solution. Non-specific uptake was measured in the presence of 20 μM cytochalasin B as an inhibitor of glucose transporters. The radioactivity was measured by a liquid scintillation counter with a scintillation cocktail.Immunoprecipitation and immunoblotting
The differentiated adipocytes were incubated with 50 μM EC and EGC in the absence of insulin, and Cg and EGCg in the presence of 100 nM insulin for 30 min. The membrane fraction and cell lysate were prepared as described.19 To detect phosphorylation of IR, the cell lysate (300 μg) was incubated with 20 μg of a 50% protein A/G plus-agarose suspension (Santa Cruz Biotechnology) for 1 h at 4 °C and centrifuged to remove the agarose resin to which was bound the non-specific protein. The supernatant was incubated with 5 μl of anti-PY20 overnight at 4 °C. A new 20 μg of the protein A/G plus-agarose suspension was added to this mixture, and incubated for another 1 h at 4 °C. After the agarose resin was washed four times with an ice-cold RIPA buffer [10 mM Tris, pH 8.0, 150 mM NaCl, 1.0% NP-40, 0.5% sodium deoxycholate, 0.1% sodium dodecyl sulfate (SDS), 0.5 mM 1 mM phenylmethylsulfonyl floride (PMSF), 10 μg ml−1 leupeptin, 1 mM Na3VO4, 10 mM NaF, and 0.5 mM dithiotheritol (DTT)], it was subjected to SDS-PAGE followed by Western blot analysis to detected phosphoryated IR. To detect GLUT4 translocation, the plasma membrane fraction was subjected to Western blot analysis as described.19 To detect the expression and phosphorylation of proteins involved in the insulin signaling pathway, cell lysate was subjected SDS-PAGE followed by Western blotting.Statistical analysis
Statistical analyses were performed with Student's t-test. Significance was defined as p< 0.05.Results
Effects of tea catechins on glucose uptake activity in 3T3-L1 cells
We investigated the effects of tea catechins on glucose uptake activity in the cells because green tea, which contains variously polyphenols especially catechins, modulates glucose uptake activity in vivo.15 The cells were incubated with various catechins at 50 μM in the presence or absence of 100 nM insulin. In the absence of insulin, C, EC, GC, EGC and EGCg increased glucose uptake activity significantly, approximately 2.2-, 3.5-, 3.1-, 3.5-, and 2.2-fold, respectively (Fig. 1A) compared with DMSO as a negative control. In the presence of insulin, Cg, ECg, GCg, and EGCg decreased insulin-induced glucose uptake activity significantly, approximately 0.2-, 0.5-. 0.5-, and 0.6-fold, respectively (Fig. 1B) compared with insulin as a positive control. EC and EGC, the two most effective compounds, increased the activity in a dose- and time-dependent manner (Fig. 2A, B), and treatment with no less than 5 μM for 30 min and with 50 μM for no less than 5 min had a significant effect. Cg and EGCg decreased the insulin-induced activity in a dose- and time-dependent manner (Fig. 2C, D) and treatment with no less than 5 μM for 30 min and with 50 μM for no less than 1 min had a significant effect. These results suggested that nongallate-type catechins increased glucose uptake activity in the absence of insulin whereas gallate-type catechins decreased insulin-induced activity in 3T3-L1 cells. Interestingly, EGCg revealed both effects.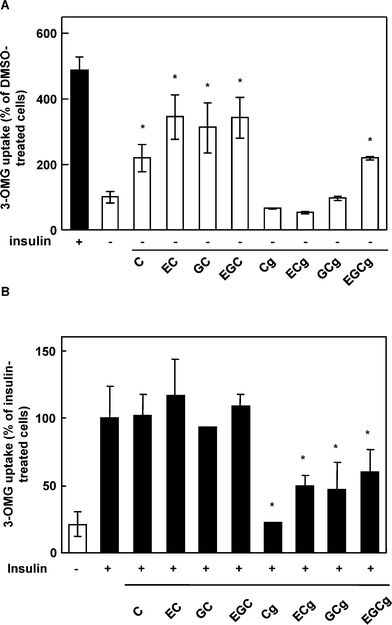 | ||
| Fig. 1 Effect of catechins on glucose uptake activity in the absence or presence of insulin in 3T3-L1 cells. The cells were treated with 50 μM catechins in the absence (A) or precsence (B) of insulin for 30 min. Values are calculated relative to DMSO-treated cells (A) or insulin-treated cells (B) and expressed as the means ± SE (n = 4). * Significant difference from the DMSO-treated cells (A) or insulin-treated cells (B), p < 0.05 by Student's t-test. C, Catechin; EC, epicatechin; GC, gallocatechin; EGC, epigallocatechin; Cg, catechin gallate; ECg, epicatecin; GCg, gallate gallocatechin gallate; and EGCg, epigallocatechin gallate. | ||
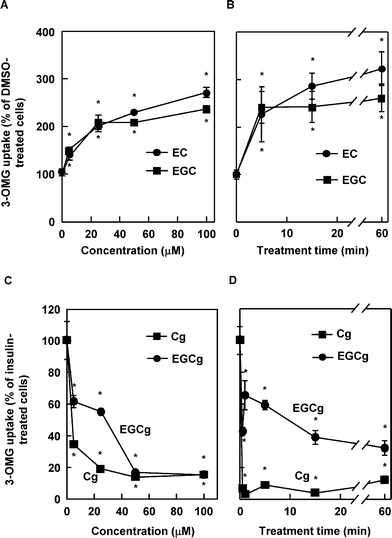 | ||
| Fig. 2 Dose- and time-dependent effect of selected catechins on glucose uptake activity in 3T3-L1 cells. The cells were treated with EC and ECG at the indicated concentration for 30 min (A) or at 50 μM for the indicated period (B) in the absence of insulin. The cells were treated with Cg and EGCg at the indicated concentration for 30 min (C) or at 50 μM for the indicated period (D) in the presence of insulin. Values are calculated relative to the DMSO-treated cells (A, B) or insulin-treated cells (C, D) and expressed as the mean ± SE (n = 4). * Significant difference from the DMSO-treated cells (A, B) or insulin-treated cells (C, D), p < 0.05 by Student's t-test. | ||
The effects of tea catechins on the translocation of GLUT4 in 3T3-L1 cells
We further investigated the effects of EC, EGC, Cg, and EGCg on the translocation of GLUT4 to the plasma membrane in 3T3-L1 cells. In the absence of insulin, EC and EGC at 50 μM significantly increased the amount of GLUT4 in the plasma membrane fraction compared with DMSO as the vehicle control (Fig. 3A). On the other hand, in the presence of 100 nM insulin, Cg and EGCg at 50 μM significantly decreased the amount of GLUT4 in the plasma membrane fraction compared with insulin as the positive control (Fig. 3A). As to the GLUT1, the amount of it on the plasma membrane fraction was remained unchanged. Moreover, these catechins did not affect the expression levels of GLUT4 in the cells (Fig. 3B). Thus, nongallate-type catechins promoted the translocation of GLUT4, whereas gallate-type catechins decreased the insulin-induced translocation.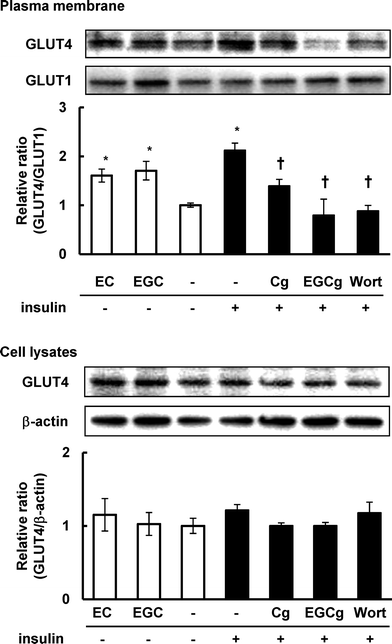 | ||
| Fig. 3 Effect of catechins on GLUT4 translocation in 3T3-L1 cells. The cells were treated with 50 μM catechins for 30 min in the absence or presence of insulin. GLUT4 and GLUT1 proteins on the plasma membrane and expression levels of GLUT4 and β-actin in cell lysates were detected by Western blotting analysis. Values are the mean ± S.E. of triplicates. * Significant difference from the DMSO-treated cells, p < 0.05 by Student's t-test. | ||
The effects of tea catechis on the insulin signaling pathway in 3T3-L1 cells
Since the insulin-induced translocation of GLUT4 requires the activation of several proteins in the insulin signaling pathway, we investigated the activation of IRβ, Akt, and atypical PKC in 3T3-L1 cells after treatment with EC, EGC, Cg, and EGCg. Although, EC and EGC did not affect phosphorylation of IRβ, and its downstream Akt (Fig. 4), they significantly phosphorylated PKCλ/ζ compared with DMSO-treated cells. In insulin-treated cells, Cg and EGCg significantly decreased phosphorylation of PKCλ/ζ in the presence of insulin compared with insulin-treated cells without affecting the insulin-induced phosphorylation of IR, and Akt. Moreover, these catechins did not affect expression levels of these proteins in the cells under our experimental conditions.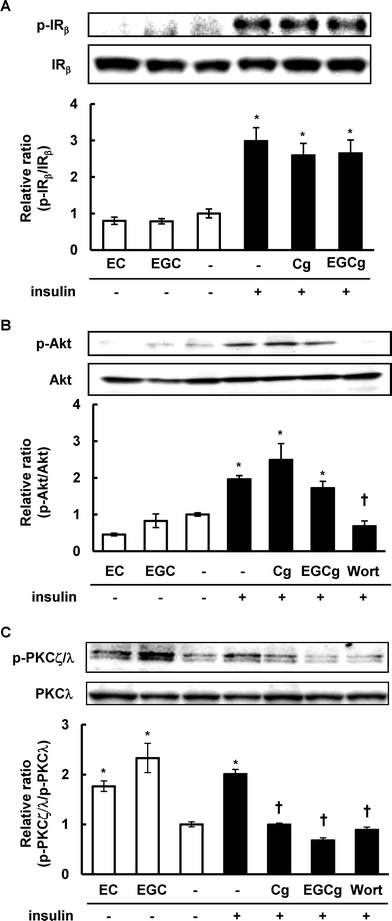 | ||
| Fig. 4 Effect of catechins on insulin signaling pathway in 3T3-L1 cells. The cells were treated with 50 μM catechins for 30 min in the absence or presence of insulin. The phosphorylation and expression levels of IR, Akt, and PKCζ/λ were detected by Western blotting. Values are the mean ± S.E. of triplicates. * Significant difference from the DMSO-treated cells, † significant difference from insulin-treated cells, p < 0.05 by Student's t-test. | ||
The effects of EC and EGC on the glucose uptake activity in the PI3K inhibitor-treated cells
To confirm whether EC- and EGC-increased glucose uptake activity is involved in the activation of the insulin signaling pathway, we used wortmannin and LY294002 as the PI3K inhibitors. Both inhibitors decreased either insulin-induced or EC- and EGC-induced glucose uptake activity (Fig. 5). These results suggested that EC and EGC promoted the translocation of GLUT4 through the activation of PI3K.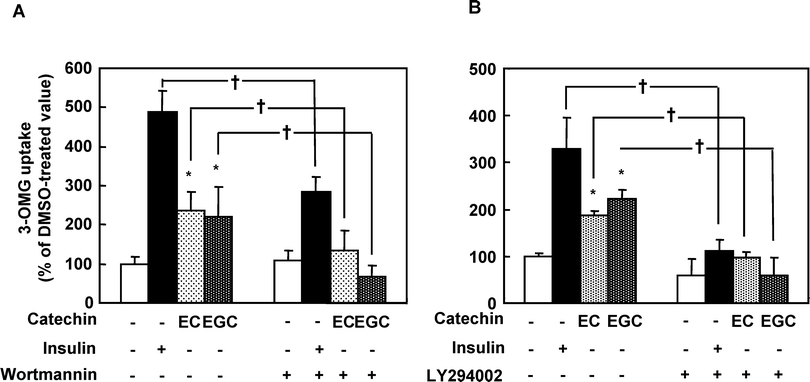 | ||
| Fig. 5 Effects of LY294002 and wortmaninn on the EC- and EGC-induced glucose uptake activity in 3T3-L1 cells. Serum-starved cells were incubated with 100 μM LY294002 or 100 nM wortmaninn for 10 min, and treated with 50 μM catechins for another 30 min. DMSO and 100 nM insulin were used for a negative and positive control, respectively. Data are expressed as the mean ± SE (n = 4). * Significant difference from control, p < 0.05 by Student's t-test. | ||
Effects of tea fractions on glucose uptake activity in 3T3-L1 cells
Finally, we checked the effects of tea fractions on glucose uptake in 3T3-L1 cells using [3H]-3-OMG. The ethanol extract of tea was suspended in water and partitioned with hexane, chloroform, ethyl acetate, n-butanol, and water step-wisely (Fig. 6A). All the fractions expected for the water fraction decreased insulin-induced glucose uptake activity in the cells, with the ethyl acetate fraction being the most effective and significantly decreased glucose uptake compared with insulin-treated cells (Fig. 6B). This fraction is known to be in the most catechin-rich fraction in the ethanol extract of tea.17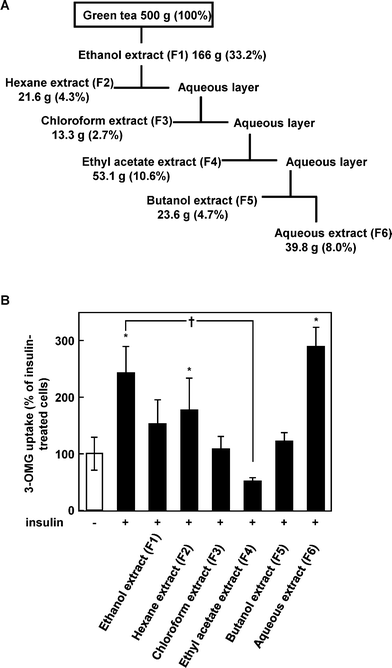 | ||
| Fig. 6 Green tea fractions modulate glucose uptake activity in 3T3-L1 cells. (A) Green tea was extracted with ethanol and fractionated with organic solvents, as described in Materials and methods. (B) The cells were treated with each fraction for 15 min and co-incubated with 100 nM insulin for an additional 15 min. Data are expressed as the mean ± SE (n = 4). *Significant difference from control, †significant difference from insulin-treated cells, p < 0.05 by Student's t-test. | ||
Discussion
The incidence of hypoglycemia is increasing year by year all over the world. Compounds are therefore required which regulate blood glucose levels. Our previous report demonstrated that an intake of green tea decreased glucose uptake activity and the translocation of GLUT4 in adipose tissue of Wistar rats.15 In this study, we examined the effects of eight catechins on glucose uptake in 3T3-L1 cells to obtain the effective compound on glucose transport system. We found interesting results that nongallate-type catechins increased glucose uptake activity in the absence of insulin whereas gallate-type catechins decreased in 3T3-L1 cells (Fig. 1). Moreover, we also found that these effects were accompanied by GLUT4 translocation; i.e., nongallate-type catechins promoted the translocation without insulin whereas gallate-type catechins decreased the insulin-induced translocation (Fig. 3). This is the first report for the structure–activity relationship of catechins on the glucose transport system, although this relationship is specific in adipose tissue but not in muscle cells.16 Nomura et al. reported that EGCg decreased insulin-induced glucose uptake activity but catechin had no effect in mouse MC3T3-G2/PA6 adipose cells.20 In adipose tissue, GLUT1 and GLUT4 play a role in regulating glucose uptake into the cells. Tea catechins and insulin did not affect glucose uptake activity in the preadipocytes, which had not expressed GLUT4 (data not shown), suggesting that tea catechins did not affect the function of GLUT1. We also checked that gallic acid and its related compounds did not affect glucose uptake activity in the presence or absence of insulin in 3T3-L1 cells (data not shown). It is, therefore, strongly suggested that the presence of galloyl ester at the C3 position plays an important role in the different mechanisms regulating GLUT4 translocation in adipose cells. It was reported that hydrophobic group at C3 position enhanced the function of catechins. Park et al. reported that 3-O-acyl and alkyl-(−)-epicatechins showed stronger anti-cancer effect than epicatechin.24 Stapleton et al. demonstrated that 3-O-acyl-(−)-catechins revealed higher anti-staphylococcal activity than catechin because these compounds have higher affinity to the cytoplasmic membrane than catechin.25 Moreover, Kajiya et al. showed that the galloyl group at C3 position affected the affinity for lipid bilayer membrane by measurement of the incorporated amount of catechins into liposome.26 Therefore, we proposed a hypothesis that gallate-type catechins bind strongly to the lipid bilayer membrane of adipose cells and decrease the function of glucose transport system compared to nongallate-type catechins.As the mechanism by which nongallate-type catechins increase glucose uptake activity in 3T3-L1 cells, our results indicated that the translocation of GLUT4 was promoted through the activation of PI3K without phosphorylation of IRβ (Fig. 4 and 5). This mechanism is similar to that of EGCg in skeletal muscle cells,16 and actually EGCg slightly increased glucose uptake activity without insulin in 3T3-L1 cells (Fig. 2). On the other hand, our results suggested that gallate-type catecins decreased the insulin-induced translocation of GLUT4 by inhibiting phosphorylation of PKCλ/ζ, downstream of PI3K (Fig. 5). Harmon et al. showed that narigenin, grapefruit flavanone, did not affect phosphorylation of IR and IRS-1 but inhibited PI3K activity, resulting in decreasing the insulin-induced glucose uptake in 3T3-L1 cells.21 We proposed that gallate-type catechins inhibit PI3K activity or the TC10 pathway in 3T3-L1 cells. TC10 is a member of the Rho family of small GTP-binding protein and plays an important role in the control of insulin action in adipocytes.22 Insulin promotes phosphorylation of Cbl, a substrate for insulin receptor tyrosine kinase, followed by activation of TC10. Recent study showed that TC10 promoted phosphorylation of PKCλ/ζ through a PI3K-independent pathway in 3T3-L1 cells.23 In skeletal muscle cells, EGCg did not inhibit the effect of insulin on the translocation of GLUT4 and glucose uptake activity,16 and TC10 expression was lower than in adipose tissue.22 Therefore, gallate-type catechins might inhibit the Cbl-TC10 pathway in 3T3-L1 cells. Further investigation will be required to examine the effects of catechins on the TC10 pathway.
In this study, we also showed that the ethyl acetate fraction of green tea had the strongest inhibitory effect on glucose uptake (Fig. 6). It is known that the ethyl acetate fraction contained large amounts of catechins especially gallate-type catechins such as EGCg than other fractions.17 Other fractions except water fraction also decreased insulin-induced glucose uptake activity in the cells (Fig. 6). The hexane fraction contained mainly lipids and pigments such as lutein and chlorophyll a and b, and the chloroform fraction contained abundant caffeine.17 It was reported that caffeine decreased insulin-induced glucose uptake in rat adipose cells through inhibition of Akt activity.27 As to the butanol fraction, this fraction contained saponin28 and flavonoid glycosides.17 From these results, several active compounds including gallate-type catechins will orchestrate to inhibit the glucose transport system in adipocytes. Indeed, our previous report demonstrated the intake of green tea decreased glucose uptake and GLUT4 translocation in adipose tissue of rats.15 Among the active compounds in tea, EGCg might mainly affect glucose transport in adipose tissue in vivo. It had reported that EGCg has anti-obesity and hypoglycemic effects.29–31 Wolfram et al. showed that the intake of EGCg for 5 months reduced blood glucose levels of C57BL/6J mice fed a high-fat diet.29 Bose et al. demonstrated that long-term EGCg treatment (3.2 g kg−1 diet, 16 weeks) reduced body weight gain, fat weight, and liver weight and short-term EGCg treatment (4 weeks) decreased mesenteric fat weight and blood glucose levels in C57BL/6J mice fed a high-fat diet.30 Chen et al. also showed that EGCg decreased body fat mass in Sprague Dawley rats fed a high-fat diet.31 On the other hand, our previous studies showed that catechins increased glucose uptake activity in skeletal muscle, the most important tissue for glucose utilization.15,16 Therefore, we assume that catechins modulate glucose transport in skeletal muscle and adipose tissue, resulting in a reduction in adipose tissue weight and blood glucose levels.
In conclusion, green tea extracts decreased the glucose uptake activity in 3T3-L1 cells, and gallate-type catechins contributed to this effect. Moreover, nongallate-type catechins stimulated glucose uptake activity without insulin in 3T3-L1 cells accompanied with GLUT4 translocation. Therefore, tea catechins modulate the glucose transport in adipose tissue, affecting blood glucose levels.
Acknowledgements
Part of this study was supported by Creation of Innovation Centers for Advanced Interdisciplinary Research Areas in Special Coordination Funds for Promoting Science and Technology Program by MEXT, Japan and by a grant from the Research Fellowships of the Japan Society for the Promotion of Science for Young Scientists (M.U.).References
- H. G. Joost, G. I. Bell, J. D. Best, M. J. Birnbaum, M. J. Charron, Y. T. Chen, H. Doege, D. E. James, H. F. Lodish, K. H. Moley, J. F. Moley, M. Mueckler, S. Rogers, A. Schürmann, S. Seino and B. Thorens, Am. J. Endocrinol. Metab., 2002, 282, 974–976 Search PubMed.
- M. Uldry and B. Thorens, Eur. J. Physiol., 2004, 447, 480–489 Search PubMed.
- J. Yang and G. D. Holman, J. Biol. Chem., 1993, 268, 4600–4603 CAS.
- L. Chang, S. H. Chiang and A. R. Saltiel, Mol. Med., 2004, 10, 7–12.
- Q. L. Zhou, J. G. Park, Z. Y. Jiang, J. J. Holik, P. Mitra, S. Semiz, A. Guilherme, A. M. Powelka, X. Tang, J. Virbasius and M. P. Czech, Biochem. Soc. Trans., 2004, 32, 817–821 CrossRef CAS.
- M. L. Standaert, G. Bandyopadhyay, M. P. Sajan, L. Cong, M. J. Quon and R. V. Farese, J. Biol. Chem., 1999, 274, 14074–14078 CrossRef CAS.
- M. P. Sajan, J. Rivas, P. Li, M. L. Standaert and R. V. Farese1, J. Biol. Chem., 2006, 281, 17466–17473 CrossRef CAS.
- K. L. Kuo, K. L. Uo, M. S. Weng, C. T. Ching, Y. J. Tsai, S. Y. Lin-Shiau and J. K. Lin, J. Agric. Food Chem., 2005, 53, 480–489 CrossRef CAS.
- A. Rietveld and S. Wiseman, J. Nutr., 2003, 133, 3285–3292.
- M. G. L. Hertog, P. C. H. Hollman, M. B. Katan and D. Kromhout, Nutr. Cancer, 1993, 20, 21–29 Search PubMed.
- C. S. Yang and Z. Y. Wang, J. Natl. Cancer Inst., 1993, 85, 1031–1049 CrossRef.
- D. X. Hou, S. Masuzaki, F. Hashimoto, T. Uto, S. Tanigawa, M. Fujii and Y. Sakata, Arch. Biochem. Biophys., 2007, 460, 67–74 CrossRef CAS.
- Y. Itoh, T. Yasui, A. Okada, K. Tozawa, Y. Hayashi and K. Kohri, Urol. Res., 2005, 33, 261–266 CrossRef.
- H. S. Moon, C. S. Chung, H. G. Lee, T. G. Kim, Y. J. Choi and C. S. Cho, Obesity, 2007, 15, 2571–2582 CrossRef CAS.
- H. Asida, T. Furuyasiki, H. Nagayasu, H. Bessho, H. Sakakibara, T. Hashimoto and K. Kanazawa, BioFactors, 2004, 22, 135–140 Search PubMed.
- M. Ueda, S. Nishiumi, H. Nagayasu, I. Fukuda, K. Yoshida and H. Ashida, Biochem. Biophys. Res. Commun., 2008, 377, 286–290 CrossRef CAS.
- I. Fukuda, I. Sakane, Y. Yabushita, R. Kodoi, S. Nishiumi, T. Kakuda, S. Sawamura, K. Kanazawa and H. Ashida, J. Agric. Food Chem., 2004, 52, 2499–2506 CrossRef CAS.
- T. Furuyashiki, H. Nagayasu, Y. Aoki, H. Bessho, T. Hashimoto, K. Kanazawa and H. Ashida, Biosci., Biotechnol., Biochem., 2004, 68, 2353–2359 CrossRef CAS.
- S. Nishiumi and H. Ashida, Biosci., Biotechnol., Biochem., 2007, 71, 2343–2346 CrossRef CAS.
- M. Nomura, T. Takahashi, N. Nagata, K. Tsutsumi, S. Kobayashi, T. Akiba, K. Yokogawa, S. Moritani and K. Miyamoto, Biol. Pharm. Bull., 2008, 31, 1403–1409 CrossRef CAS.
- A. W. Hormon and Y. M. Patel, Biochem. Biophys. Res. Commun., 2003, 305, 229–234 CrossRef.
- L. JeBailey, A. Rudich, X. Huang, C. Di Ciano-Oliveira, K. Kapus and A. Klip, Mol. Endocrinol., 2004, 18, 359–372 CAS.
- M. Kanzaki, S. Mora, J. B. Hwang, A. R. Saltiel and J. E. Pessin, J. Cell Biol., 2004, 164, 279–290 CrossRef CAS.
- K. D. Park, S. G. Lee, S. U. Kim, S. H. Kim, W. S. Sun, S. J. Cho and D. H. Jeong, Bioorg. Med. Chem. Lett., 2004, 14, 5189–5192 CrossRef CAS.
- P. D. Stapleton, S. Shah, J. M. T. Hamilton-Miller, Y. Hara, Y. Nagaoka, S. Uesato and P. W. Taylor, Int. J. Antimicrob. Agents, 2004, 24, 374–380 CrossRef CAS.
- K. Kajiya, S. Kumazawa and T. Nakayama, Biosci., Biotechnol., Biochem., 2001, 65, 2638–2642 CrossRef CAS.
- T. Akiba, K. yaguchi, K. Tsutsumi, T. Nishioka, I. Koyama, M. Nomura, K. Yokogawa, S. Moritani and K. Miyamoto, Biochem. Pharmacol., 2004, 68, 1929–1937 CrossRef CAS.
- Y. M. Sagesaka, T. Uemura, N. Watanabe, K. Sakata and J. Uzawa, Biosci., Biotechnol., Biochem., 1994, 58, 2036–2040 CAS.
- S. Wolfram, D. Raederstorff, Y. Wang, S. D. Teixeira, V. Elste and P. Weber, Ann. Nutr. Metab., 2005, 49, 54–63 CrossRef CAS.
- M. Bose, J. D. Lambert, J. Ju, K. R. Reuhl, S. A. Shapses and C. S. Yang, J. Nutr., 2008, 138, 1677–1683 CAS.
- N. Chen, R. Bezzina, E. Hinch, P. A. Lewandowsli, D. Cammeron-Smith, M. L. Mathai, M. Jois, A. J. Sinclair, D. P. Begg, J. D. Wark, H. S. Weisinger and R. S. Weisinger, Nutr. Res., 2009, 29, 784–793 CrossRef CAS.
| This journal is © The Royal Society of Chemistry 2010 |