The potential use of fauna and bacteria as ecological indicators for the assessment of groundwater quality†
Heide
Stein
a,
Claudia
Kellermann
b,
Susanne I.
Schmidt
c,
Heike
Brielmann
b,
Christian
Steube
b,
Sven E.
Berkhoff
a,
Andreas
Fuchs
a,
Hans Jürgen
Hahn
a,
Barbara
Thulin
d and
Christian
Griebler
*b
aUniversity of Koblenz-Landau, Campus Landau, Department of Biology, Im Fort 7, D-76829, Landau, Germany
bHelmholtz Zentrum München – German Research Center for Environmental Health (GmbH), Institute of Groundwater Ecology, Ingolstaedter Landstrasse 1, D-85764, Neuherberg, Germany. E-mail: christian.griebler@helmholtz-muenchen.de; Fax: +49 89 3187 3361; Tel: +49 89 3187 2564
cCentre for Systems Biology, School of Biosciences, University of Birmingham, Edgbaston, UK B15 2TT
dGeo Innova AB, Arvid Hedvalls Backe 4, S- 411 33, Göteborg, Sweden
First published on 24th November 2009
Abstract
The use of ecological criteria for the assessment of aquatic ecosystem status is routine for surface waters. So far no ecological parameters are considered for the assessment and monitoring of groundwater quality. It has been well known for decades that aquifers are ecosystems harbouring a vast diversity of invertebrates and microorganisms. The growing knowledge on groundwater microbial and faunal communities as well as the molecular and statistical tools available form a solid ground for the development of first ecologically sound assessment schemes. The sensitivity of groundwater communities towards impacts from land use and surface waters is exemplarily demonstrated by a data set of two geologically similar but hydrologically partially separated aquifer systems. Subgroups of the fauna in groundwater (stygobites vs. stygophiles and stygoxenes) successfully indicated elevated nitrate impacts linked to land use activities. Within the microbial communities, impacts from land use are mirrored by high bacterial biodiversity values atypical for pristine groundwater of comparable systems. The data show that there is legitimate hope for the application of ecological criteria for groundwater quality assessment in the future.
Environmental impactAquifers are hidden ecosystems. Compared to surface waters, groundwaters have received little attention from an ecological point of view. Today, these most important drinking water reservoirs are subject to frequent and ongoing threats caused by the introduction of contaminants and overexploitation. In the long-term, these anthropogenic impacts will not only affect groundwater quality but will also impair ecosystem functioning. Since biological activities of groundwater organisms provide water purification and storage, groundwater quality highly depends on ecosystem health. It is time to think about ecological criteria for the assessment of groundwater quality, since for surface waters this is routine for decades. In this study the sensitivity of biological variables (microbial and faunal) to environmental impacts was evaluated, constituting a first step towards an integrative groundwater assessment scheme. |
1. Introduction
In Europe, drinking water originates, to a large extent, from groundwater. Safeguarding drinking water resources thus necessarily means protection of groundwater ecosystems. Besides the service of drinking water provision, groundwater ecosystems sustain the integrity of most surface aquatic and terrestrial ecosystems. Consequently, all ecosystems connected to aquifers depend on groundwater in sufficient quality and quantity.Groundwater quality issues are almost exclusively addressed by abiotic, physicochemical criteria.1 These are complemented only by routine bacteriological tests (plate counts) to check for the putative presence of pathogenic microorganisms. There are several quality and quantity aspects related to groundwater which cannot be addressed satisfactorily by abiotic criteria alone.2–5 Since the anthropogenic stressors can be physical (e.g. temperature), chemical (e.g. pollutants), and biological (e.g. pathogens), the assessment of ecosystems should consider all of them. Moreover, physicochemical changes directly impact the biological compartment of an ecosystem with a back coupling. An integrative assessment thus needs a set of abiotic and biotic criteria to assess the environmental status, to monitor trends over time, to provide early warning of ecosystem deterioration, and to diagnose the cause of an existing impact.6 Fortunately, the increasing public and political recognition of ecological sustainability (e.g. Quevauviller7) clearly calls for the consideration of ecological aspects in modern monitoring schemes, triggering a paradigm change in groundwater management.8
The use of organisms as bioindicators has a long-standing history and tradition in surface waters. With a delay of several decades, ‘biological criteria’ have made their way into most national and international water-related directives. A powerful example is the European Water Framework Directive,9 in which several biological indices form an important basis for the assessment of water quality and ecosystem status. Although continental groundwater ecosystems are the world's largest freshwater domain, being essential reservoirs for drinking water, agriculture and industry, they have not received comparable attention so far. Indeed, there is no doubt that aquifers are ecosystems10 inhabited by a vast diversity of microorganisms11,12 and groundwater fauna.13 It is exactly the living component of the aquifers that are responsible for groundwater purification and storage.3,5,14
In the recent past, it has been frequently argued that a paradigm shift in groundwater management is due.7 In fact, new integrative assessment schemes and groundwater management concepts, based on the knowledge and experience from decades of ecological research are available. But yet it turns out difficult to implement these measures because of significant uncertainties about the distribution, taxonomy and ecology of groundwater microbes and fauna. Still, sensitive ecological parameters and reliable bioindicators await identification. Moreover, a multitude of sampling techniques is available but standardised protocols are lacking.1,3,8 Due to the different organismic repertoire and environmental constraints, existing surface water protocols and indices cannot just be transferred and adapted for aquifers. They need to be carefully developed and complemented.
Without doubt groundwater communities have the potential to function as indicators of ecosystem health and water quality.3,5 Organisms integrate impacts over space (their habitat) and time, extending the information obtained from abiotic monitoring. Groundwater fauna is suggested to be very sensitive to environmental changes. This is mainly related to the relatively stable environmental conditions prevailing in aquifers. And indeed, a number of studies have demonstrated the applicability of fauna for monitoring purposes related to groundwater quality. Groundwater invertebrates have already been applied so far in the evaluation of surface water infiltration to aquifers.15–20 There have been studies performed on the impact of organic nutrients and pollution on groundwater,17,21,22 oxygen and redox conditions,23,24 sediment structure and porosity,23,25 and biogeographical aspects.26 Moreover, stygofauna have been explored as biomonitors of heavy metal contamination,27 as well as heat discharge to an aquifer.28
In contrast to the patchy distribution of invertebrates, microorganisms are omnipresent in groundwater and aquifers. Nevertheless, so far groundwater microorganisms and/or microbial measures such as microbial biomass, activity and diversity have hardly been considered as water quality criteria.29–31 Following the line of argument that microbes are involved in almost every geochemical process occurring in the subsurface and are therefore directly linked to prevailing abiotic conditions it seems worthwhile to consider them for the development of integrated assessment schemes, complementing the assessment of stygofauna. Moreover, microbes are characterised by short generation times and comparably high metabolic rates providing a fast reaction to environmental changes, while the stygofauna is predestined for time-integrated patterns because of their longevity. The central working hypothesis is that in low dynamic habitats microbial communities nicely reflect the in situ environmental conditions. In this sense, the abundance, biomass, and structure of microbial communities and their physiological status (activity) may serve as sensitive ecological criteria for short-term dynamics in aquifers. The general applicability of microbes as indicators for the assessment of aquatic ecosystem change has been proven for certain aspects.32–34
Within the framework of a current German research project funded by the Federal Environmental Agency (UBA) several aquifer systems located in geographically distinct areas of Germany are being investigated. The focus of the project is to develop an ecologically sound and integrative concept for the assessment of groundwater quality and ecosystem health. This attempt is distinguished by several steps including (i) the selection of appropriate biological and ecological parameters, (ii) the typology of groundwater ecosystems from an ecological point of view, (iii) the derivation of natural background values of biological parameters and definition of a reference status (“Leitbild”) for aquifers, (iv) the identification of potential bioindicators and deduction of threshold values, and, (v) the development of an assessment model.
In particular, this paper intents to discuss difficulties and perspectives in using groundwater fauna and bacteria as criteria for water quality and ecosystem health. Groundwater fauna and bacterial communities' data from two geologically similar aquifer systems (the Rur and Erft block) impacted by extensive land use (agriculture) are exemplarily exercised. A selected set of physicochemical variables was analysed in comparison to the abundance and diversity of fauna and bacteria with respect to spatiotemporal similarities and differences.
2. Materials and methods
2.1 Sampling area
Data presented originate from two sampling surveys in the area of the town of Euskirchen located southwest of Cologne in North Rhine Westphalia, Germany (Fig. 1). The aquifers in that region belong to the hydrogeological unit termed ‘The Sands and Gravels of the Lower Rhine’; see the classification by Kunkel et al.35 The area further belongs to the bioregion of ‘central lowland’ (Zentrales Flachland, Illies36) and the River Rhine catchment. On a smaller scale it is associated with the natural geographic region (Naturraum) ‘Kölner Bucht’ (Bay of Cologne). Although part of one huge aquifer type, the investigation area is separated into various hydrogeological subunits (blocks) formed by Tertiary and Quaternary tectonic movements37 (Fig. 1). Two of these blocks, the Rur and Erft block, have been investigated in this study. At each of these blocks ten wells ranging from 5 to 31 meters in depth were sampled in spring (April 2007) and autumn (October 2007). At the Rur block, three wells grouped together on a local scale (distance < 1 km; referred to as lumped wells) and seven wells distributed over a regional scale (≥ 1 km; referred to as dispersed wells). At the Erft block, the wells grouped into five lumped wells and five wells regionally dispersed. All wells were situated in the shallow Quaternary aquifer. | ||
| Fig. 1 Study area southwest of Cologne, Germany. The area is separated in various blocks. 10 groundwater monitoring wells were investigated in the southern parts of the Rur and Erft block, respectively. All wells are situated in the shallow Quaternary porous aquifer. | ||
2.2 Groundwater sampling
The selected sites were sampled in a different way for fauna and microorganisms. The faunistic samples along with sediment and detritus were extracted from the monitoring wells using a phreatic net sampler.38 Previous studies have shown that the groundwater fauna inside the well is representative of the adjacent aquifer.38,39To examine possible correlations between the groundwater fauna and prevailing physicochemical conditions at the monitoring well, well water was collected using a bailer (Bürkle Aquasampler 0.75 L) and subsequently bottled into prepared vials. The water was sampled close to the bottom of the well, right before the faunal collection had occurred. After having sampled fauna, well water and sediment, a submersible pump (MP1, Grundfos Corp.) was used to replace the well water and then to pump aquifer water according to the guidelines of the German Industrial Norm.40 Aquifer water was filled into appropriate glass and plastic bottles for further analyses of physicochemical and microbiological parameters. Samples were filtered on-site and/or preserved and transported to the lab and stored under cooled conditions (4 °C) until further processing.
2.3 Physicochemical analyses
General physicochemical parameters, such as temperature, electric conductivity (EC), pH, redox potential (EH), and dissolved oxygen (DO) were measured in water from the aquasampler as well as from pumped groundwater using field sensors (WTW, Weilheim, Germany). Well water and aquifer water samples were filtered through a 0.45 µm pore size filter (Millipore) for analyses of major ions and soluble reactive phosphate (SRP) while TOC measurements included particle ≤ 200 µm. Major anions (chloride, nitrate and sulfate) and cations (calcium, magnesium, potassium, sodium and ammonium) were measured by means of ion chromatography (Dionex Model DX 100). TOC was determined using high temperature combustion with infrared detection of CO2 (Shimadzu, TOC-5050). Orthophosphate was analysed colorimetrically as soluble reactive phosphorus (SRP) by the ammonium-molybdate method according to Murphy and Riley.41 Additionally, the relative amount of detritus (particulate organic matter), as part of the sediment sample collected from the well bottom, was estimated via an ordinal scale following Hahn.16Stable isotopes of oxygen (18O/16O) and hydrogen (2H/1H) were determined by isotope ratio mass spectrometry. The δ18O values in samples were analysed via equilibration with CO2 at 25 °C for 24h.42 and for δ2H values via reaction with Cr at 850 °C.43 Both, δ18O and δ2H values, were determined relative to internal standards that were calibrated using IAEA SMOW standards. Data were normalised following Coplen44 and are expressed relative to V-SMOW. Samples were measured at least in duplicates with a precision of ±0.1‰ for δ18O and ±1.0‰ for δ2H.
2.4 Analyses of groundwater fauna
Prior to further processing, fauna samples were fixed with 4% formaldehyde. In the laboratory the organisms were separated from sediments, counted and pre-sorted into taxonomic groups (crustaceans, oligochaets, water mites, nematodes, turballarians). All crustacean groups, which constitute the major part of the animals in groundwater samples, and oligochaets were determined to species level, whilst the remaining taxonomic groups were identified to order or higher level. For statistical analyses the crustaceans and oligochaets were distinguished into two ecological groups. One group comprising obligate groundwater organisms referred to as stygobites. The other group is characterised by non-stygobites including organisms frequently found in groundwater and able to survive considerable times in aquifers (stygophiles) as well as foreigners to aquifers originating from surface waters or soil (stygoxenes).2.5 Microbiological analyses
Total bacterial counts were determined from 15 mL of glutardialdehyde fixed (2% f. conc.) sample aliquots by epifluorescence microscopy of SYBR Green I (Molecular Probes) stained cells following a protocol of Griebler et al.45 For microbial community structure analysis, approximately 2.5 L of groundwater was filtered through 0.22 µm sterile membrane filters (Neolab). Filters were subsequently frozen and maintained at −20 °C. Later, freshly thawed filters were aseptically cut into small pieces (c. 2 mm2), which were then transferred into bead-beating cups and total DNA was extracted as described in Winderl et al.46 After extraction and precipitation, DNA pellets were resuspended in 25 µL of EB buffer (10mM Tris-HCl [pH 8.5], Qiagen) and stored frozen (−20 °C) until further analyses.T-RFLP analysis of bacterial 16S rRNA gene amplicons was performed as described previously46 with the primers Ba27f-FAM/907r and MspI digestion. Primary electropherogram analysis was conducted using the GENEMAPPER 5.1 software (Applied Biosystems) excluding peaks < 50 bp. Identification of baseline threshold of true peaks over noise and the alignment of terminal restriction fragments (T-RFs) were conducted with the help of the T-REX software.47 The software implements a procedure developed by Abdo et al.48 where true peaks are iteratively identified as those whose height exceeds (in our case one) standard deviation computed over all peaks. This way, T-RFs with a relative fluorescence signal of ≤ 100 were excluded from further analysis. Peak alignment in T-REX can be done automatically.49 A clustering threshold of ±0.5 bp was specified for the grouping of peaks into a common T-RF. The Shannon–Wiener index H′ was calculated as H′ = −∑ πlnπ, whereas π is the relative abundance of single T-RFs in a given fingerprint.50 The reproducibility of our workflow and of T-RFLP analysis was exemplarily verified via replicate fingerprinting analyses of duplicate DNA extracts from 36 of the 38 samples collected during the two campaigns. AMMI analysis (Additive Main Effects and Multiplicative Interaction model51) within T-REX suggested high reproducibility of replicate fingerprints (pattern: 90.6% of total interaction, noise: 9.4% of total interaction).
2.6 Statistical analyses
The conducted sampling approach resulted in two environmental datasets (well water and aquifer water) comprising each 16 quantitative physicochemical variables and two quantitative isotopic variables: water temperature, pH, EC, EH, DO, TOC, orthophosphate, major anions (HCO3−, Cl−, NO3−, SO42−), major cations (Na+, K+, Mg2+, Ca2+, NH4+), δ18O, and δ2H. For statistical analyses, variables were preliminarily log-normalized (except for pH) adding a translation constant when necessary and z-score standardised, resulting in dimensionless quantitative variables. In addition, two sets of biotic population data were generated: bacterial community data were expressed as relative abundance of detected T-RFs, while the counts of recovered faunal populations in wells were fourth root-transformed.52 Several statistical analyses were performed to search for patterns in bacterial community structures and faunal assemblages in relation to the hydrogeolocial subunits, season and the spatial distribution of groundwater wells. In addition, they were applied to attribute community patterns to the measured environmental variables. Generally, the analyses of faunal assemblages and bacterial communities were related to the physicochemical datasets of the groundwater, since no significant differences between well water and groundwater were found (see 3.1). To assess the trophic conditions at the well bottom, which constitutes the food basis for the stygofauna, faunal data were additionally compared with TOC values and the relative amount of detritus of well sediment.In a first step, the correlation between the two environmental datasets (well water, aquifer water) was evaluated by a Mantel Test, a multivariate permutational procedure.53 Principal component analysis (PCA) was conducted for each hydrogeological subunit (Rur and Erft block) to reduce the measured abiotic variables to meaningful components describing the major physicochemical and isotopic gradients encountered in the field. The impact of the two hydrogeological subunits (Rur and Erft block), seasons (spring and autumn), and the distribution of wells (lumped and dispersed) on the aquifer water dataset was tested with ADONIS54 (multivariate analysis of variance based on dissimilarity matrices) based on Euclidian distances.
Patterns in the bacterial community structure and faunal assemblages were explored by Nonmetric Multi Dimensional Scaling (referred to as MDS) based on Bray-Curtis dissimilarities. Additionally, for bacterial community data the impact of the two hydrogeological subunits, seasons, and the distribution of wells was also tested with ADONIS while for the faunal assemblages this was evaluated by the ANOSIM (analysis of similarities) procedure.55 Correlations of faunal data and physicochemical data were analysed by the Spearman rank test. Mann-Whitney U-test was used to detect differences of physicochemical parameters between wells dominated by stygobites and non-stygobites. Moreover, canonical correspondence analysis (CCA), a direct constrained ordination method that uses linear combinations of environmental (explanatory) variables to optimally explain the observed variance in T-RFs and faunal species56 were applied.
All statistical analyses were performed either with the R software, version 2.8.1, using the packages MASS,57 reshape 0.8.0 and vegan 1.8–8 (for the latter package the recommendations of the author were followed58), or with Primer v6, Plymouth Laboratories, Plymouth, UK) or SPSS v15 (SPSS Inc.).
3. Results
3.1 Physicochemical characteristics
The composition of well water and aquifer water correlated significantly (r = 0.805, p = 0.001, Mantel Test) in its physicochemical conditions. In Fig. 2 selected physicochemical parameters are separately depicted for the Erft and Rur block, distinguished into lumped and dispersed wells as well as spring and autumn samples. Multivariate Analysis of Variance (ADONIS) revealed small but highly significant differences in abiotic variables for the two blocks (R2 = 0.13, p = 0.005). Differences between the Rur and Erft block were detected especially for DO and nitrate. At the Rur block groundwater from two wells, i.e. 997391 and 281085, were characterised by reducing conditions, as can be seen from the absence of DO and nitrate (Fig. 2). Moreover, groundwater from a few other wells displayed low DO concentrations ≤ 4 mg L−1 (Fig. 2). With exception of the two wells yielding reduced groundwater, sites of both blocks showed nitrate concentrations distinctly elevated and exceeding by far the natural background values (NBV) described for this groundwater landscape.35 In case of EC, only water of well 390051 considerably exceeded the NBV accompanied by the highest δ18O values (Fig. 2). TOC values ranged from 0.7 to 1.5 mg L−1 (data not shown) and concentrations of soluble reactive phosphate (SRP) were generally below 50 µg L−1 with up to 180 µg L−1 in individual samples (Fig. 2). | ||
| Fig. 2 Selected physicochemical parameters determined in groundwater from wells distributed over the Rur and the Erft block, respectively. The first bar of each pair depicts the spring (April 2007) and the second the autumn (October 2007) measurements. Grey bars represent locally lumped and white bars regionally dispersed wells. Dashed lines and nearby values give the mean natural background values as defined by Kunkel et al.35 EC: electrical conductivity, δ18O: in water, DO: dissolved oxygen, SRP: soluble reactive phosphate. | ||
The physicochemical composition of groundwater from individual wells did not display any significant variation with season (spring and autumn) (R2 = 0.01, p > 0.9, ADONIS) (Fig. 2).
When the groundwater data is pooled for lumped and dispersed wells, the abiotic data was found dissimilar in both, the Rur block (R2 = 0.2, p = 0.01, ADONIS) and the Erft block (R2 = 0.31, p = 0.005, ADONIS). For a further evaluation of these detected differences, PCA were conducted for the abiotic datasets of the two blocks individually (Fig. 3). For the Erft block, groundwater samples evidently clustered into two groups (lumped/dispersed), separated mainly along the PC1-axis. PC1 explained 59% of the total variance and correlated with bicarbonate (−0.497) and calcium (−0.387). PC2 accounted for another 32% of the total variance and correlated mainly with DO (−0.674) (Fig. 3). For the Rur block, the distinction between groundwater samples from lumped and dispersed wells was less clear (Fig. 3). However, two of the lumped wells separated from all the other samples (in spring and in autumn) along PC2 that explained 27% of total variance and correlated with nitrate (−0.555), sodium (0.442) and bicarbonate (0.355). However, the main part of total variance was explained by PC1 (59%) strongly associated with nitrate (−0.621) (Fig. 3). The PCA plots support the results from ADONIS separating the lumped wells from the dispersed ones. Further, at the Erft block the physicochemical conditions of the lumped wells were more similar when compared to the dispersed ones, while at the Rur block the lumped wells displayed a considerably high variation (Fig. 3).
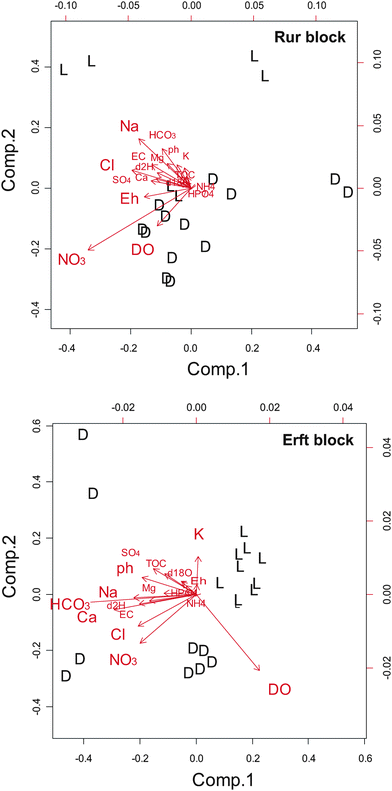 | ||
| Fig. 3 Principal component analysis (PCA), performed for the Rur and the Erft block, taking into account selected physicochemical parameters in relation to the spatial distribution of the sampled wells, either locally lumped (L) or regionally dispersed (D). | ||
3.2 Diversity, abundance and distribution patterns of groundwater fauna
In total, 22 species comprising crustaceans (73%) and oligochaets (27%) as well as five higher metazoan taxa (acari, insects, nematodes, macro-, and microturbellarians) were found in the 20 monitoring wells distributed to the Erft and Rur block, respectively. In all sampling sites metazoans were present, but at five wells invertebrates were found at only one sampling occasion, either spring or autumn. Amongst the metazoans that were determined to species level (crustaceans and oligochaets), 10 stygobiontic and 12 non-stygobiontic species were identified (Table 1). Most species and taxa (> 50%) occurred in low frequencies and were found in less than three wells. Diacyclops languidoides (Cyclopoida), as the most abundant species, was only found in six wells.| Erft block | Rur block | ||||||||||||||||||||
|---|---|---|---|---|---|---|---|---|---|---|---|---|---|---|---|---|---|---|---|---|---|
| Ecological group | 340251 | 340202 | 340242 | 340212 | 842211 | 842151 | 947552 | 340261 | 948221 | 948621 | 340482 | 997581 | 281085 | 390051 | 690072 | 600353 | 997701 | 997391 | 997641 | 997591 | |
| Group | Stygobites | ||||||||||||||||||||
| Amphipoda | Niphargus aquilex | 2 | 2 | ||||||||||||||||||
| Niphargus spec. | 2 | ||||||||||||||||||||
| Crangonyx subterraneus | 7 | 3 | |||||||||||||||||||
| Niphargellus nolli | 10 | 1 | |||||||||||||||||||
| Cyclopoida | Acanthocyclops sensitivus | 35 | |||||||||||||||||||
| Diacyclops languidoides | 3 | 182 | 65 | 89 | 18 | 2 | |||||||||||||||
| Harpacticoida | Bryocamptus typhlops | 2 | |||||||||||||||||||
| Syncarida | Bahtynella freiburgensis | ||||||||||||||||||||
| Pseudantrobathynella husmanni | 1 | ||||||||||||||||||||
| Ostracoda | Fabaeformiscandona breuili | 3 | |||||||||||||||||||
| Fabaeformiscandona spec. | 5 | 1 | |||||||||||||||||||
| Non-Stygobites | |||||||||||||||||||||
| Cyclopoida | Diacyclops bicuspidatus | 11 | |||||||||||||||||||
| Diacyclops bisetosus | 23 | 251 | 1 | 1 | 5 | ||||||||||||||||
| Diacyclops languidus | 1 | 16 | 1 | ||||||||||||||||||
| Paracyclops fimbriatus | 14 | 143 | |||||||||||||||||||
| Ostracoda | Pseudocandona albicans | 1 | |||||||||||||||||||
| Oligochaeta | Amphichaeta leydigii | 1 | 11 | ||||||||||||||||||
| Cernovsvitoviella atrata | 5 | 9 | 1 | 1 | |||||||||||||||||
| Dorydrilus michaelseni | 12 | 1 | |||||||||||||||||||
| Haplotaxis gordioides | 1 | 9 | |||||||||||||||||||
| Marionina riparia | 8 | ||||||||||||||||||||
| Mesenchytraeus armatus | 7 | ||||||||||||||||||||
No faunal differences were found between the wells of the Erft and the Rur block (Table 1) (ANOSIM R = 0.089). According to the faunal composition of the monitoring wells, two ecological groups, either dominated by non-stygobiontic (stygophiles and stygoxenes) or stygobiontic species, could be distinguished (Fig. 4A, ANOSIM R = 0.467). Furthermore, the monitoring wells harbouring stygobiontic biocoenoses can be divided in two subgroups. One subgroup, referred to as stygobiontic 1 in the MDS-plot (wells 948621, 997641) was dominated by the copepod Diacyclops languidoides (Cyclopoida), while amphipods (Niphargus aquilex, Niphargellus nolli, Crangonyx subterraneus) were the prevailing organisms in the other subgroup, labelled as stygobiontic 2 (wells 947552, 842211, 390051, 340482) (Fig 4A). In general, the wells dominated by non-stygobiontic species were characterised by a relatively heterogeneously composed community, resulting in the scattering observed in the MDS-plot (Fig. 4A).
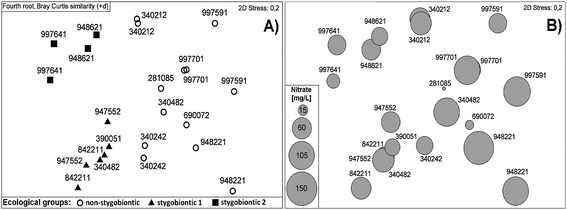 | ||
| Fig. 4 (A) MDS (Multidimensional scaling) of metazoan assemblages (mean values) recorded in groundwater monitoring wells at two sampling occasions in April and October 2007. Only wells populated by metazoan taxa, which could be classified to ecological groups, are included. (B) MDS overlaid by concentrations of nitrate. | ||
3.3 Bacterial community patterns
Mean values of bacterial abundance (BA) differed within the two blocks investigated. Groundwater from the Rur block aquifer contained 5.7 ± 4.5 × 10⁴ bacterial cells mL−1 and 4.8 ± 5 × 10⁴ bacterial cells mL−1 in spring and autumn, respectively. The high standard deviations are caused by extraordinary high BA values of individual wells, especially well 390051 (1.6 × 10⁵ in autumn) and 340482 (1.7 × 10⁵ in spring). The Erft block displayed considerable lower numbers with 2.4 ± 0.7 and 2.5 ± 0.5 × 10⁴ cells mL−1 in spring and autumn (data not shown).Groundwater bacterial communities, as analysed via T-RFLP fingerprinting, displayed no statistical differences between the two blocks (R2 = 0.039, p = 0.055, ADONIS). When pooling the data of both blocks, no differences were found between spring and autumn samples (R2 = 0.024, p = 0.72, ADONIS). Similarly, when looking at effects of the season for the individual blocks, no seasonal effects within the Rur block samples (R2 = 0.042, p = 0.78, ADONIS) and the Erft block (R2 = 0.044, p = 0.88, ADONIS) were found. This is best illustrated by a Multidimensional scaling (MDS) plot (Fig. 5). Moreover, the MDS analysis revealed a weak but significant difference between bacterial community composition of lumped and dispersed wells; for the Rur block (R2 = 0.11, p<0.005) and for the Erft block (R2 = 0.092, p = 0.005).
 | ||
| Fig. 5 MDS plot for the two hydrogeological units (Rur and Erft block) discriminating between samples from lumped (L) and dispersed (D) wells. Furthermore, spring and autumn samples are distinguished. | ||
A total of 611 different T-RFs were identified in 38 groundwater samples, of which 20 were collected in spring and 18 in autumn (for two of the autumn samples no T-RFLP data are available). In spring, 441 different T-RFs were detected for the wells of the Rur block, of which only 2 were found in all of the samples collected (Tab. 2). Eleven out of 441 T-RFs occurred in 9 of the 10 samples and 25% of the T-RFs were found in 50% (n = 5) of the samples taken. The picture was quite similar with the Erft block samples. Five out of the 433 T-RFs occurred in all samples, already 18 in 9 samples and 27% of the T-RFs were common to 50% of the groundwater samples. The patterns with autumn samples were found similar with respect to the individual blocks. Detailed data are summarized in table 2.
| No. of wells | Rur spring | Rur autumn | Erft spring | Erft autumn |
|---|---|---|---|---|
| 0 | 170 | 166 | 178 | 181 |
| 1 | 140 | 153 | 148 | 131 |
| 2 | 82 | 81 | 72 | 73 |
| 3 | 62 | 59 | 49 | 64 |
| 4 | 45 | 56 | 47 | 41 |
| 5 | 28 | 34 | 34 | 33 |
| 6 | 35 | 19 | 27 | 33 |
| 7 | 19 | 22 | 17 | 22 |
| 8 | 17 | 9 | 16 | 20 |
| 9 | 11 | 12 | 18 | 13 |
| 10 | 2 | 5 | ||
| total/block | 441 | 445 | 433 | 430 |
| total | 611 | 611 | 611 | 611 |
When looking at the presence and absence of individual T-RFs in the samples of the two blocks distinguished into spring and autumn, changes in the presence or distribution of individual T-RFs are visible (Fig. 6). Clearly, there are a considerable number of common T-RFs, indicating common components of natural bacterial communities in these aquifer systems.
 | ||
| Fig. 6 Frequency of appearance of individual T-RFs in samples from the Rur and Erft block in spring and autumn. | ||
The biodiversity within the bacterial communities as expressed by the Shannon-Wiener index (H′) was found considerably high. Bacterial diversity of samples from the Rur block exhibited mean values of H′ = 4.1 ± 0.7 (min 2.75, max 4.82) and 4.1 ± 0.4 (min 3.24, max 4.78) in spring and autumn, respectively. For the Erft block values of H′ = 4.2 ± 0.4 (min 3.66, max 4.70) and 4.0 ± 1.2 (min 3.59, max 4.82) in spring and autumn were found.
3.4 Relationship between chemistry, fauna and microorganisms
According to the data on physicochemical variables a few reasonable but weak correlations with groundwater fauna were found. The nitrate concentrations were positively correlated with the proportion (Spearman: R = 0.488, p = 0.002, n = 38), the taxa richness (R = 0.524; p = 0.001; n = 38) and abundance (R = 0.516, p = 0.001, n = 38) of non-stygobiontic species. Similarly, oxygen was positively correlated with the abundance of non-stygobiontic invertebrates (Spearman: R = 0.319, p = 0.045, n = 40). It was found that nitrate concentrations in groundwater were slightly higher at sites dominated by a non-stygobiontic biocoenosis (Mann-Whitney: p = 0.041, n = 24), as shown in Fig. 4B. With respect to the non-stygobiontic taxa richness, weak correlations were found also with the relative amount of detritus (Spearman: R = 0.329, p = 0.038, n = 40). Furthermore, the groundwater bacterial abundance (BA) correlated weakly positive with the proportion (R = 0.374, p = 0.017, n = 40), the abundance (R = 0.331, p = 0.037, n = 40) and the taxonomic richness (R = 0.317, p = 0.046, n = 40) of non-stygobiontic invertebrates. Additionally, the extraordinary high EC value at well 390051 was accompanied by a high BA in autumn, and the lowest bacterial diversity was found for well 997391 characterised by the lowest EC values and reduced conditions.Canonical correspondence analyses (CCA) were performed to further evaluate the relationship between selected physicochemical parameters and the presence of T-RFs. The CCA plots show that, for the Rur block, abiotic parameters tend to be correlated with certain sampling sites, and although they do not exhibit very clear patterns, all of them have high explanation power. There are numerous T-RFs which orientate along the gradients formed by orthophosphate and δ18O (Fig. 7). Moreover, certain T-RFs exhibit a negative correlation with EC. The CCA plot for the Erft block shows more pronounced patterns. Numerous T-RFs orientate along the gradients spanned by individual parameters to certain sampling sites. An example is again the PO43− gradient (Fig. 7) which is positively correlated to that of NO3− and EC.
 | ||
| Fig. 7 CCA ordination diagram of bacterial community data for the Rur (top) and Erft block (bottom) against environmental variables. Biplot representing the species (cross symbols), sites (black circles + label) and environment variables (arrows). The length of the arrow indicates the degree of correlation with the presented ordination axes. Axis CCA1 represents 20% and 19% of the inertia (weighted variance) for the Rur and Erft block, respectively. Axis CCA2 accounts for 18% and 17% of the inertia (weighted variance) for the Rur and Erft block, respectively. | ||
In a CCA analysis applying the pooled data set of fauna and T-RFs it could be seen that the large majority of T-RFs does not have high explanation power and is not correlated well with the patterns of faunal distribution. While some of the T-RFs were highly correlated with some of the invertebrate species (data not shown) however, the taxa explaining the majority of the variance, e.g. macroturbellarians, nematodes, harpacticoids, could not be related to any ecological group among the microbiological data.
4. Discussion and conclusion
4.1 Physicochemical conditions
The Rur and Erft block have a similar geologic background but have been described hydrologically separated.37 There is some recent evidence that this isolation is incomplete (N. Cremer pers. comm.). Fact is that both blocks generally displayed statistically similar physicochemical patterns. Although for individual parameters such as DO and nitrate differences were found. The investigation area of both blocks is shaped by extensive agricultural land use. While, based on concentrations of total organic carbon (TOC) and orthophosphate (SRP), the shallow Quaternary porous aquifers of the Rur and Erft block would still match the definition of oligotrophic and oligoalimonic conditions, nitrate concentrations clearly rank the aquifers as contaminated; see for comparison proposed nitrate natural background values (NBV) of this groundwater landscape35 (Fig. 2). The lacking correlation between nitrate and electric conductivity (EC) as a sum parameter for the major ions, as well as with individual major ions such as sulfate, chloride and calcium (data not shown) underline that the elevated nitrate concentrations are not a natural component in this system. In future, a combined analysis of 18O/16O and 15N/14N of nitrate could allow the specific origin of the nitrate detected. Outstanding low nitrate concentrations found at the wells 281085 and 997391 were linked to hypoxic/anoxic conditions and subsequent denitrification. Unfortunately, there is no clear explanation for the anoxic conditions in groundwater of the wells of the Rur block. It could not at all be explained by the TOC values which never exceeded 2 mg L−1 in the spring samples. Stable isotope measurements proved a comparable recharge/evaporation history for all waters sampled, with one exception. Groundwater from well 390051 at the Rur block exhibited considerably heavier δ18O and δ2H values accompanied by profoundly higher EC values, pointing at a higher degree of mineralization or evaporation.4.2 Groundwater fauna
A comparably low α-biodiversity, small number of specimen and the heterogeneous spatiotemporal distribution of fauna are features typical for pristine groundwater ecosystems.20,59–61 This picture is confirmed by the data presented. A total of 22 species were found in 20 wells investigated. This ‘one well to one species’ ratio, seems to be a general tendency when recording regional groundwater biodiversity from a small number of wells and limited sampling surveys. Data from south-western Germany supposed that regional taxonomic diversity is directly correlated with the number of wells sampled, and does not necessarily reflect real subsurface diversity.60 On the other hand, individual wells occasionally contain an extraordinary high number of specimens. As shown in our study, more than 182 stygobite copepods were found in well 997641 at the Rur block and up to 250 non-stygobite copepods in well 842211 at the Erft block (Table 1), underlining the patchy distribution of groundwater fauna and the heterogeneity of aquifers. Exactly this inhomogeneous distribution patterns somehow limits the use of groundwater invertebrates as bioindicators. However, the more data are available the clearer the picture becomes. There is strong evidence, for example, that the irregular distribution of fauna is mainly governed by the availability of organic matter.62–64 Consequently, influence from land use and from surface waters is a driving factor for shaping fauna in shallow aquifers. Habitats, hydrologically influenced by surface water are characterised by divers and heterogeneous communities, often dominated by stygophiles and stygoxenes.60 The invertebrate communities found in the aquifers of the Rur and Erft block could be distinguished into two main groups of which one was characterised by a high proportion of stygobites (obligate groundwater fauna) and the other one by a high proportion of non-stygobiontic species. The stygobiontic group could further be distinguished into two sub-groups, one dominated by the copepod Diacyclops languidoides and the other by three species of amphipods, forming two relative homogenous clusters in a multi-dimensional scaling (MDS) analysis (Fig. 4A). The data indicate that the samples dominated by non-stygobites are affected by a pronounced land surface impact. It is also known, that the space available for living strongly shapes aquifer communities. With respect to the two subgroups of stygobite-dominated samples, it is to be supposed that the key species, copepods in subgroup 1 and amphipods in subgroup 2, reflect different grain and pore sizes of the aquifers embedding the wells. However, besides these local differences, the two hydrogeological subunits (Erft and Rur block) could not be distinguished based on the faunistic data set.4.3 Groundwater bacterial communities
Assuming that the fundamental assumption that ‘everything is everywhere: but the environment selects’65 holds true for shallow porous aquifers, which are well connected to the surface and other ecosystems, then we may expect to find some common features in groundwater bacterial communities of an aquifer exhibiting common hydrogeochemical conditions. This indeed would be very useful with respect to the assessment of ecosystem status. Shifts in the microbial community could then be related to deviations from a reference status. However, so far the information on bacterial communities in ‘pristine’ and moderately contaminated shallow aquifers is scarce and does not allow to draw this conclusion.The data obtained in our study are convincing. Statistically, the bacterial communities of the two blocks could not be differentiated, nor pronounced differences were found for the spring and autumn samples. This means the composition of aquifer bacterial communities in the sampling areas is to a significant extent governed by the prevailing hydrogeochemical situation. The geologically similar aquifers of the Rur and Erft block thus harbour bacterial communities which contained numerous identical bacterial groups and species (T-RFs) (Tab. 2; Fig. 6). For both blocks a weak, but significant difference was observed between the bacterial communities from the locally distributed (lumped) and regionally distributed (dispersed) wells. Communities of the lumped wells were more similar to each other (Fig. 5). Certainly, a next step must be to identify the dominating T-RFs by cloning and sequencing, to obtain an idea on the phylogenetic composition of typical bacterial communities for these aquifer systems. Moreover, T-RFs related to individual stressors, such as phosphate (Fig. 7), need to be identified and approved to possibly reveal first indicator bacterial species.
Besides the information on bacterial community composition, other integrating microbial parameters such as the bacterial abundance, biomass, activity and biodiversity may serve as ecological criteria.31 The bacterial abundances (BA) found in groundwater samples from the two blocks matched the range typical for ‘pristine’ and moderately impacted groundwaters,12,28,29i.e. a mean cell number of 2.5× 10⁴ mL−1 in the Erft block aquifer and 5 × 10⁴ cells mL−1 in the Rur block aquifer. However, groundwater from individual wells at the Rur block displayed BA values increased by a factor of 3 to 10. Steube et al.31 related elevated BA values in groundwater samples from the Rur block to high DOC concentrations. However, DOC values given in Steube et al.31 have to be interpreted with caution. There is indication that these are overestimated by a factor of 3–5. No direct correlation could be found between BA and TOC in this study. If the frequently low DO concentrations may stand for a stronger impact at the Rur block when compared with the Erft block, this is reflected by BA values which are on average two times higher in Rur block groundwater. Also the bacterial diversity was found to be a sensitive parameter for the impact from land use. Groundwater of both blocks exhibited a considerably high bacterial biodiversity in comparison to data from other oligotrophic shallow aquifers.28,29 A temperate impact from organic carbon and nutrients is known to increase microbial biodiversity, while a strong impact generally reverses this trend.12 According to this ‘intermediate disturbance hypothesis’ bacterial diversity data underline a moderate impact on aquifers from land use. Concerning all microbiological analyses one must keep in mind that only bacterial communities suspended in pore water could be considered in this study. The major part of bacterial biomass in porous aquifers, however, is attached to the sediment particles.66,67
4.4 Relations between groundwater organisms and environmental conditions?
One of the results of this study is a positive correlation found for the non-stygobiontic organisms with both detritus (particulate organic matter) and the BA. The stronger the impact from the surface, the better the food base and the higher the proportions of non-stygobites.10,16,17,64,68 Also elevated numbers of bacteria may directly originate from infiltrating water69 or are a result of increased organic carbon and nutrients availability.12 Furthermore, non-stygobiontic organisms were found to be positively correlated with nitrate. But elevated nitrate concentrations must be seen as an indicator for an increased impact from agricultural land use, leading to a higher proportion of non-stygobites. Dumas et al.,15 investigating the impacts of agricultural pollutants in aquifers have found that microcrustaceans constitute natural indicators of aquifer hydrodynamics. Consequently, a dominance of stygobites indicated low hydrological connectivity to the surface.70With respect to bacteria, an effect of nitrate is generally linked to the simultaneous presence of organic carbon. Under well oxygenated conditions and in the absence of sufficient amounts of organic material nitrate hardly influences bacterial activity and biomass. Thus the correlations of nitrate with organismic variables must be seen as an indirect correlation with groundwater/surface water interactions and the impact from land surface activities (e.g. agriculture). Positive correlations between bacterial abundance (BA) and biomass with nitrate were found in an unconsolidated sandy area of the Donana aquifer system (SW Spain).71
Not surprisingly, CCA analysis of T-RFLP data and fauna revealed the correlation of several bacterial species/groups with individual invertebrates (data not shown). Whether the correlations found for taxa such as Diacyclops languidoides or oligochaets with some bacterial species (T-RFs) are meaningful, has to be elucidated in further, more detailed studies.
4.5 Perspectives for the use of groundwater ecological indicators
The lack of multitude simple correlations between abiotic and biotic variables underline that ecosystem processes and services cannot sufficiently be evaluated on a hydrological and geochemical basis. Thus, the assessment of water quality and ecosystem health needs ecological criteria. The primary role of such criteria is to provide information on the response of the ecosystem to anthropogenic disturbances. Ecological criteria are not necessarily useful to identify specific anthropogenic stress(es) causing the impairment.72 Based on the data currently available, no single indicator fulfils the expected purposes of (i) detection of an impact, (ii) determination of its effect on the system, and (iii) identification of its origin. Thus, a set of indicators is required for the development of an assessment scheme for groundwater ecosystems. In case of ecosystem impairment, more refined investigations are needed to link specific causes with the biotic responses observed.73Our study could show that from the set of biological and ecological variables tested, some proved to have a clear indicative value with respect to anthropogenic impacts mainly from land use. Community composition of fauna in groundwater successfully reflected the impact from agricultural activities, indirectly displayed by the elevated nitrate concentrations (Fig. 4). In a similar way, bacterial diversity mirrored the impact from land surface.
Although the data presented underline the great potential of groundwater fauna and bacteria to serve as ecological indicators, to date still several restrictions exist. First to mention is the difficult accessibility of groundwater ecosystems, the patchy distribution of its fauna, the high number of endemic species therein and the limited data on fauna and microbiology in general. And, there are a number of further obstacles including: shortage of taxonomists, lack of knowledge of reference conditions, lack of data from replicated surveys, incomplete coverage of habitat types, lack of standardised protocols for sample collection and processing, and a need for a central database adhering to nationally-agreed standards.5
It will need additional strategies in the future. With respect to the fauna, we have to improve our data sets. This asks for a higher sampling frequency and the investigation of more wells.74,75 With regard to microbial communities, we have to get a better understanding on the functional role and redundancy of dominant species/groups. Today, molecular methods provide the research tools required to analyse shifts in microbial patterns in relation to changes in environmental conditions.12 Instead of total community composition, the analysis of functional units (physiological groups, functional guilds and genes) or individual marker organisms seems promising. Moreover, in further studies pathogenic microorganisms as well as viruses should be considered as complementing indicators for anthropogenic impacts to groundwater ecosystems.
The current national research project funded by the German Federal Environmental Agency provides a first ground for the development of a databank taking into account physicochemical, microbial and faunal properties of groundwater ecosystems. It allows having a closer look at non- or moderately contaminated areas which did not receive much attention in the past. An improved data basis of the composition of natural faunal and microbial communities and its driving forces, provide the prerequisite for the identification of ecological criteria.
In conclusion, although there is still a considerable lack of knowledge on the distribution and autecology of groundwater organisms which makes it difficult to identify ecological indicators and criteria ready to use, the scientific outcome of the past two decades provides the basis for the development of modern assessment schemes including ecological criteria originating from groundwater fauna and microbes.
Acknowledgements
The authors gratefully acknowledge project funding by the German Federal Environment Agency (UBA-project ‘Biologische Bewertung von Grundwasserökosystemen’). We further thank S. Richter for continuous discussion and support, N. Cremer, F. Wilhelms, U. Lack, E. Hömberg and M. Trimborn of the ‘Erftverband’ in Bergheim, Germany, for logistical help during sampling and provision of selected chemical analysis. A. Mösch and M. Stöckl from the Institute of Groundwater Ecology at the HMGU in Neuherberg, Germany, are acknowledged for sampling assistance and K. Euringer and T. Lueders are acknowledged for helpful ideas concerning data analysis. The Helmholtz Center Munich (HMGU) is acknowledged for support and providing ideal working conditions.References
- M. Tomlinson, A. J. Boulton, P. J. Hancock and P. G. Cook, Deliberate omission or unfortunate oversight: Should stygofaunal surveys be included in routine groundwater monitoring programs?, Hydrogeol. J., 2007, 15(7), 1317–1320 CrossRef.
- P. J. Hancock, A. J. Boulton and W. F. Humphreys, Aquifers and hyporheic zones: towards an ecological understanding of groundwater, Hydrogeol. J., 2005, 13(1), 98–111 CrossRef CAS.
- A. J. Boulton, G. D. Fenwick, P. J. Hancock and M. S. Harvey, Biodiversity, functional roles and ecosystem services of groundwater invertebrates, Invertebr. Syst., 2008, 22, 103–116 Search PubMed.
- D. Danielopol, C. Griebler, A. Gunatilaka, H. J. Hahn., J. Gibert, G. Mermillod-Blondin, G. Messana, J. Notenboom and B. Sket, in Groundwater Science and Policy, ed. P. Quevauviller, RSC Publishing, The Royal Society of Chemistry, London, 2008, pp. 671–689 Search PubMed.
- M. Tomlinson and A. J. Boulton, Subsurface groundwater dependent ecosystems: a review of their biodiversity, ecological processes and ecosystem services, Waterlines Occasional Paper No 8, National Water Commission, Canberra, 2009 Search PubMed.
- J. Cairns Jr., P. V. McCormick and B. R. Niederlehner, A proposed framework for developing indicators of ecosystem health, Hydrobiologia, 1993, 263, 1–44 CrossRef.
- P. Quevauviller, Groundwater monitoring in the context of EU legislation: reality and integration needs, J. Environ. Monit., 2005, 7, 89 RSC.
- D. L. Danielopol and C. Griebler, Changing paradigms in groundwater ecology – from the ‘living fossils’ tradition to the ‘new groundwater ecology’, Int. Rev. Hydrobiol., 2008, 93(4–5), 565–577 CrossRef.
- European Parliament and Council, EC-WFD, Directive 2000/60/EC, Official Journal of the European CommunitiesL327:1-71, Brussels, Belgium, 2000 Search PubMed.
- W. F. Humphreys, Aquifers: the ultimate groundwater-dependent ecosystems, Aust. J. Bot., 2006, 54, 115–132 CrossRef.
- N. Goldscheider, D. Hunkeler and P. Rossi, Review: Microbial biocoenoses in pristine aquifers and an assessment of investigative methods, Hydrogeol. J., 2006, 14, 926–941 CrossRef CAS.
- C. Griebler and T. Lueders, Towards a conceptual understanding of microbial biodiversity in groundwater ecosystems, Freshwater Biol., 2009, 54(4), 649–677 CrossRef.
- L. Deharveng, F. Stoch, J. Gibert, A. Bedos, D. Galassi, M. Zagmajster, A. Branncelj, A. Camacho, F. Fiers, P. Martin, N. Giani, G. Magniez and P. Marmonier, Groundwater biodiversity in Europe, Freshwater Biol., 2009, 54(4), 709–726 CrossRef.
- J. S. Herman, D. C. Culver and J. Salzmann, Groundwater ecosystems and the service of water purification, Stanford. Environ. Law. J., 2001, 20, 479–495 Search PubMed.
- P. Dumas, C. Bou and J. Gibert, Groundwater Macrocrustaceans as Natural Indicators of the Ariège Alluvial Aquifer, International Review of Hydrobiology, 2001 Search PubMed.
- H. J. Hahn, The GW-Fauna-Index: A first approach to a quantitative ecological assessment of groundwater habitats, Limnologica, 2006, 36, 119–137 Search PubMed.
- F. Malard, S. Plenet and J. Gibert, The use of invertebrates in ground water monitoring: A rising research field, Ground Water Monit. Rem., 1996, 16, 103–113 CrossRef CAS.
- S. I. Schmidt, H. J. Hahn, T. Hatton and W. F. Humphreys, Do faunal assemblages reflect the exchange intensity in groundwater zones?, Hydrobiologia, 2007, 583, 1–19 CrossRef CAS.
- S. E. Berkhoff, J. Bork and H. J. Hahn, Grundwasserfauna als Indikator für Oberflächenwasser-Grundwasser-Interaktionen im Bereich einer Uferfiltrationsanlage, Grundwasser, 2009, 14, 3–20 CrossRef.
- J. Bork, S. E. Berkhoff, S. Bork and H. J. Hahn, Using subsurface metazoan fauna to indicate groundwater – surface water interactions in the Nakdong River floodplain, South Korea, Hydrogeol. J., 2009, 17, 61–75 CAS.
- J. Notenboom, R. Serrano, I. Morell and F. Hernández, The phreatic aquifer of the ‘Plana de Castellón’ (Spain):relationships between animal assemblages and groundwater pollution, Hydrobiologia, 1995, 297, 241–249 CrossRef CAS.
- M. R. Scarsbrook and G. D. Fenwick, Preliminary assessment of crustacean distribution patterns in New Zealand groundwater aquifers, N.Z.J. Mar. Freshw. Res., 2003, 37, 405–413 Search PubMed.
- F. Mösslacher, Subsurface dwelling Crustaceans as indicators of hydrological conditions, oxygen concentrations, and sediment structure in an alluvial aquifer, Int. Rev. Hydrobiol., 1998, 83, 349–364 CrossRef.
- F. Mösslacher, Sensitivity of groundwater and surface water crustaceans to chemical pollutants and hypoxia: implications for pollution management, Arch. Hydrobiol., 2000, 149, 51–66 Search PubMed.
- F. Paran, F. Malard, J. Mathieu, M. Lafont, D. M. P. Galassi and P. Marmonier, Distribution of groundwater invertebrates along an environmental gradient in a shallow water-table aquifer, in World Subterranean Biodiversity, J. Gibert (Ed.), Villeurbanne, France, 2004, pp.100–106 Search PubMed.
- J. V. Ward and M. A. Palmer, Distribution patterns of interstitial freshwater meiofauna over a range of spatial scales, with emphasis on alluvial river-aquifer systems, Hydrobiologia, 1994, 287(1), 147–156 CrossRef.
- V. Canivet, P. Chambom and J. Gibert, Toxicity and bioaccumulation of arsenic and chromium in epigean and hypogean freshwater macroinvertebrates, Arch. Environ. Contam. Toxicol., 2001, 40, 345–354 CrossRef CAS.
- H. Brielmann, C. Griebler, S. I. Schmidt, R. Michel and T. Lueders, Effects of thermal energy discharge on shallow groundwater ecosystems, FEMS Microbiol. Ecol., 2009, 68, 273–286 CrossRef CAS.
- C. Griebler, C. Kellermann, H. Stein, H. Brielmann, S. I. Schmidt, D. Selesi, C. Steube, S. Berkhoff, A. Fuchs and H. J. Hahn, Ecological assessment of groundwater ecosystems – vision or illusion?Ecol. Engeneer., submitted Search PubMed.
- M. Pronk, N. Goldscheider and J. Zopfi, Microbial communities in karst groundwater and their potential use for biomonitoring, Hydrogeol. J., 2009, 17, 37–48.
- C. Steube, S. Richter and C. Griebler, First attemps towards an integrative concept for the ecological assessment of groundwater ecosystems, Hydrogeol. J., 2009, 17, 23–35.
- H. W. Pearl, J. Dyble, P. H. Moisander, R. T. Noble, M. F. Piehler, J. L. Pinckney, T. F. Steppe, L. Twomey and L. M. Valdes, Microbial indicators of aquatic ecosystem change: current applications to eutrophication studies, FEMS Microbiol. Ecol., 2003, 46, 233–246 CrossRef CAS.
- M. Solé, I. Fetzer, R. Wennrich, K. R. Sridhar, H. Harms and G. Krauss, Aquatic hyphomycete communities as potential bioindicators for assessing anthropogenic stress, Sci. Total Environ., 2008, 389, 557–565 CrossRef CAS.
- G. Lear, I. K. G. Boothroyd, S. J. Turner, K. Roberts and G. D. Lewis, A comparison of bacteria and benthic invertebrates as indicators of ecological health in streams, Freshwater Biol., 2009, 54(7), 1532–1543 CrossRef CAS.
- R. Kunkel, F. Wendland, H. J. Voigt and S. Hannappel, Die natürliche, ubiquitär überprägte Grundwasserbeschaffenheit in Deutschland (The natural, ubiquitary determined composition of groundwaters), Schriften des Forschungszentrums Jülich, Reihe Umwelt/Environment, 2004, Vol. 47 Search PubMed.
- J. Illies. Limnofauna Europaea.Stuttgart. 1978 Search PubMed.
- W. Schlimm, in Geologie am Niederrhein, ed. H. D. Hilden, Geologisches Landesamt Nordrhein-Westfalen, Krefeld, 1988, pp. 78–86 Search PubMed.
- H. J. Hahn and D. Matzke, A comparison of stygofauna communities inside and outside groundwater bores, Limnologica, 2005, 35, 31–44 Search PubMed.
- P. Dumas and G. Fontanini, Sampling fauna in aquifers; a comparison of net-sampling and pump-sampling, Arch. Hydrobiol., 2001, 150(4), 661–676 Search PubMed.
- DIN (German industry norm) 38402-A 13, 13.060.10, 1985 Search PubMed.
- J. Murphy and J. P. Riley, A modified single solution method for the determination of phosphate in natural waters, Anal. Chim. Acta, 1962, 27, 31–36 CrossRef CAS.
- S. Epstein and T. Mayeda, Variation of O18 content of waters from natural sources, Geochim. Cosmochim. Acta, 1953, 4, 213–224 CrossRef CAS.
- M. C. Coleman, T. J. Shepherd, J. J. Durham, J. D. Rouse and G. R. Moore, Reduction of water with zinc for hydrogen isotope analysis, Anal. Chem., 1982, 54, 993–995 CAS.
- T. B. Coplen, Normalization of oxygen and hydrogen isotope data, Chem. Geol., 1988, 72, 293–297 CAS.
- C. Griebler, B. Mindl and D. Slezak, Combining DAPI and SYBR Green II for the enumeration of total bacterial numbers in aquatic sediments, Int. Rev. Hydrobiol., 2001, 86, 453–465 CrossRef.
- C. Winderl, B. Anneser, C. Griebler, R. U. Meckenstock and T. Lueders, Depth-Resolved Quantification of Anaerobic Toluene Degraders and Aquifer Microbial Community Patterns in Distinct Redox Zones of a Tar Oil Contaminant Plume, Appl. Environ. Microbiol., 2008, 74, 792–801 CrossRef CAS.
- S. W. Culman, R. Bukowski, H. G. Gauch, H. Cadillo-Quiros and D. H. Buckley, TITEL, BMC Bioinformatics, 2009, 10, 171 CrossRef.
- Z. Abdo, U. M. E. Schüette, S. J. Bent, C. J. Williams, L. J. Forney and P. Joyce, Statistical methods for characterizing diversity of microbial communities by analysis of terminal restriction fragment length polymorphisms of 16S rRNA genes, Environ. Microbiol., 2006, 8(5), 929–938 CrossRef.
- C. J. Smith, B. S. Danilowicz, A. K. Clear, F. J. Costello, B. Wilson and W. G. Meijer, T-Align, a web-based tool for comparison of multiple terminal restriction fragment length polymorphism profiles, FEMS Microbiol. Ecol., 2005, 54(3), 375–380 CrossRef CAS.
- T. C. J. Hill, K. A. Walsh, J. A. Harris and B. F. Moffett, Using ecological diversity measures with bacterial communities, FEMS Microbiol. Ecol., 2003, 43, 1–11 CrossRef CAS.
- H. G. Gauch Jr., Statistical analysis of regional yield trials: AMMI Analysis of factorial designs, Elsevier, Amsterdam, 1992 Search PubMed.
- K. R. Clarke and R. M. Warwick, Similarity-based testing for community pattern: the 2-way layout with no replication, Mar. Biol., 1994, 118, 167–176 CrossRef.
- N. Mantel and R. S. Valand, A technique of nonparametric multivariate analysis, Biometrics, 1970, 26, 547–55 CrossRef CAS.
- M. J. Anderson, A new method for non-parametric multivariate analysis of variance, Austral. Ecology, 2001, 26, 32–46 Search PubMed.
- K. R. Clarke and R. H. Green, Statistical design and analysis for a ‘biological effects’ study. Biological effects of pollutants. Results of a practical workshop, Mar. Ecol.: Prog. Ser., 1988, 46(1–3), 213–226 CrossRef.
- P. Legendre and L. Legendre, Numerical Ecology, Elsevier Science BV, Amsterdam, the Netherlands, 1998 Search PubMed.
- W. N. Venables and B. D. Ripley, Modern applied statistics with S, Springer, Heidelberg-New York, 2002 Search PubMed.
- J. Oksanen, Multivariate analysis of ecological communities, in R: vegan tutorial, available at http://cc.oulu.fi/%7Ejarioksa/opetus/metodi/vegantutor.pdf, 2008 Search PubMed.
- D. M. P. Galassi, F. Stoch, B. Fiasca, T. Di Lorenzo and E. Gattone, Groundwater biodiversity patterns in the Lessinian Massif of northern Italy, Freshwater Biol., 2009, 54(4), 830–847 CrossRef CAS.
- H. J. Hahn and A. Fuchs, Distribution patterns of groundwater communities across aquifer types in south-western Germany, Freshwater Biol., 2009, 54(4), 848–860 CrossRef.
- P. Martin, C. De Broyer, F. Fiers, G. Michel, R. Sablon and K. Wouters, Biodiversity of Belgian groundwater fauna in relation to environmental conditions, Freshwater Biol., 2009, 54(4), 814–829 CrossRef.
- D. L. Strayer, S. E. May, P. Nielsen, W. Wollheim and S. Hausam, Oxygen, organic matter, and sediment granulometry as controls on hyporheic animal communities, Arch. Hydrobiol., 1997, 140, 131–144 Search PubMed.
- J. Gibert and L. Deharveng, Subterranean ecosystems: A truncated functional biodiversity, BioScience, 2002, 52, 473–481 CrossRef.
- T. Datry, F. Malard and J. Gibert, Response of invertebrate assemblages to increased groundwater recharge rates in a phreatic aquifer, J. NA. Benth. Soc., 2005, 24, 461–477 Search PubMed.
- L. G. M. Baas-Becking, Geobiologie of inleiding tot de milieukunde, W. P. van Stockumand Zoon N. V., 1934 Search PubMed.
- A. Alfreider, M. Krössbacher, R. Psenner and et al, Groundwater samples do not reflect bacterial densities and activity in subsurface systems, Water Res., 1997, 31, 832–840 CrossRef CAS 86(6), 619–633.
- C. Griebler, B. Mindl, D. Slezak and M. Geiger-Kaiser, Distribution patterns of attached and suspended bacteria in pristine and contaminated shallow aquifers studied with an in situ sediment ecposure microcosm, Aquat. Microb. Ecol., 2002, 28, 117–129 Search PubMed.
- L. Mauclaire, J. Gibert and C. Claret, Do bacteria and nutrients control faunal assemblages in alluvial aquifers?, Arch. Hydrobiol., 2000, 148, 85–98 Search PubMed.
- J. C. Cho and S. J. Kim, Increase in bacterial community diversity in subsurface aquifers receiving livestock wastewater input, Appl. Environ. Microbiol., 2000, 66, 956–965 CrossRef CAS.
- C. Claret, P. Marmonier, M. J. Dole-Olivier, M. Cruezé des Châtelliers, A. J. Boulton and E. Castella, A functional classification of interstitial invertebrates: supplementing measures of biodiversity using species traits and habitat affinities, Arch. Hydrobiol., 1999, 145, 385–403 Search PubMed.
- S. Velasco Ayuso, M. C. Guerrero, C. Montes and A. I. López-Archilla, Spatiotemporal distribution of microbial communities in a coastal, sandy aquifer system (Donana, SW Spain), Geobiology, 2009, 7, 66–81 CrossRef CAS.
- G. J. Niemi and M. E. McDonald, Application of ecological indicators, Annu. Rev. Ecol. Syst., 2004, 35, 89–111 Search PubMed.
- G. J. Niemi, V. J. Brady, T. N. Brown, J. J. H. Ciborowski, N. P. Danz, D. M. Ghioca, J. M. Hanowski, T. P. Hollenhorst, R. W. Howe, L. B. Johnson, C. A. Johnston and E. D. Reavie, Development of ecological indicators for the U.S. Great Lakes coastal region – A summary of applications in Lake Huron, Aquat. Ecosyst. Health Manage., 2009, 12(1), 77–89 CrossRef.
- S. M. Eberhard, S. A. Halse, M. R. Williams, M. D. Scanlon, J. Cocking and H. J. Barron, Exploring the relationship between sampling efficiency and short-range endemism for groundwater fauna in the Pilbara region, Western Australia, Freshwater Biol., 2009, 54(4), 885–901 CrossRef CAS.
- P. J. Hancock and A. J. Boulton, Sampling groundwater fauna: efficiency of rapid assessment methods tested in bores in eastern Australia, Freshwater Biol., 2009, 54(4), 902–917 CrossRef.
Footnote |
| † Part of a themed issue dealing with water and water related issues. |
| This journal is © The Royal Society of Chemistry 2010 |