A comparison of total maximum daily load (TMDL) calculations in urban streams using near real-time and periodic sampling data†
Michael B.
Henjum
a,
Raymond M.
Hozalski
a,
Christine R.
Wennen
b,
Paige J.
Novak
a and
William A.
Arnold
*a
aDepartment of Civil Engineering, University of Minnesota, 500 Pillsbury Dr. SE, Minneapolis, MN 55455, USA. E-mail: arnol032@umn.edu
bWater Resources Science Program, University of Minnesota, 1985 Buford Avenue, St. Paul, MN 55108, USA
First published on 12th November 2009
Abstract
A network of in situ sensors and nutrient analyzers was deployed to measure nitrate, specific conductance (surrogate for chloride), and turbidity (surrogate for total suspended solids (TSS)) for 28 days in two urban streams near Minneapolis, MN. The primary objectives of the study were: (1) to determine the accuracy associated with quantifying pollutant loading using periodic discrete (i.e., grab) samples in comparison to in situ near real-time monitoring and (2) to identify pollutant sources. Within a highly impervious drainage area (>35%) the majority of pollutant load (>90% for nitrate, chloride, and TSS) was observed to be discharged in a small percentage of time (<20%). Consequently, periodic sampling is prone to underestimate pollutant loads. Additionally, when compared to loads based on near real-time sampling, average errors of 19–200% were associated with sampling 1–2 times a month. There are also limitations of periodic sampling with respect to pollutant source determination. Resulting implications with regard to total maximum daily load (TMDL) assessments are discussed.
Environmental impactDetermining the pollutant loads and sources in streams is critical so that steps can be taken to improve water quality and ecosystem health. This work demonstrates how the high temporal resolution data collected via near real-time sampling using a sensor network reduce the errors associated with pollutant loading determination in urban streams compared to infrequent (monthly or bi-weekly) grab sampling. Differences in measurements between two locations also provide insight into the sources and sinks of pollutants. Such information will be useful in determining total maximum daily loads of pollutants and potentially in allocation of pollutant discharge permits. |
Introduction
In accordance with the Clean Water Act, the United States Environmental Protection Agency has implemented pollutant loading restrictions for surface water bodies through the development of the total maximum daily load (TMDL) program. A TMDL describes the total mass of a pollutant that a specific water body can receive without exceeding water quality standards.1 TMDLs are assessed on a pollutant-by-pollutant basis.1,2 The primary objective of the TMDL program is to prevent deleterious ecological effects within surface waters.Important aspects of the TMDL program involve an initial assessment of the impairment, the identification of pollutant sources, the application of mitigation efforts, and monitoring of the water body until the relevant water quality standards have been achieved.3,4 Choosing an appropriate monitoring methodology to accurately assess pollutant loads and sources to a water body is both challenging5–7 and critical to the success of the program. A variety of monitoring options are available, including discrete (i.e. grab) sampling, automatic sampling, and in situ near real-time analysis.6,8,9
Water quality assessment is generally accomplished via discrete grab sampling on a bi-weekly to monthly basis,4 and the results are traditionally extrapolated to time-weighted fluxes using mean daily load calculations.7 A single sample, however, only represents a “snapshot” of the water quality at that specific moment in time. Timing and frequency of grab sampling are thus critical to minimize the likelihood of severely overestimating or underestimating pollutant loads.
Water quality is often characterized by significant diurnal, seasonal, and event-driven variations.5,10 In urban streams, diurnal variations can be even more significant than seasonal fluctuations.11 Parameters controlling these variations and the resulting complex water quality patterns include air temperature, solar radiation, photosynthesis, re-aeration, respiration, photochemical processes and stream flow variation.5 A single daily grab sample could therefore introduce bias into an analysis of water quality. Such biases either need to be accounted for or, better yet, need to be avoided by monitoring water quality throughout diurnal cycles.
In general, the applicability of using infrequent water quality measurements to estimate monthly or annual pollutant loads is problematic, particularly within small urban streams.7 The majority of pollutant loading occurs during episodic events, such as storms.10,12–14 The timing of peaks for specific pollutant concentrations at a given location could range from a few minutes to over 24 h after the onset of the storm,15 depending on hydrological conditions and the pollutant source. It is thus nearly impossible to capture such peaks using manual grab sampling.
Within high priority watersheds, manual grab sampling can be supplemented with automatic samplers during events that are expected to result in significant runoff, such as large storms.4 Automatic samplers also allow for sampling at flow-weighted intervals or at set time increments. Monitoring water quality over an entire diurnal cycle or throughout the duration of a storm event subsequently becomes feasible. The resulting data lead to an enhanced understanding of water quality dynamics at a specific location in a watershed. Automatic samplers also allow for composite sampling. Although the diurnal or event-driven fluctuations cannot be determined from composite samples, average loading rates could be determined at a decreased analytical cost compared to multiple discrete samples.
Use of in situ near real-time monitoring technologies goes a step further, enabling integrative measurements of previously unobservable diurnal and event-driven phenomena.5 This high temporal resolution monitoring of water quality parameters can improve pollutant loading estimates and reduce vulnerability to missing important data and event-driven relationships.9 Currently, technology is available for in situ monitoring of basic water quality parameters (e.g., specific conductance, temperature, dissolved oxygen, turbidity, pH and water depth via commercially available sondes) as well as nitrate and phosphate (with in situ nutrient analyzers) on a near real-time basis.
In this work, in situ water quality sensors and nutrient analyzers were deployed in two urban streams (Shingle Creek and Minnehaha Creek) near Minneapolis, MN. A variety of TMDLs currently have been developed for Shingle Creek and Minnehaha Creek, including TMDLs for chloride, nitrate, fecal coliform bacteria, and total suspended solids (TSS).16 The objectives were two-fold. First, pollutant loading obtained from near real-time measurements was compared with estimates derived from less frequent samples. The errors associated with discrete sampling methodologies were determined and the resulting implications for how TMDLs are calculated are discussed. Second, the feasibility of locating pollution sources via periodic grab sampling versusvia near real-time monitoring is evaluated in the context of inputs from stormwater treatment ponds.
Materials and methods
Site descriptions
A pollutant of concern within the region is chloride, resulting from salt application for road deicing. The creek was placed on the federal Clean Water Act 303(d) list of impaired waters in 1998 for exceeding the chloride water quality standard, leading to the establishment of a chloride TMDL in 2006.19 Shingle Creek is designated as a Class 2 water for the protection of aquatic life by the state of Minnesota R. Ch. 7050; thus, the chronic standard for chloride is 230 mg L−1 based on a 4 day average and an acute standard is 860 mg L−1 for a 1 h duration.19 As of 2008, TMDL studies for Shingle Creek were also in progress to address water quality impairments of aquatic macro-invertebrates and dissolved oxygen.16
At several locations within the creek, stage height and specific conductance have been monitored continuously for the past decade. Supplementary grab samples are also collected during base-flow and stormwater runoff conditions. Chloride is not measured directly, but chloride concentrations are calculated from the specific conductance measurements using eqn (1).18
| Cl− mg L−1 = 0.14 × specific conductance µS cm−1; R2 = 0.85 | (1) |
Water quality monitoring within Minnehaha Creek is performed routinely. The monitoring strategy in Minnehaha Creek is analogous to that in Shingle Creek. Several locations within the creek are monitored continuously for stage height and specific conductance. Grab samples are collected on a bi-weekly basis and are analyzed for a variety of parameters, including total suspended solids (TSS), chloride, nutrients, and fecal coliforms.20 A relationship between chloride and specific conductance was also developed for Minnehaha Creek (eqn (2)).
| Cl− mg L−1 = 0.22 × specific conductance µS cm−1; R2 = 0.82 | (2) |
Minnehaha Creek is also on the federal Clean Water Act 303(d) list of impaired waters for violating the Minnesota chloride water quality standard for a Class 2 water body.19 Additional impairments within the creek include fecal coliforms and fish biota. Multiple lakes along the creek are also impaired because of excess nutrient concentrations.16
Wireless sensor network description
A detailed summary of the sensor network is described in ref. 17. In brief, a two-node wireless water quality monitoring network was deployed in Shingle Creek (mile 3) in Brooklyn Park, MN from August 19th, 2008 to September 16th, 2008 and in Minnehaha Creek (mile 21) in Minnetonka, MN from September 28th, 2008 to October 26th, 2008. Each station measured dissolved oxygen, specific conductance, turbidity, depth, pH, and temperature every minute as well as nitrate every 2 h. Additionally, one of the stations was equipped with a rain gauge. Communication between the stations was enabled via radio antennas and a cellular modem enabled communication with, and control over, the network from a remote location as well as for the automatic downloading of data every 24 h to a server at the University of Minnesota.Monitoring strategy
Two monitoring stations were deployed approximately 200 m apart, one upstream and one downstream from a stormwater input, to determine pollutant loading rates within each creek at a high temporal resolution, as well as to determine the relative contribution of the stormwater retention ponds to the overall pollutant load within each creek during a variety of flow conditions. Pollutants of interest in this study included nitrate (measured every 30–120 min), specific conductance (measured every minute), and turbidity (measured every minute). Eqn (1) and (2) were used to estimate chloride concentration and load in the creeks from specific conductance measurements. These equations were developed for sites within close proximity to our monitoring sites.18,20 These data show no increase in bias with increasing concentration, but the average error of using the regressions to determine chloride concentration is 35%. A correlation was also used that related turbidity to TSS (eqn (3)).21,22| TSS mg L−1 = k × turbidity (NTU) | (3) |
Reported values for the coefficient k in eqn (3) range from 0.3 to 1.4, depending on the geology and land use of the watershed as well as the creek characteristics.21,22 No studies have been performed to determine a k value for Shingle or Minnehaha Creek. It was assumed that k was equal to 1.0. The significance of this assumption is minimal, as the primary objective of our work was to compare errors associated with periodic sampling relative to near real-time analysis. Any errors resulting from using the relationships in eqn (1)–(3) will be applied equally to all the data and will not affect the analysis and conclusions.
Shingle Creek flow data were extracted from a USGS monitoring station located at Queens Avenue in Minneapolis, MN. This location is approximately 500 m downstream from our study location and no significant surface water or point source inputs contribute to creek flow between the two locations. Minnehaha Creek flow data were calculated based on our continuous depth measurements and a rating curve previously developed at the same location in 2007.
Pollutant loads for the two 28-day monitoring periods were calculated using three methods: (1) integration of concentration versus time plots from near real-time measurements, (2) extrapolation of mean daily loads calculated from simulated daily, bi-weekly, and monthly grab samples, and (3) extrapolation of simulated daily, bi-weekly, and monthly grab samples using the averaging approach. The grab samples are considered simulated because no grab samples were collected, rather the values were extracted from the near real-time dataset at times corresponding to 12:00 PM (noon), as that time occurs during the normal workday.
In the mean daily load method, the pollutant loading rate is calculated by multiplying the measured concentration from a specific point in time by the average stream flow rate during the day the sample was collected (eqn (4)).
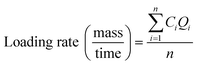 | (4) |
Alternatively, in the averaging approach the pollutant concentration from a specific point in time is multiplied by the average flow rate between sampling intervals (e.g., the average flow rate over the entire month if samples were collected on a monthly basis) rather than a daily average.
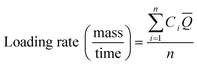 | (5) |
 | (6) |
![[Q with combining macron]](https://www.rsc.org/images/entities/i_char_0051_0304.gif) = the average flow rate for the entire period between sampling intervals, x = the number of days between sample collections, and t = the day the sample was collected (i.e., 1–28).
= the average flow rate for the entire period between sampling intervals, x = the number of days between sample collections, and t = the day the sample was collected (i.e., 1–28).
If samples were collected on a monthly basis the average flow rate over the entire month would be used. Alternatively, if two samples were collected, one on day t = 7 and the other on day t = 21, the resulting concentrations would be multiplied by the average flow rate between days 1–14 and 15–28, respectively. It should also be noted that flow data were available for 7 days before and after the 28 day monitoring periods at both Shingle Creek and Minnehaha Creek. Any flow data beyond the 42 day period (7 days before and after the 28 day sampling period) were not considered. Multiplication of the pollutant loading rate by the number of days between sample collection results in an estimate of the pollutant load over a specified sampling interval (i.e., time = 28 days in this study).
| Load (mass) = loading rate (mass time−1) × time | (7) |
Using both the mean daily load method and the averaging approach, the probabilities of estimating the 28-day load by extrapolation of simulated monthly and bi-weekly sampling frequencies for nitrate, chloride, and TSS within a 10 and 50% error relative to continuous analysis were calculated. In addition, the average percent errors between all possible permutations for monthly (28 permutations), bi-weekly (378 permutations), and daily (1 permutation) sampling were calculated. Monthly sampling statistics were derived by analyzing in situ measurements made at 12:00 PM for each of the 28 days monitored. Thus, for each pollutant (nitrate, chloride, and TSS), 28 data points were used for statistical analysis for each creek. Bi-weekly sampling statistics were derived from all possible permutations (378) by which 28 individual measurements could be paired. Thus, for each pollutant (nitrate, chloride, and TSS), 378 data points were included within the statistical analysis for each creek. Lastly, daily sampling statistics combined data that were measured at 12:00 PM for all of the 28 days. Because simulated samples were included from every day only one possible permutation resulted and therefore only average errors could be calculated. All analyses were performed manually using the Microsoft Excel spreadsheet package.
Results and discussion
Load estimation
Pollutant loading rates for Shingle Creek and Minnehaha Creek are shown in Fig. 1 and 2, respectively. During dry periods all three pollutants had relatively low and constant baseline loading rates (1–5 mg s−1, 1–5 g s−1, and 100–300 mg s−1, for nitrate, chloride, and TSS, respectively) in Shingle Creek. In Shingle Creek, the loading rate of each pollutant increased dramatically with rain. Indeed, over 50% of the total 28-day load for nitrate, chloride (calculated from conductivity), and TSS (calculated from turbidity) was discharged within four days of the 2.5 cm rainfall on August 28th (Table 1). This was not the case in Minnehaha Creek, where turbidity periodically increased with rain events and nitrate and conductivity remained relatively constant throughout the monitoring period (Fig. 2). For example, loading rates for nitrate and chloride within Minnehaha Creek ranged from 40 to 80 g s−1 and 100 to 175 g s−1 for approximately 50% of the observations, respectively. The difference between the two creeks is likely a result of the varying degrees of imperviousness in the two watersheds and differences in land use surrounding the monitoring sites (golf course runoff versus highway runoff).| (a) | Nitrate | Chloride | TSS | ||||||
|---|---|---|---|---|---|---|---|---|---|
| 4 Day load (8/28–9/1)/kg | 28 Day load (8/19–9/16)/kg | % of 28 day load | 4 Day load (8/28–9/1)/tonnes | 28 Day load (8/19–9/16)/tonnes | % of 28 day load | 4 Day load (8/28–9/1)/tonnes | 28 Day load (8/19–9/16)/tonnes | % of 28 day load | |
| Upstream | 56 | 86 | 66 | 12 | 25 | 47 | 12 | 23 | 52 |
| Downstream | 55 | 122 | 45 | 12 | 26 | 48 | 9 | 11 | 80 |
| (b) | Nitrate | Chloride | TSS |
|---|---|---|---|
| 28 Day load (9/28–10/26)/tonnes | 28 Day load (9/28–10/26)/tonnes | 28 Day Load (9/28–10/26)/tonnes | |
| Upstream | — | 340 | 12 |
| Downstream | 130 | 340 | 62 |
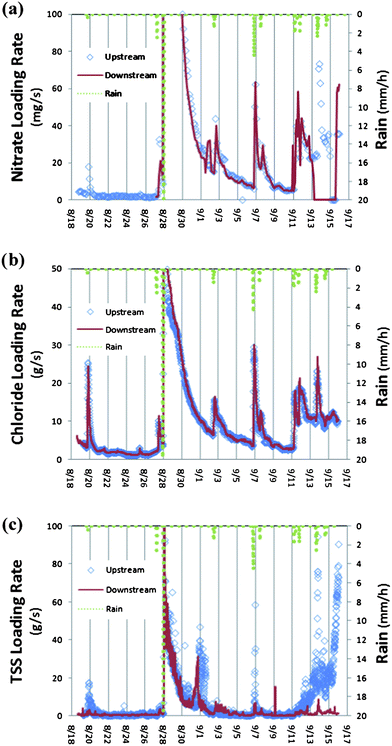 | ||
| Fig. 1 Loading results for (a) nitrate, (b) chloride (from specific conductance), and (c) TSS (from turbidity) over the 28 day period beginning on August 19th in Shingle Creek. The smooth line represents data from the downstream station and the diamonds represent data from the upstream station. Dotted vertical lines show the dates and amounts of rainfall. | ||
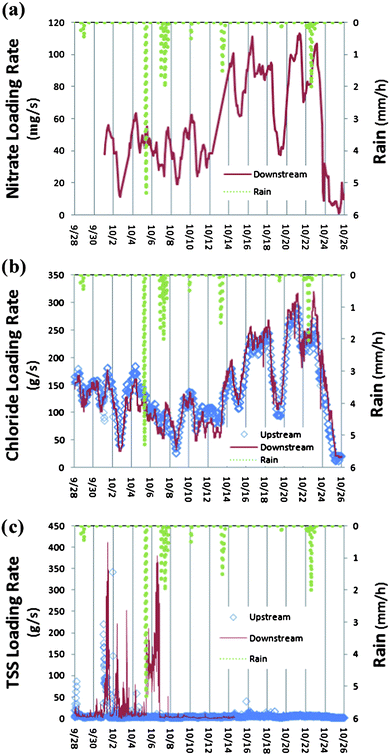 | ||
| Fig. 2 Loading results for the 28 day period that began on September 28th in Minnehaha Creek. Part (a) corresponds to nitrate, part (b) corresponds to chloride (surrogate of specific conductance), and part (c) corresponds to TSS (surrogate of turbidity). The smooth line represents data from the downstream station and the diamonds represent data from the upstream station. The upstream MicroLab did not function throughout the duration of this study, thus no upstream nitrate loads were determined. Additionally, technical difficulties with the downstream turbidity meter resulted in a loss of data after October 15th. Dotted vertical lines show the dates and amounts of rainfall. | ||
As illustrated in Fig. 3, the average (mean) loading rate for each pollutant in Shingle Creek corresponded to a value greater than the 66th percentile within the sampling period. Thus, the mean loading is significantly greater than the median loading (i.e., the data are not normally distributed). This result confirms that the monthly pollutant load is disproportionately influenced by a small percentage of time intervals (storm events), and it suggests that random sampling of the stream would on average result in an underestimation of the true pollutant loading rate. Underestimation of pollutant loading rates may lead to false conclusions regarding attainment of basic water quality standards or the success of pollution mitigation efforts. In Minnehaha Creek (Fig. 4a and b), both nitrate and chloride loading rates were normally distributed, and the mean value was similar to the median value for each dataset (i.e., <5% difference). Results for TSS, however, were similar to those observed in Shingle Creek, with storm-driven TSS loading to Minnehaha Creek. This led to a skewed distribution because of infrequent high loading events (Fig. 2 and 4c).
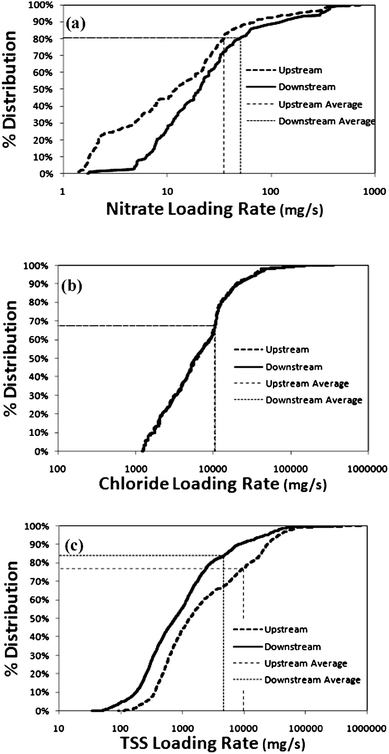 | ||
| Fig. 3 Cumulative distribution plots on a semi-log scale of the near real-time loading rates for (a) nitrate (n = 336), (b) chloride (from specific conductance, n = 40320), and (c) TSS (from turbidity, n = 40320) data from both the upstream and the downstream stations in Shingle Creek over a 28 day period beginning on August 19th. | ||
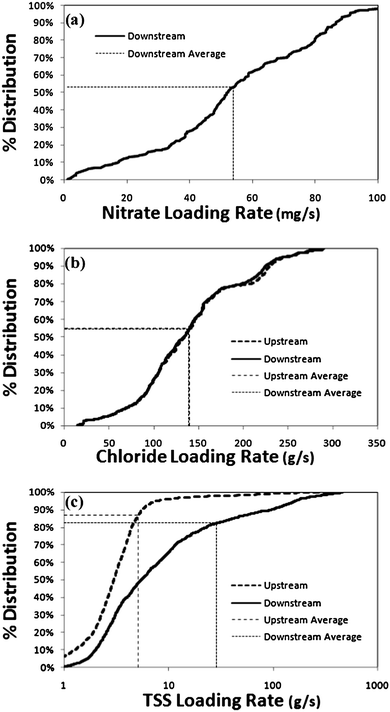 | ||
| Fig. 4 Percent distribution curves for (a) nitrate, (b) chloride (estimated via specific conductance), and (c) TSS (estimated through turbidity) results obtained during the 28 day monitoring period beginning on September 28th in Minnehaha Creek. The upstream MicroLab did not function throughout the duration of this study, thus no upstream nitrate loads were determined. The TSS distribution is displayed on a semi-log plot, and the nitrate and chloride results are on linear plots. | ||
The probabilities of estimating the true 28 day load (calculated from the near real-time measurements of nitrate, specific conductance, and turbidity) within 10 or 50% using the mean daily load method and either monthly or bi-weekly sampling frequencies were calculated for both creeks (Tables 2 and 3). In addition, the average percent errors for monthly, bi-weekly, and daily sampling were also determined for both creeks (Tables 2 and 3).
| Nitrate | Chloride | TSS | |||||
|---|---|---|---|---|---|---|---|
| Upstream | Downstream | Upstream | Downstream | Upstream | Downstream | ||
| Mean daily load method | |||||||
| Monthly sampling | <10% Error | 0.071 | 0.0 | 0.11 | 0.11 | 0.0 | 0.036 |
| <50% Error | 0.36 | 0.14 | 0.50 | 0.46 | 0.071 | 0.071 | |
| Average % error | 100% | 95% | 64% | 64% | 120% | 110% | |
| Bi-weekly sampling | <10% Error | 0.043 | 0.0026 | 0.050 | 0.11 | 0.11 | 0.0026 |
| <50% Error | 0.30 | 0.24 | 0.52 | 0.56 | 0.15 | 0.087 | |
| Average % error | 87% | 79% | 51% | 53% | 85% | 97% | |
| Daily sampling | Average % error | 2.9% | 18% | 10% | 9.1% | 13% | 20% |
| Averaging method | |||||||
| Monthly sampling | <10% Error | 0.27 | 0.06 | 0.036 | 0.036 | 0.071 | 0.14 |
| <50% Error | 0.88 | 0.94 | 0.29 | 0.29 | 0.32 | 0.50 | |
| Average % error | 24% | 31% | 72% | 61% | 95% | 53% | |
| Bi-weekly sampling | <10% Error | 0.29 | 0.013 | 0.034 | 0.042 | 0.045 | 0.088 |
| <50% Error | 0.93 | 1 | 0.26 | 0.37 | 0.55 | 0.67 | |
| Average % error | 19% | 31% | 67% | 54% | 76% | 43% | |
| Daily sampling | Average % error | 1.7% | 31% | 67% | 55% | 15% | 21% |
| Nitrate | Chloride | TSS | |||||
|---|---|---|---|---|---|---|---|
| Upstream | Downstream | Upstream | Downstream | Upstream | Downstream | ||
| Mean daily load method | |||||||
| Monthly sampling | <10% Error | — | 0.23 | 0.11 | 0.18 | 0.11 | 0.0 |
| <50% Error | — | 0.45 | 0.71 | 0.71 | 0.71 | 0.078 | |
| Average % error | — | 47% | 35% | 38% | 40% | 200% | |
| Bi-weekly Sampling | <10% Error | — | 0.13 | 0.20 | 0.21 | 0.14 | 0.0 |
| <50% Error | — | 0.85 | 0.90 | 0.88 | 0.85 | 0.033 | |
| Average % error | — | 34% | 25% | 27% | 31% | 170% | |
| Daily Sampling | Average % error | — | 7.3% | 5.0% | 5.0% | 25% | 77% |
| Averaging method | |||||||
| Monthly sampling | <10% Error | — | 0.80 | 0.64 | 0.57 | 0.036 | 0.0 |
| <50% Error | — | 1 | 1 | 1 | 0.79 | 0.13 | |
| Average % error | — | 7.1% | 9.1% | 10% | 38% | 260% | |
| Bi-weekly sampling | <10% Error | — | 0.83 | 0.80 | 0.78 | 0.20 | 0.0074 |
| <50% Error | — | 1 | 1 | 1 | 0.92 | 0.10 | |
| Average % error | — | 7.1% | 5.6% | 6.2% | 29% | 240% | |
| Daily sampling | Average % error | — | 2.0% | 0.43% | 0.28% | 28% | 160% |
When the pollutant loading was dominated by only a few events, as was the case in Shingle Creek for all of the pollutants and in Minnehaha Creek for the downstream TSS measurements, the average error in determining pollutant loading was high when using the mean daily load method (35–200% for a sampling frequency of once per month, and 25–170% for a sampling frequency of bi-weekly) (Tables 2 and 3). Using the mean daily load method for both monthly and bi-weekly sampling the probability of predicting the monthly load within 10% error ranges from 0 to 0.23 for all of these storm-driven pollutants, and the probability of predicting the monthly load within 50% error ranges from 0.033 to 0.90, respectively (Tables 2 and 3). Collection of daily samples improves load estimation substantially (Tables 2 and 3); nevertheless, collecting and analyzing daily samples are likely to be infeasible in most cases because of time and cost considerations. In addition, others have observed that the collection of daily samples resulted in errors as high as 64% relative to near real-time monitoring,7 indicating that in streams that are flashier than the two monitored in this study, near real-time monitoring is even more critical to accurately quantify pollutant loading rates.
An alternative method for calculating load, the averaging approach (eqn (5)), can improve load estimations if pollutant concentrations are relatively constant and are independent of stream discharge.23 In Shingle Creek, neither nitrate nor TSS correlated with stream discharge (R2 values of 0.026 and 0.0064, respectively), and similarly, nitrate and chloride did not correlate with discharge (R2 values of 0.0032 and 0.011, respectively) in Minnehaha Creek. Subsequently, improved load estimations were observed (Tables 2 and 3). Conversely, unwanted biases are introduced if pollutant concentrations correlate with flow,23 as was the case with chloride in Shingle Creek (R2 = 0.39) and with TSS in Minnehaha Creek (R2 = 0.23), increasing the errors associated with load estimation using the averaging approach (Tables 2 and 3).
Using eqn (1) or (2) to calculate chloride concentration from specific conductance results in an average error of 35%. This is less than the errors associated with discrete sampling for Shingle Creek (using either the mean daily load or averaging method) and comparable to that for Minnehaha Creek using the mean daily load method. Clearly, it would be desirable to eliminate the errors associated with the regressions relating chloride to specific conductance, which could be accomplished using an ion specific electrode. If regressions/relationships such as eqn (1)–(3) are used to estimate pollutant loads in practice, enough data must be taken at the specific locations under various conditions (flow, season, etc.) such that they are sufficiently robust to quantify errors arising from the regression in determining pollutant loads. Error is also potentially introduced in our analysis by using simulated, rather than actual, grab samples. Clearly, there is error introduced by using eqn (1)–(3) to estimate pollutant concentrations. Using simulated samples, however, allowed calculation of many more permutations for the monthly and bi-weekly sampling scenarios that would have been possible using grab samples.
Source determination
Another aspect of the TMDL program is to locate sources of pollution. Many potential sources do not consistently release pollutants, but rather release pollutants intermittently. An assessment performed through the collection of infrequent grab samples thus leaves a study vulnerable to missing the exact data it was meant to find. Near real-time monitoring enables observations of potential pollutant sources over all flow conditions, including storm events.During many high flow events, nitrate, chloride and TSS loading rates were similar for the upstream and downstream locations (i.e., <5% difference). For a few events, however, observed loading rates for the two stations were different. At the Minnehaha Creek site, occasional increases in TSS loading were observed at the downstream station only (e.g., Fig. 2c, from10/1–10/8). This suggests that the stormwater pond can be a source of TSS to Minnehaha Creek. Indeed, the total TSS load observed by the downstream station was approximately 50 tonnes greater than measurements at the upstream station over the 28-day period. The ponds, therefore, contributed to over 81% of the total TSS load at this particular juncture in the creek. Also, at the Shingle Creek site, an additional 34 tonnes of nitrate were discharged past the downstream station, suggesting the ponds contributed to approximately 28% of the total nitrate load in this stretch of the creek. Conversely, at the Shingle Creek site, a 12 tonnes reduction in TSS load was observed between the upstream and downstream station (e.g., Fig. 1c, on 8/20, 9/7, and 9/11–9/17), thus suggesting the stormwater input was a diluent of TSS by nearly 52%. Only continuous monitoring ensures a complete understanding of the relative magnitude of a pollutant source and the events that result in such a source (so-called “hot moments”). Because discrepancies between upstream and downstream stations were observed to occur only a small fraction of the time, the probability of collecting a grab sample while a discrepancy, or hot moment is occurring, is low. Advances in data mining tools to identify discrepancies or anomalies between sensors would allow such events to be automatically identified and could be used to locate point sources or sinks.24 Coupling such algorithms with automated data transfer from the water quality monitoring networks could enable automatic reporting when or if a pollutant source has been detected. Additionally analysis could also be attempted to relate pollutant input signature (i.e., loading rate probability distributions) to the local land use/hydrology.
Conclusion
Based on the results obtained from this study, it is possible to accurately (5.6–10% error) determine pollutant loads by collecting infrequent (monthly or bi-weekly) discrete samples if pollutant concentrations are normally distributed (e.g., nitrate and chloride within Minnehaha Creek), the pollutant concentration is not correlated with stream discharge (e.g., nitrate and chloride within Minnehaha Creek), and the averaging approach is used. Conversely, if pollutant concentrations are not normally distributed (e.g., nitrate, chloride, and TSS at Shingle Creek and TSS at Minnehaha Creek) and are correlated, even weakly, with stream flow (e.g., chloride and TSS at Shingle Creek and TSS in Minnehaha Creek), errors in load estimation based on monthly or bi-weekly sampling are large (51–200%). Additionally, depending on the acceptable error threshold and watershed hydrology, the recommended sampling frequency may be variable. Others have seen that within flashy, well-drained watersheds, a minimum sampling frequency of 2 to 3 h was required to ensure load estimate errors of less than 10%.7 In agreement with previous studies, our results also suggest that for well-drained areas like the Shingle Creek watershed, daily sampling may not be sufficient to estimate loads within 10%, and near real-time in situ monitoring is recommended. Lastly, because sources of pollutants can be discharged intermittently, near real-time monitoring is also required to consistently reach accurate conclusions on the relative contributions a pollutant source has on stream load.Acknowledgements
This work was supported by the National Science Foundation (EAR 0607138 and CBET 0414388) and by the National Institutes for Water Resources/US Geological Survey (2006MN187G). Thanks to Miki Hondzo for his input and assistance.References
- US EPA, Impaired Waters and Total Maximum Daily Loads, 2009, http://www.epa.gov/OWOW/tmdl/ Search PubMed.
- T. F. Sullivan, C. L. Bell, F. W. Brownell, R. E. Cardwell, D. R. Case and K. A. Ewing, Environmental Law Handbook, Government Institutes, Lanham, Maryland, 18th edn, 2005 Search PubMed.
- US EPA, Guidance for Water-Quality-based Decisions: The TMDL Process, EPA440-4-91-001 19,91 Search PubMed.
- Minnesota Pollution Control Agency, Minnesota's Water Quality Monitoring Strategy 2004 to 2014: A Report Prepared for the US Environmental Protection Agency, 2004, http://proteus.pca.state.mn.us/water/pubs/wqms-report.html Search PubMed.
- D. O. Hessen, A. Henriksen and A. M. Smelhus, Water Res., 1997, 31, 1813 CrossRef CAS.
- A. Hildebrandt, S. Lacorte and D. Barcelo, Anal. Bioanal. Chem., 2006, 386, 1075 CrossRef CAS.
- A. J. Horowitz, K. A. Elrick and J. J. Smith, Results from the City of Atlanta Water-Quantity and Water-Quality Monitoring Program: Suspended Sediment, Trace Element, and Nutrient Fluxes, 2004–2005, in 2007 Georgia Water Resources Conference, University of Georgia, Athens, Georgia, 2007, http://cms.ce.gatech.edu/gwri/uploads/proceedings/2007/6.2.3.pdf Search PubMed.
- D. A. Alvarez, J. D. Petty, J. N. Huckins, T. L. Jones-Lepp, D. T. Getting, J. P. Goddard and S. E. Manaha, Environ. Toxicol. Chem., 2004, 23, 1640 CrossRef CAS.
- S. L. MacLeod, E. L. McClure and C. S. Wong, Environ. Toxicol. Chem., 2007, 26, 2517 CrossRef CAS.
- P. L. Brezonik and T. H. Stadelmann, Water Res., 2002, 36, 1743 CrossRef CAS.
- A. W. Fogle, J. L. Taraba and J. A. Dinger, J. Am. Water Resour. Assoc., 2003, 39, 1361 Search PubMed.
- C. J. Diblasi, H. Li, A. P. Davis and U. Ghosh, Environ. Sci. Technol., 2009, 43, 494 CrossRef CAS.
- K. R. Flint and A. P. Davis, J. Environ. Eng., 2007, 133, 616 CrossRef CAS.
- J. Vaze and F. H. S. Chiew, Urban Water J., 2002, 4, 379 Search PubMed.
- J. H. Lee and K. W. Bang, Water Res., 2000, 34, 1773 CrossRef CAS.
- Minnesota Pollution Control Agency, Minnesota's Impaired Waters and TMDLs, 2008, http://www.pca.state.mn.us/water/tmdl/tmdl-303dlist.html Search PubMed.
- M. B. Henjum, R. M. Hozalksi, C. R. Wennen, W. A. Arnold and P. J. Novak, J. Environ. Monit., 2009 10.1039/b912544b.
- Shingle Creek Chloride TMDL Report, Wenck & Associates, Inc., Maple Plain, MN, 2006, http://www.shinglecreek.org/tmdlimplementation.pdf Search PubMed.
- Minnesota Pollution Control Agency Minnesota TMDL Projects and MPCA Contacts 2009, http://www.pca.state.mn.us/publications/wq-iw1-13.pdf Search PubMed.
- Y. Christianson, J. Carlson and U. B. Singh, Minnehaha Creek Watershed District 2006 Hydrologic Data Monitoring Report, 2007, http://www.minnehahacreek.org/documents/Hydrodata_Report_2006_full.pdf Search PubMed.
- US EPA, TMDLs for Chlorides, Sulfates, Total Dissolved Solids (TDS), Sediment, Total Suspended Solids (TSS) and Turbidity for Selected Subsegments in the Terrebonne Basin, Louisiana, 2005, http://www.epa.gov/region6/water/npdes/tmdl/2007/louisiana/final/3terretmdls_f.pdf Search PubMed.
- T. D. Fletcher and A. Deletic, Water Sci. Technol., 2007, 56, 1 Search PubMed.
- D. M. Dolan and A. H. El-Shaarawi, Environ. Monit. Assess., 1989, 13, 343 CrossRef CAS.
- J. M. Kang, S. Shekhar, M. B. Henjum, P. J. Novak and W. A. Arnold, Discovering Teleconnected Flow Anomalies: A Relationship Analysis of spatio-temporal Dynamic (RAD) neighborhoods, in Lecture Notes in Computer Science, Proceedings of the 11th International Symposium on Advances in Spatial and Temporal Databases, Springer-Verlag, Berlin, Germany, 2009, vol. 5644, p.44 Search PubMed.
Footnote |
| † Part of a themed issue dealing with water and water related issues. |
| This journal is © The Royal Society of Chemistry 2010 |