Hydrothermal gasification of biomass: consecutive reactions to long-living intermediates†
Andrea
Kruse
*,
Philipp
Bernolle
,
Nicolaus
Dahmen
,
Eckhard
Dinjus
and
Palanikumar
Maniam
Institute for Technical Chemistry, ITC-CPV, Forschungszentrum Karlsruhe, P.O.B. 3640, 76021, Karlsruhe, Germany. E-mail: andrea.kruse@itc-cpv.fzk.de; Fax: +49 7247 822244; Tel: +49 7247 823388
First published on 18th November 2009
Abstract
The reaction of intermediates formed during hydrothermal biomass gasification (HBG) with each other or with hydrogen produced by the water-gas shift reaction has a significant influence on the process. To understand these reactions, the conversion of different C4 compounds (1-butanol, 1-butanal, cis-butendiol) was investigated in a batch reactor. These compounds carry different functional groups also found in intermediates of HBG. All compounds react to make products with aromatic ring systems, which shows that the intermediates can react with each other and aromatic rings are formed independently of the functional groups. The HBG intermediates can also react with hydrogen formed via the water-gas shift reaction (CO + H2O ⇔ CO2 + H2). This is shown by the reaction of deuterated glucose in H2O. The reaction of hydrogen originating from water leads to the formation of C–H bonds not present in the feedstock.
Broader contextHydrothermal biomass gasification is an interesting technology to convert wet biomass, with a natural water content, to hydrogen by a thermochemical reaction. The temperature needed is lower than for dry thermochemical reactions and no drying is necessary. For the development of the technical process, some hurdles have to be overcome. One is the formation of phenols from carbohydrates. Phenols are less reactive than the biomass feedstock and either increase the necessary reaction time or are found in the effluent. This work has the goal of understanding how phenols are formed in order to find a way to depress the phenols’ formation. |
Introduction
Hydrothermal biomass gasification (HBG) is a promising process for the utilization of biomass residues with high water content.1–5 Biomass with a natural water content of 80% or more shows a high reactivity if it is heated up under pressure. The water in the biomass becomes the reaction medium and a reactant. This supports the fast degradation of the polymer structure of the biomass by hydrolysis.6Depending on the temperature, different products are formed, predominately by hydrothermal biomass conversion. In the temperature range of around 300–350 °C, a high-viscous “oil” is formed. This process is called “hydrothermal liquefaction”. In the presence of a hydrogenation catalyst at slightly increased temperatures, around the critical temperature (374 °C), biomass is completely gasified to the major products methane and carbon dioxide.4,5 The formation of hydrogen as the major product together with carbon dioxide needs higher temperatures of above 600 °C because of thermodynamic reasons. At lower temperatures, methane is the preferred thermodynamic product. In contrast to the methane formation, the gasification to hydrogen, usually called supercritical water gasification (SCWG), needs no added catalyst. Salts, usually in the biomass, act as catalyst/promoter for the water-gas shift reaction,7–9 producing up to half of the hydrogen.2,3
| Water-gas shift reaction: CO + H2O ⇔ CO2 + H2 | (1) |
To reach the reaction conditions of HBG, biomass has to be heated up, crossing the conditions of hydrothermal liquefaction. The same compounds found in hydrothermal liquefaction are detected as intermediates on the reaction path from biomass to gas. These are different alcohols, aldehydes and ketones, different organic acids, double bond compounds, phenols as well as furfurals.2,10
The formation of such intermediates is of high importance for the optimization of the hydrothermal gasification. Such compounds may split into gases, which is the desired reaction. In addition, they are able to polymerize, which reduces the gas yield.
The importance of intermediate formation and their consecutive reactions are proven by different observations: it is known that the heating rate has a significant influence on the gas yield. It is assumed that high-reactive intermediates react to low-reactive intermediates preferentially if the heating rate is low and the reaction time in the “liquefaction temperature range” is high. This decrease of reactivity leads to a decrease of the gas formation rate, usually resulting in a decrease of the gas yield.11,12 The intermediates, acetic acid and different phenols, are of special interest here. These are long-living intermediates, kinetically relatively inert and usually the last hurdle for complete gasification. Acetic acid and phenols are thermodynamically instable, therefore, the formation and degradation is mainly a kinetic challenge. Avoiding the formation of e.g. phenols would mean that there is no need to gasify these low reactivity compounds. A higher hydrogen yield and, more importantly, a shorter reaction time and/or cleaner effluent are expected in this case. It is known that the reaction order with respect to the biomass dry matter content for the phenol formation is ∼ two.13 This hints to the assumption that the phenols are formed by a dimerization/polymerization of smaller compounds. In general, the intermediates are able to polymerize, which may also lead to formation of char/coke.11 Char/coke should be avoided, because the reactivity is much lower than the reactivity of the feedstock biomass; in fact, it is usually not gasified at normal SCWG conditions.
On the other hand, it is observed that back-mixing has a positive effect on the gasification of feedstock with a higher dry mass content. It is assumed that in the case of back-mixing, active hydrogen formed via the water-gas shift reaction may react with early intermediates, forming other intermediates with a lower reactivity with regards to polymerization but not gasification.14,15
The early intermediates of HBG are relative well known and shown in Fig. 1.2 The consecutive reaction of intermediates and the reactions following those, shown in Fig. 1, have not been investigated in detail up to now. Usually, experiments are done to reach full conversion of biomass to gas. In some cases, experiments are conducted with very short reaction times, resulting in the products shown in Fig. 1.1–4
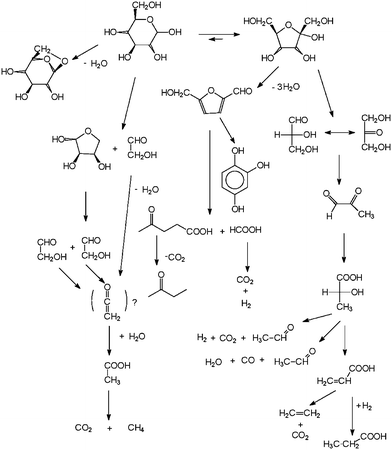 | ||
| Fig. 1 Known reaction pathways of hydrothermal biomass gasification with primary intermediates.2 | ||
In the first case, stable intermediates like acetic acids and phenols are found, but it is not clear via which reaction pathway these compounds are formed, because the precursors are not stable or inert enough to be detectable. These precursors are part of the main stream of the reaction and determine the chemical kinetics. Short reaction time experiments also show less inert intermediates, but only for the first reaction steps. In order to understand how e.g. phenols are formed, one has to identify the less inert precursor. Moreover, this means having to identify the type of reaction occurring.
In order to get more information on what follows the formation of primary intermediates, two series of experiments were done:
1. Different small compounds (1-butanol, 1-butanal, cis-butendiol), which carry functional groups identified in intermediates, are use to fill a batch reactor, and the products formed are identified. The goal was to learn something about the polymerization reactions, especially phenol formation. C4 compounds were chosen, because they are too small to form a ring by an intramolecular reaction. Different functional groups are chosen to understand via which reaction pathway consecutive products are formed.
2. Deuterated glucose and glucose were converted in water (H2O) in the same batch reactor. The products formed and, if possible, the positions of deuterium atoms were identified.
In both cases, potassium salts are present during reaction. They are used as substitutes for ash in real biomass and catalysts/promoters of the water-gas shift reaction.
The identification of reaction pathways and precursors for relatively inert intermediates is the first step. Studies of the kinetics, measured in continuous plants, will follow. Then, the precursor will be used as starting material and the kinetics of the e.g. phenol formation will be measured.
Experimental
The experiments were conducted in a 1 L tumbling batch reactor, with a liner made of Inconel 625 (for details see ref. 12). This reactor is heated up to 500 °C, at 50 MPa and equipped with two thermocouples and a pressure gauge. One thermocouple is used for the temperature control. First, the reactor is flushed with nitrogen and then the calculated amount of aqueous feedstock solution is added. The pressure reached is a consequence of the amount of water in the reactor and can be calculated by considering the density of water16 at the requested temperature and pressure. Then the reactor is closed. The heating rate and end temperature is given as input to the temperature controller. After the reaction, the gas volume formed is measured, the product mixture is pressed out of the reactor and the reactor is washed with water and methanol.The reactor developed a “coke patina” after some years of use. This allows us to avoid the catalytic effects of the metal surface.
In every experiment, the heating rate was 3 K min−1, up to 500 °C. The reaction time at 500 °C was 60 min. At these conditions, the pressure was around 30 MPa.
In series 1, 1-butanol, 1-butanal or cis-butendiol [5% (g g−1)] and K2CO3 [0.5% (g g−1)] are mixed with water and fed into the reactor.
In series 2, normal glucose [0.16% (g g−1)] or deuterated glucose [D-glucose-1,2,3,4,5,6,6-D7, 97 atom% D by Sigma-Aldrich, CAS: 23403-54-5; 0.16% (g g−1) in the feed], as well as KHCO3 [0.016% (g g−1)] in both cases are dissolved in water and used as feedstock.
A commercial TOC (total organic carbon) analyzer (Rosemount Dohrmann DC-190) is used to determine the total organic carbon content of the aqueous phase. For the analysis of the gas components (H2, CH4, C2H4, C2H6, C3H6, C3H8, i-C4H10, n-C4H10, CO and CO2), an Agilent 6890 GC with column switching and helium as the carrier gas is used. Here, the first column is 80/100 Hayesep Q (2 m long, by Resteck), and the second column is a 60/80 Molesieve 5 Å (4 m long, by Resteck). The two columns, as well as a thermal conductivity and a flame ionization detector, are connected in series. The second column is bypassed by a six-port valve for analysis of CO2 and hydrocarbons.
The phenol index was determined colorimetrically by UV–vis spectrometry (LCK 345/LCK 346, Cadas 200 photometer, Hach-Lange).
The concentrations of phenol, o-cresol and m-/p-cresol are analyzed by SPME-GC. These compounds were extracted by using 85 μm polyacrylate SPME (solid phase micro extraction) fibers for polar substances. Gas chromatograph (GC) analysis of desorption of phenols from the SPME fiber (at 250 °C) was performed on an Agilent 5890 GC, XTI-5 column (30 m length, 0.25 mm diameter, 25 μm thickness) by Resteck [temperatures: 40 °C (10 min)–(10 °C min−1)–>250 °C (10 min)] and a FID detector. Gas chromatograph-mass spectrometry (GC-MS) analysis was performed on an Agilent GCMS 6890N, DB 5 column (30 m length, 0.25 mm diameter, 25 μm thickness) [temperatures: 40 °C (2 min)–(10 °C min−1)–>300 °C (15 min)] and detector 5873N. The GC-MS analysis was conducted by two different methods:
For the SPE-GC-MS analyses, the aqueous phase is extracted by solid phase extraction (SPE, extrelut™ by Merck). The recovery of phenols by SPE is determined to be between 94–100%, depending on the kind of phenol. The extracted compounds are then dissolved in methanol and injected into the GC. For the Headspace-GC-MS, a sample of the gas above the aqueous solution is injected in the GC.
For the GC-MS analysis of the series 2 products, the following procedure was conducted (see also the ESI†):
- First, an experiment with normal glucose was carried out and the product mixture was analyzed by SPE-GC-MS (see above).
- The GC retention time of identified products were recorded.
- The typical MS peaks of the identified products and the mass differences between the peaks were determined. The mass peaks and differences can be assigned to molecular fragments created in the mass spectrometer.
- Secondly, the same experiment was done with deuterated glucose and analyzed by SPE-GC-MS.
- The deuterated products have the same GC retention time as the non-deuterated. Therefore, it is possible to decide which mass spectrum is produced by e.g. deuterated phenol.
- The MS peaks and mass differences between peaks found for the products of the non-deuterated glucose conversion are compared with the peaks and mass differences determined for the products of the deuterated glucose. By this point-to-point procedure, the amount of deuterium in the molecule and the fragments can be determined. The deuterium content of the fragments gives a hint of where in the molecule the deuterium is located. This, of course, can only be determined on average and with a high uncertainty.
In addition, the liquid and gaseous products are analyzed as described above, with methods that do not distinguish between deuterated and non-deuterated compounds. In the error range of around 10%, the results are the same as those found for this system before.
Results
In series 1, the amount of gas formed by the gasification of 1-butanol, 1-butanal and cis-butendiol are 4.0, 4.0 and 4.5 L, respectively. The gas composition is shown in Fig. 2. The amount of C4 compounds in the gas phase is low.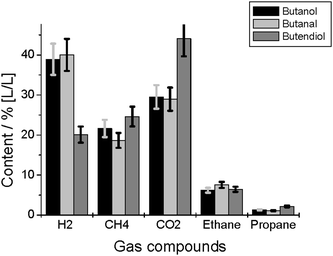 | ||
| Fig. 2 Gas composition after gasification of butanol, butanal, and butendiol. | ||
Butanol and butanal conversion show similar results. Butendiol leads to a higher product gas volume and the gas contains less hydrogen and more carbon dioxide, as in the case of the other C4 compounds.
The total organic carbon content, after the reaction of the C4 compounds, is similar in each of the feedstocks (Fig. 3). In the case of butanol, it is slightly higher than in the other two cases. The inorganic carbon content differs more: in the case of butendiol, the inorganic carbon content (CO22−, HCO2−, dissolved CO2) is lower than for butanol and butanal conversion.
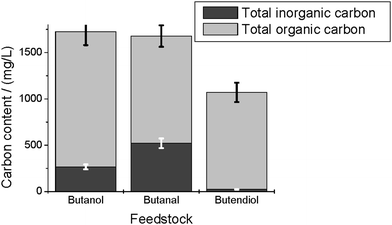 | ||
| Fig. 3 Total inorganic carbon content and total organic carbon content in the aqueous product phase after conversion of 1-butanol, 1-butanal and cis-butendiol. | ||
Fig. 4a shows the products identified after conversion of butanol by Headspace-GC-MS. Here, different alkyl-benzenes, and also indane, are found. The main component is toluene. In addition, acetaldehyde, acetone and butanal could be identified. The product spectrum of the SPE-GC-MS (Fig. 4b) is dominated by phenol and p-cresol. In addition, other alkylphenols, 2-methyl-benzenemethanol, benzaldehyde and hydroxybenzaldehyde are found.
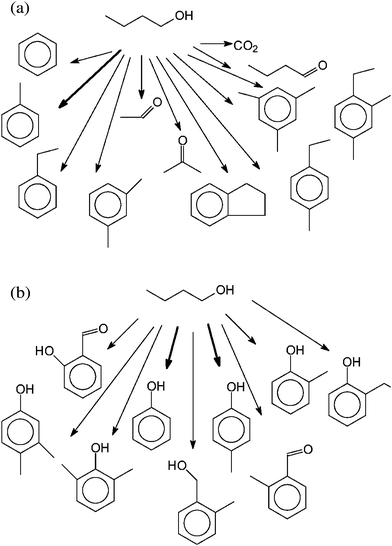 | ||
| Fig. 4 (a) Products identified by Headspace-GC-MS in the liquid phase after conversion of butanol. (b) Products identified by SPE-GC-MS in the liquid phase after conversion of butanol. | ||
The Headspace-GC-MS (Fig. 5a) after conversion of butanal shows butanal and 2-ethyl-2-hexenal as the major compounds. In addition, acetone, toluene, dimethylbenzene, benzene and 2-ethyl-2-hexanal are found.
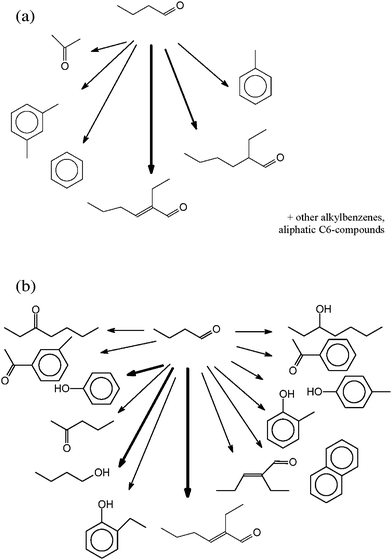 | ||
| Fig. 5 (a) Products identified by Headspace-GC-MS in the liquid phase after conversion of butanal. (b) Products identified by SPE-GC-MS in the liquid phase after conversion of butanal. | ||
The SPE-GC-MS (Fig. 5b) after reaction of butanal is dominated by 2-ethyl-2-hexenal, butanol and phenol. In addition, 2-pentanone, 2-ethyl-trans-2-butenal, 3-heptanone, 3-heptanol, naphthalene, different alkylphenols and phenylethanones are determined.
The headspace-GC-MS after conversion of butendiol (Fig. 6a) shows furan, tetrahydrofuran, benzene and different alkylbenzenes, acetaldehyde and butanone.
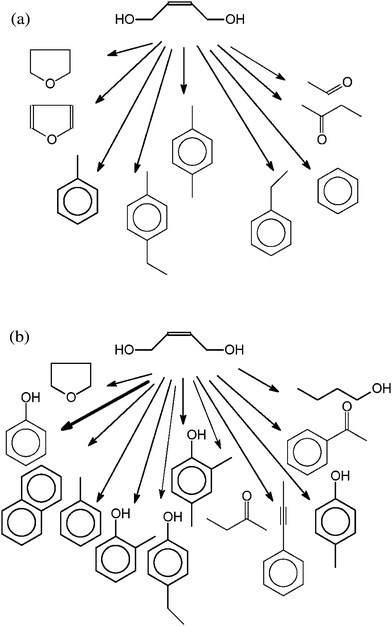 | ||
| Fig. 6 (a) Products identified by Headspace-GC-MS in the liquid phase after conversion of butendiol. (b) Products identified by SPE-GC-MS in the liquid phase after conversion of butendiol. | ||
The SPE-GC-MS (Fig. 6b) shows a strong phenol signal, and smaller signals of different alkylphenols, butanone, butanol, naphthalene, toluene, acetophenone, tetrahydrofuran, and 1-propenylbenzene.
On the other hand, a strong response in the MS does not necessarily correlate with a high concentration in the solution; therefore, the phenol concentration is measured separately.
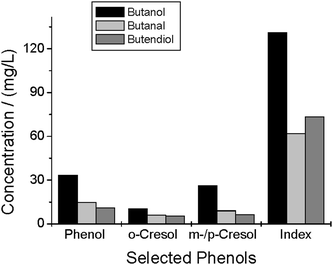
Fig. 7 shows the quantitative results of the phenols; phenol, o-cresol and the m-/p-cresol concentrations were determined by SPME-GC-FID (see experimental section). The conversion of butanol leads to higher yields than the other experiments. The phenol index value for the butanol conversion is nearly twice that of the others.
Concerning series 2, Fig. 8 shows the identified products found by SPE-GC-MS along with the most likely positions of deuterium. These are highly deuterated 3-methyl-2-butanone (1), hydroxyacetone (2), toluene (3), three different cyclopentanones (4–6) and three different phenols (7–9). The phenol content is 50 mg L−1. In the case of carbon–carbon double bonds, the carbon is connected to deuterium. In the case in which more than one hydrogen is bonded to a carbon, at least one is deuterium and one is light hydrogen (for more details, see the ESI†).
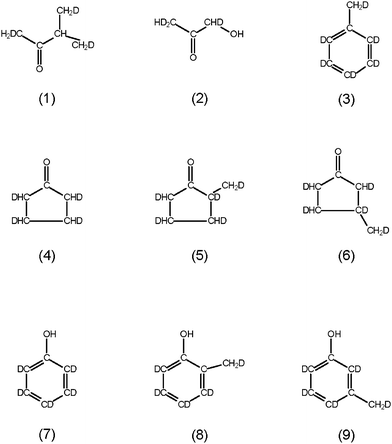 | ||
| Fig. 8 Identified deuterated products with the most likely positions of deuterium. | ||
Discussion
The GC-MS spectra after conversion of the C4-compounds show, except for butanal, no measurable amount of the feedstock compound. On the other hand, compounds of higher molecular weights, like phenols, and of lower molecular weights, like gases, were found. The high TOC content in the liquid phase shows that the conversion to gas is low in all cases.The CO2 content in the gas phase after conversion of butendiol is higher than in the cases of butanol and butanal conversion (Fig. 2). This corresponds to a lower content of total inorganic carbon in the aqueous phase (Fig. 3). Obviously, in the case of butendiol, less CO2 is dissolved and therefore more is found in the gas phase. This is also the reason why the gas yield is higher after butendiol conversion. Unfortunately, the pH value is not measured in these experiments; usually, small changes in the acidity of the solution leads to a significant change of dissolved CO2 content. The CO content in the gas phase was below 2% (L L−1) in all cases, which is a consequence of the catalysis of the water-gas shift reaction by alkali salts.7,17 This makes the system more similar to real biomass, because biomass includes alkali salts naturally, influencing the reaction pathways.17 The conclusion is that the gasification behavior of the compounds is very similar. The total organic carbon contents of the product mixtures are also similar. It seems to be slightly higher in the case of butanol, but the significance is questionable.
From prior studies, it can be assumed that butanol reacts via water elimination to butene, a typical reaction of alcohols at hydrothermal conditions. Surprisingly, this product was not found, most likely because it is too reactive18–28 (Fig. 4a,b) and the reaction time here is rather long. Instead, the Headspace-GC-MS shows the oxidation product butanal and the splitting product ethanal (Fig. 4b). The analysis by Headspace-GC-MS reveals a dominance of low boiling point and/or non-polar compounds in the MS total ion chromatogram. In the case of butanol, many different alkyl benzenes are found. The analysis by SPE-GC-MS as described above reveals a dominance of phenols in the product spectrum analyzed. In the case of butanol conversion, phenol and p-cresol dominates, but also other alkylphenols are found. If a C4 compound reacts to a higher molecular weight compound, C8 substances are also expected. These are the phenylmethanol and two benzaldehydes found in the SPE-GC-MS (Fig. 4b).
The Headspace-GC-MS and the SPE-GC-MS spectrum of butanal conversion products are dominated by 2-ethyl-2-hexenal (Fig. 5a,b). This is the aldol condensation product of two butanal molecules. The aldol condensation is a typical reaction of near and supercritical water.22,28–30 In addition to the aldol condensation product, its consecutive hydrogenation product 2-ethyl-2-hexanal is found in the Headspace-GC-MS (Fig. 5a). The SPE-GC-MS (Fig. 5b) also shows other carbonyl compounds with less than eight carbon atoms. In addition, butanol and other alcohols are formed (Fig. 5b) by hydrogenation of butanal and other carbonyl compounds. Furthermore, different phenols and benzaldehydes are found (Fig. 5b).
The reaction of butendiol should lead to furans, because the ring closure of 1,4-butanediol with elimination of water is a well-known reaction in near and supercritical water.22,28,29,31,32 In fact, furan and tetrahydrofuran are formed and found in the Headspace-GC-MS (Fig. 6a). Here, smaller carbonyl compounds, most likely splitting products and benzenes, are also found. In this case, the SPE-GC-MS is dominated by phenol and alkylphenols. Furthermore, the presence of other aromatic compounds were determined.
The main result is that in every case, phenols and/or other aromatic compounds are formed. It is obvious that a ring closure reaction occurs with every C4 compound. This is in contrast to experiments carried out at around 250 °C with different C4 compounds.32 Here, no phenols were detected. On the other hand, phenols from carbohydrates of biomass are usually formed at a higher temperature,33 like in the experiments described in the present work. In another study at 425 °C,34 1,3-butanediol ring closure reactions to compounds with more than 4 carbon atoms are observed; this is also shown in the present work.
In the case of butanediol, the yields of the measured phenols and the phenol index are higher than in the other cases. It has to be considered that only the simple phenolic compounds, phenol and cresols, were measured. In addition, the phenol index detects mainly simple phenols; the determination of the phenol index is based on a chemical reaction of a substance with the phenols. By this coupling reaction, a colored compound is formed and detected colorimetrically. Functional groups change the color of the coupling product. Particularly, additional phenolic OH-groups, leading to more than one coupling reaction, will change the color. Therefore, these phenols are not detected for the determination of the phenol index, which considers only a small color range. In addition, the phenol index is given in g g−1 of phenol equivalent in water. Molecules with a higher molecular weight than phenol have, in fact, a higher mass fraction than that given in the phenol index. In the case of the formation of a mixture of different phenols, the phenol index is lower than the real mass of phenols dissolved.
Consequently, the phenol concentration greater by a factor of around two in the case of butanediol, compared to butanal and butendiol, is not high enough to conclude that this compound has the preferred functional groups for the formation of phenols. In other words, the reaction pathway to phenols cannot be identified by these experiments. It can only be stated that there are one or more reaction pathways to phenols and that different compounds with less than six carbon atoms can form aromatic rings. It is obvious that degradation products of C4 compounds react with each other to form an aromatic ring.
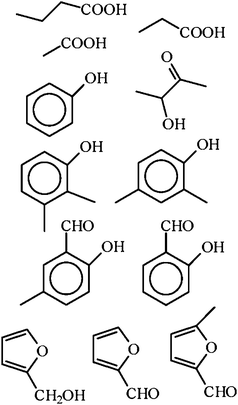
The intermediates of gasification are the products of liquefaction. Therefore, to understand the formation of intermediates, considering the results of liquefaction processes is useful. Comparing the typical products of hydrothermal liquefaction with dry biomass liquefaction processes, usually called pyrolysis, the same compounds but at different concentrations are found (Fig. 9![[thin space (1/6-em)]](https://www.rsc.org/images/entities/char_2009.gif) 35). Hydrothermal liquefactions usually occur at around 300 °C in aqueous solution. The water is assumed to have a significant influence on the reaction.6 Dry pyrolysis is regarded as a solid–gas reaction, occurring at around 600 °C. Obviously, the presence of water as reactant and solvent has a significant influence on the hydrothermal biomass gasification, because the reaction temperature is much lower. On the other hand, the collection of compounds formed is more or less the same. Typical products, occurring in wet and dry biomass liquefaction processes (“primary tars”), are shown in Fig. 9.35 Perhaps the question of the reaction pathway is not the important one. The compounds shown in Fig. 8 are relatively thermodynamically stable and/or kinetically inert compared to other intermediates that may occur. Therefore, once formed, they survive for a relatively long time and they are found in the product mixture. The detailed reaction pathway may be different and dependent on the reaction medium, but the products are more or less the same. In the presence of an iron catalyst, even carbonate reacts to phenol.36 This reaction did not happen here, because the phenols contain deuterium in the series 2 experiments. In addition, we found such reactions of phenol formation from carbonate or CO2 only in micro-autoclaves with new, not seasoned, surfaces as catalysts (unpublished results). Here the autoclave has an aged internal surface.
35). Hydrothermal liquefactions usually occur at around 300 °C in aqueous solution. The water is assumed to have a significant influence on the reaction.6 Dry pyrolysis is regarded as a solid–gas reaction, occurring at around 600 °C. Obviously, the presence of water as reactant and solvent has a significant influence on the hydrothermal biomass gasification, because the reaction temperature is much lower. On the other hand, the collection of compounds formed is more or less the same. Typical products, occurring in wet and dry biomass liquefaction processes (“primary tars”), are shown in Fig. 9.35 Perhaps the question of the reaction pathway is not the important one. The compounds shown in Fig. 8 are relatively thermodynamically stable and/or kinetically inert compared to other intermediates that may occur. Therefore, once formed, they survive for a relatively long time and they are found in the product mixture. The detailed reaction pathway may be different and dependent on the reaction medium, but the products are more or less the same. In the presence of an iron catalyst, even carbonate reacts to phenol.36 This reaction did not happen here, because the phenols contain deuterium in the series 2 experiments. In addition, we found such reactions of phenol formation from carbonate or CO2 only in micro-autoclaves with new, not seasoned, surfaces as catalysts (unpublished results). Here the autoclave has an aged internal surface.
 | ||
| Fig. 9 Some of the typical major products found in the wet and dry liquefaction process of biomass.35 | ||
One typical example of a hydrothermal reaction that is known to have an influence on biomass degradation/gasification is the water-gas shift reaction (eqn (1)). Stoichiometrically, up to 50% of the hydrogen formed should originate from water and formed by the water-gas shift reaction.17 Studies of cellulose and wood in D2O show around 100% D2 in the product gas, which means that the hydrogen is formed completely via the water-gas shift reaction.37 Furthermore, other reactions of organic compounds in D2O have been investigated before.38–49
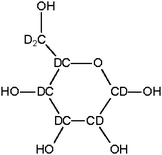
In the deuterated glucose (Fig. 10) applied here, five carbon atoms are connected with one deuterium atom and one with two. The OH-groups can easily exchange hydrogen atoms with water, but the C–D bonds are much stronger. In most reactions, the C–D bond will persist. One exception is water elimination, which may also lead to the formation of HDO. In the case of the reaction of deuterated glucose in normal water, C–H bonds can only be formed via reaction with H2 or an H–D exchange reaction. If hydrogen is formed via the water-gas shift reaction, ∼100% H2, and no HD or D2, should be formed, because the hydrogen atoms originates from the water.
 | ||
| Fig. 10 Deuterated glucose. | ||
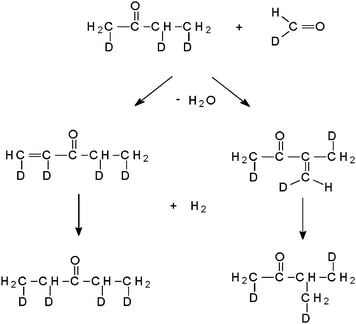
None of the products identified after the conversion of glucose (Fig. 8) are any of the primary products as shown in Fig. 1. Like for the conversion of the C4 compounds, different phenols and an alkylbenzene are found. The products still show the C–D bonds, indicating its origin of deuterated glucose. In product (1), methyl-butanone, one carbon atom is not bonded to a deuterium atom but instead to a light hydrogen atom. This hints to a hydrogenation step. A possible reaction pathway is shown in Fig. 11: butanone, a degradation product of glucose (see Fig. 1), and formaldehyde (see e.g.ref. 6) reacts via aldol condensation. These compounds possess, if they originate from deuterated glucose, at least one deuterium atom bonded to each carbon atom. The double bond formed is then hydrogenated by H2 formed by the water-gas shift reaction.
 | ||
| Fig. 11 Reaction of butanone with formaldehyde. | ||
In addition, the relatively high H content of the cyclopentanones (4–6, Fig. 8) are a consequence of the hydrogenation of double bonds with H2 formed via the water-gas shift reaction.
Conclusion
The experiments with butanol, butanal and butendiol show that phenols are formed by the reaction of more than one molecule, which was assumed before because of the reaction order of around two found in prior work.33 The formation of aromatic ring systems does not depend on single functional groups; all C4 compounds investigated form aromatic rings. In addition, typical reactions of the functional groups are found: the aldehyde reacts via an aldol condensation and the diol reacts to form a cyclic ether.The idea that intermediates react to form phenols or other aromatic compounds is also supported by the results from the conversion of deuterated glucose: the C–D bond of the glucose is still found in consecutive products, like phenols. In addition, products formed from prior intermediates by hydrogenation with H2 were detected. H2 is formed via the water-gas shift reaction. This proves the assumption that hydrogen formed via gasification and reaction with water by the water-gas shift reaction is able to react with intermediates.14
Acknowledgements
The help of Prof. Spangenberg (Applied University Offenburg), Dr Jay, G. Zwick and M. Lenzner is gratefully acknowledged.References
- A. A. Peterson, F. Vogel, R. P. Lachance, M. Froling, M. J. Antal, Jr. and J. W. Tester, Energy Environ. Sci., 2008, 1, 32–65 RSC
.
- A. Kruse, Biofuels, Bioprod. Biorefin., 2008, 2, 415–437 Search PubMed
.
- A. Kruse, J. Supercrit. Fluids, 2009, 47, 391–399 CrossRef CAS
.
- D. C. Elliott, Biofuels, Bioprod. Biorefin., 2008, 2, 254–265 Search PubMed
.
- G. van Rossum, B. Potic, S. R. A. Kersten and W. P. M. van Swaaij, Catal. Today, 2009, 145, 10–18 CrossRef CAS
.
- A. Kruse and E. Dinjus, J. Supercrit. Fluids, 2007, 41, 361–379 CrossRef CAS
.
- D. C. Elliott and L. J. Sealock, Ind. Eng. Chem. Prod. Res. Dev., 1983, 22, 426–431 CrossRef
.
- D. C. Elliott, R. T. Hallen and L. J. Sealock, Ind. Eng. Chem. Prod. Res. Dev., 1983, 22, 431–435 CrossRef
.
- A. Kruse and E. Dinjus, Angew. Chem., Int. Ed., 2003, 42, 909–911 CrossRef CAS
.
- A. Kruse and A. Gawlik, Ind. Eng. Chem. Res., 2003, 42, 267–279 CrossRef CAS
.
- T. Kaayildirim, A. Sinag and A. Kruse, Chem. Eng. Technol., 2008, 31, 1561–1568 CrossRef
.
- A. Sinag, A. Kruse and J. Rathert, Ind. Eng. Chem. Res., 2004, 43, 502–508 CrossRef CAS
.
- A. Kruse, T. Henningsen, J. Pfeiffer and A. Sinag, Ind. Eng. Chem. Res., 2003, 42, 3711–3717 CrossRef CAS
.
- A. Kruse and M. Faquir, Chem. Eng. Technol., 2007, 30, 749–754 CrossRef CAS
.
- A. Kruse and M. Faquir, Chem. Ing. Tech., 2007, 79, 544–547 CrossRef CAS
.
-
C. A. Meyer, R. B. McClintock, G. J. Silvestri, and R. C. Spencer, Jr., Steam Tables, ASME, New York, 1992 Search PubMed
.
- A. Kruse and E. Dinjus, Z. Phys. Chem., 2005, 219, 341–366 CrossRef CAS
.
- S. Ramayya, A. Brittain, C. Dealmeida, W. Mok and M. J. Antal, Fuel, 1987, 66, 1364–1371 CrossRef CAS
.
- X. Xu, M. J. J. Antal and D. G. M. Anderson, Ind. Eng. Chem. Res., 1997, 36, 23–41 CrossRef CAS
.
-
V. Diem, N. Boukis, E. Hauer and E. Dinjus, Hydrogen production from biomass in supercritical water, in Chemical Engineering Transaction, ed. S. Pierucci, Italian Association of Chemical Engineering, Milan, 2004, vol. 4, pp. 131–136 Search PubMed
.
- P. Wang, H. Kojima, K. Kobiro, K. Nakahara, T. Arita and O. Kajimoto, Bull. Chem. Soc. Jpn., 2007, 80, 1828–1832 CrossRef CAS
.
- A. Kruse and E. Dinjus, J. Supercrit. Fluids, 2007, 39, 362 CrossRef CAS
.
- V. Lehr, M. Sarlea, L. Ott and H. Vogel, Catal. Today, 2007, 121, 121–129 CrossRef CAS
.
- L. Ott, M. Bicker and H. Vogel, Green Chem., 2006, 8, 214–220 RSC
.
- L. Ott, V. Lehr, S. Urfels, M. Bicker and H. Vogel, J. Supercrit. Fluids, 2006, 38, 80–93 CrossRef CAS
.
- L. Ott, S. Kohl, M. Bicker and H. Vogel, Chem. Eng. Technol., 2005, 28, 1561–1568 CrossRef CAS
.
- S. E. Hunter and P. E. Savage, Chem. Eng. Sci., 2004, 59, 4903–4909 CrossRef CAS
.
- P. E. Savage, Chem. Rev., 1999, 99, 603–621 CrossRef CAS
.
- D. Bröll, C. Kaul, A. Krämer, P. Krammer, T. Richter, M. Jung, H. Vogel and P. Zehner, Angew. Chem., Int. Ed., 1999, 38, 2998–3014 CrossRef
.
- C. M. Comisar and P. E. Savage, Green Chem., 2004, 6, 227–231 RSC
.
- T. Richter and H. Vogel, Chem. Eng. Technol., 2001, 24, 340–343 CrossRef CAS
.
- J. M. Antal, W. S. L. Mok and G. N. Richards, Carbohydr. Res., 1990, 199, 111–115 CrossRef
.
- A. Kruse, T. Hennigsen, J. Pfeiffer and A. Sinag, Ind. Eng. Chem. Res., 2003, 42, 3711–3717 CrossRef CAS
.
- M. A. B. West and M. R. Gay, Can. J. Chem. Eng., 1987, 65, 645–651 CrossRef CAS
.
-
N. Dahmen, E. Henrich, A. Kruse, K. Raffelt, Biomass liquefaction and gasification, in Biomass to Biofuels: Strategies for Global Industries, John Wiley & Sons, Weinheim, 2009, in press Search PubMed
.
- G. Tian, H. Yuan, Y. Mu, C. He and S. Feng, Org. Lett., 2007, 9, 2019–2021 CrossRef CAS
.
-
N. Sugimoto, Y. Ishida, K. Ktagawa, and T. Hasegawa, in 4th International Energy Conversion Engineering Conference, American Institute of Aeronautics and Astronautics, San Diego, 2006, AIAA-2006-4155 Search PubMed
.
- J. Kalpala, K. Hartonen, M. Huhdanpää and M.-L. Riekkola, Green Chem., 2003, 5, 670–676 RSC
.
- B. Kerler, J. Pol, K. Hartonen, M. T. Soderstrom, H. T. Koskela and M. L. Riekkola, J. Supercrit. Fluids, 2007, 39, 381–388 CrossRef CAS
.
- B. Kuhlmann, E. M. Arnett and M. Siskin, J. Org. Chem., 1994, 59, 5377–5380 CrossRef CAS
.
- S. Matsubara and K. Oshima, Yuki Gosei Kagaku Kyokaishi, 2005, 63, 154–161 Search PubMed
.
- J. M. L. Penninger and K. Versluis, Fuel, 1982, 61, 283–290 CrossRef CAS
.
- Y. Yang and R. F. Evilia, J. Supercrit. Fluids, 1996, 9, 113–117 CrossRef CAS
.
- Y. Yang and R. F. Evilia, J. Supercrit. Fluids, 1999, 15, 165–172 CrossRef CAS
.
- A. Kruse and K. H. Ebert, Ber. Bunsen-Ges. Phys. Chem., 1996, 100, 80–83 CAS
.
- M. M. Hoffmann and M. S. Conradi, J. Supercrit. Fluids, 1998, 14, 31–40 CrossRef CAS
.
- C. Boix and M. Poliakoff, Tetrahedron Lett., 1999, 40, 4433–4436 CrossRef CAS
.
- Y. Cheng, H. Fan, S. Wu, Q. Wang, J. Guo, L. Gao, B. Zong and B. Han, Green Chem., 2009, 11, 1061–1065 RSC
.
- S. Matsubara, Y. Yokota and K. Oshima, Org. Lett., 2004, 6, 2071–2073 CAS
.
Footnote |
| † Electronic supplementary information (ESI) available: Results of experiment series I and II. See DOI: 10.1039/b915034j |
| This journal is © The Royal Society of Chemistry 2010 |

