Fibre optic microarrays
David R.
Walt
*
Department of Chemistry, Tufts University, Medford, MA 02116, USA. E-mail: david.walt@tufts.edu
First published on 28th October 2009
Abstract
This tutorial review describes how fibre optic microarrays can be used to create a variety of sensing and measurement systems. This review covers the basics of optical fibres and arrays, the different microarray architectures, and describes a multitude of applications. Such arrays enable multiplexed sensing for a variety of analytes including nucleic acids, vapours, and biomolecules. Polymer-coated fibre arrays can be used for measuring microscopic chemical phenomena, such as corrosion and localized release of biochemicals from cells. In addition, these microarrays can serve as a substrate for fundamental studies of single molecules and single cells. The review covers topics of interest to chemists, biologists, materials scientists, and engineers.
 David R. Walt | David R. Walt is the Robinson Professor of Chemistry and Howard Hughes Medical Institute Professor at Tufts University. Dr Walt’s research focuses on fundamental aspects of single molecules and single cells as well as the practical application of arrays to the detection of a variety of important analytes. He is Founding Scientist, Director, and Chairman of the Scientific Advisory Boards at both Illumina, Inc. and Quanterix Corporation. Dr Walt is a Member of the National Academy of Engineering, a Fellow of the American Institute of Medical and Biological Engineers, and a Fellow of the American Association for the Advancement of Science. Dr Walt has published over 250 papers and holds over 50 patents. |
1. Introduction
Measurements enable many fields—medical diagnostics, environmental monitoring, chemical processing, food manufacturing, and a wide range of other applications. In some instances, it is sufficient to make a single measurement, such as pH for monitoring a chemical reaction, CO2 for a mammalian cell culture, or glucose for monitoring a diabetic patient. Single analyte measurements can be extremely informative and valuable. On the other hand, there are many situations where a single measurement is inadequate. For example, many medical conditions require monitoring multiple analytes simultaneously; pharmaceutical-producing fermentations require measurement of pH, oxygen, carbon dioxide, lactic acid, as well as the product molecule; and understanding gene expression may require the measurement of thousands of gene sequences. Making multiple measurements can be accomplished in a variety of ways. For example, one can measure each analyte individually by dividing a sample into multiple aliquots and analyzing each aliquot for a particular chemical species. Alternatively, there are many sophisticated laboratory-based instruments that are capable of making multiplexed measurements such as mass spectrometers, gas chromatographs, HPLCs, capillary electrophoresis systems, and various spectroscopic methods. These methods typically operate by first separating the various components in a sample and then analyzing these components with a common detector element. For example, chromatography systems first separate the components on a column and then identify each component by its residence time. Spectroscopic methods employ the unique signature of each species in the sample and then de-convolute the spectrum into its various components to identify the individual chemical species. Both of these approaches have limitations because complex mixtures may contain analytes that overlap either in their separation or spectroscopic properties.Microarrays are a powerful new analytical tool for analyzing complex mixtures.1 A typical microarray comprises a substrate, such as glass, silicon, nylon, or a variety of plastics, onto which a number of different binding sites are deposited or attached. These binding sites are referred to as “features”. Each feature has a different binding specificity. Consequently, upon binding, each analyte separates from other components of the sample by virtue of the binding specificity of each feature. Upon analyte binding, a signal change occurs at the feature, which is detected via a transduction mechanism. Binding results in a signal, such as an optical, electrochemical, thermal, or mass change. In many respects, microarrays operate in a manner similar to chromatography systems in that they separate the components spatially and detect them via a common transduction mechanism. Microarrays have become a staple of genetic analysis with state-of-the-art microarrays containing millions of features. In addition, protein, small molecule, and cell microarrays are widely used for performing multiplex analysis as well as for many screening applications.
In this review, I will discuss fibre optic microarrays in which the substrate is a bundle of optical fibres. Fibre optic microarrays can be prepared containing a variety of features with different specificities. Fibre optic microarrays have been used for a variety of applications as well as for fundamental research. This review will begin with an introduction to optical fibres, a description of how such fibres can be used to prepare microarrays, and how such microarrays can be used for a variety of applications.
2. Optical fibres
2.1 Basics of optical fibres and arrays
Optical fibres comprise two different types of glass—a “core” surrounded by a “clad” with a lower refractive index (Fig. 1). Light that enters the core within a critical angle Φc, defined by the difference between the refractive indices of the clad and core, will exhibit total internal reflection as it travels down the fibre.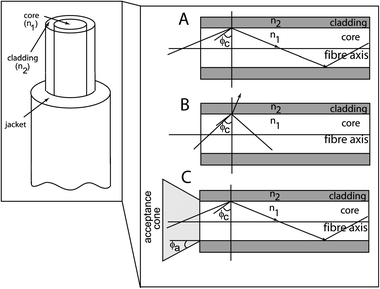 | ||
| Fig. 1 Diagram of an optical fibre with a core and clad structure. Expanded view: mechanism of total internal reflection in a step index fibre. (A) Light angle is greater than the critical angle (Φc) such that total internal reflection occurs. (B) Light angle is less than the critical angle causing partial reflection and refraction. (C) Acceptance cone of the optical fibre—total internal reflection will only occur if light is within the acceptance cone of the fibre. Courtesy Jenny Tam. | ||
In this manner, light can be efficiently transmitted over long distances with low attenuation. Another feature of optical fibres is they are able to transmit multiple wavelengths simultaneously with no interference. These principles are the basis for the successful use of optical fibres in the telecommunications industry and have led to the revolution in transmitting data over the Internet. Typical optical fibres have core diameters between one to several hundred microns with a thin cladding of several microns to tens of microns. Even though such fibres are only a few times larger than a human hair, they can transmit much more data than a much larger copper coaxial cable.
An optical fibre containing only a single core is unable to maintain spatial information. For example, if two dots, one yellow and one blue, were observed at one end of an optical fibre, after transmission through the fibre one would observe green light exiting the other end with complete loss of spatial information. In order to preserve such information, it is necessary to employ a coherent fibre bundle. Fibre bundles are arrays of hundreds to many thousands of fibres bundled and fused such that they can transmit images (Fig. 2). Fibre bundles are prepared in an iterative process starting with a pre-form. The pre-form is a piece of glass containing a large core surrounded by an appropriately sized clad. Typically, for fibre bundles, the cross-section of the core is circular while the cross-section of the clad is hexagonal. Multiple pre-forms are bundled in a “six around one” packing arrangement. The seven pieces of glass are heated until they fuse. Once fused, the material is loaded into a fibre drawing column, melted, and then drawn resulting in a material with the same aspect ratio but reduced significantly in size. The resulting material is cleaved, repacked, fused, melted, and drawn again and this process is iterated until a high-density fibre array is formed. The resulting fibre bundle contains clads and cores that have an identical aspect ratio to the initial starting glass materials. Typically, the resulting individual cores are between 2 and 10 μm with an array containing tens of thousands of individual fibres. Typical fibres discussed in this review contain 50![[thin space (1/6-em)]](https://www.rsc.org/images/entities/char_2009.gif) 000 fibres with an overall diameter of 1.5 mm.
000 fibres with an overall diameter of 1.5 mm.
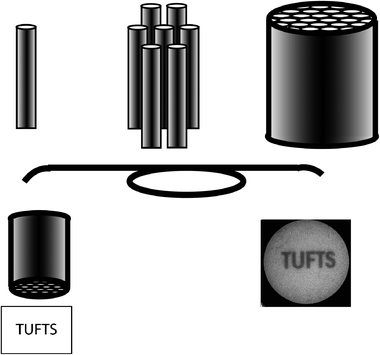 | ||
| Fig. 2 Schematic of fibre bundles: fibre bundles are composed of thousands to millions of coherently fused fibres and can be used for imaging purposes. Courtesy Jenny Tam. | ||
This technology is well established with a number of companies making commercial arrays. Because of the manufacturing process, the resulting fibre arrays, also called fibre bundles and imaging fibres, are coherent meaning that the position of an individual fibre on one end is identical to its position on the other end. The imaging capabilities of these arrays result from the coherent nature of the bundles. If the bundle is placed in contact with something, such as a black letter on white paper, each microfibre in the array will carry either a black or white signal depending upon whether it is in contact with a letter or with the paper, respectively (Fig. 2, bottom). At the edges of the letter, some individual fibres may be in contact with both the black letter and the white paper. These fibres will carry a mixed-signal—a shade of gray—but they will be difficult to distinguish because the size of an individual fibre is too small for the human eye to resolve. The resulting image of the letter will be carried from the end where it is collected—the “proximal” end—and will be transmitted through the fibre to the viewing end—the “distal” end. In general, the individual fibres—sometimes called “pixels”—are too small to resolve by the human eye. Consequently, when a macroscopic object is viewed through the fibre array, the resolution is more than adequate. On the other hand, when viewing the fibre array through a microscope, the individual fibres can be seen resulting in a phenomenon called pixelation (Fig. 3). Such arrays can be used for remote imaging and have been used in applications such as endoscopy or assessing hazardous environments such as nuclear power plants.
 | ||
| Fig. 3 An image of the letterhead on a piece of stationery. The main image can be seen with good resolution. As the magnification increases, the image quality degrades and individual fibres are observed, producing the “pixelated” image at the lower left. Courtesy Matthew Aernecke. | ||
The simple manufacturing process for creating fibre arrays leads to a substrate with extremely high density thereby making it ideal as a substrate for microarrays. Ideally, one would have each optical fibre in the array correspond to an individual feature on a microarray. One possibility would be to physically deposit materials such as polymers containing the requisite binding specificity on each fibre. While such an approach was initially used to prepare low density arrays,2 for high-density arrays, this approach would require extraordinary precision in positioning each material and would require handling thousands of separate materials. In addition, such an approach would require serial preparation of arrays—an inefficient process. In order to accomplish the goal of preparing a microarray with a one-to-one feature to fibre pixel correspondence, a different approach was taken. As mentioned earlier, the core and clad materials of the fibre have different chemical compositions. Typically the fibre core is made from pure silica while the clad material comprises both silica and germania to reduce the refractive index. Pure silica is a softer glass than germania-doped silica and, when a polished fibre bundle is placed in an acid etch bath, the fibre core etches faster than the clad resulting in indentations on the end of the fibre3 (Fig. 4). As can be seen from Fig. 4, the fibre cores have etched back from the face of the fibre creating “wells” that are defined by the diameter of the core and where the bottom of each well is defined by the face of the optical fibre core from which it was created. For a typical fibre core of 3 μm diameter, etched to a depth of 3 μm, the volume of an individual well is several tens of femtolitres. When such a microwell array is placed into a solution containing size-matched latex or silica microspheres (beads), capillary forces cause the microspheres to assemble such that each well contains one microsphere (Fig. 4, right). Assembly can also be performed by pipetting a droplet of bead solution onto the etched fibre end, allowing the solution to evaporate, followed by wiping excess beads off the surface. A final way to create bead arrays is to gently press a dry etched fibre bundle into a bead powder and physically load beads into wells.
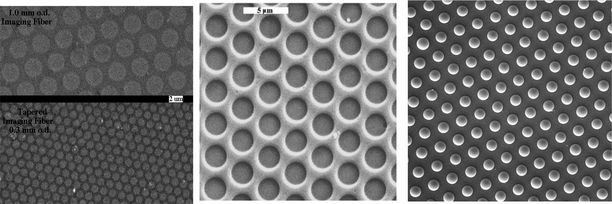 | ||
| Fig. 4 Left—SEM images of small regions of two different fibre arrays with different fibre diameters. Centre—etched fibre showing microwells. The bottom face of each microwell is the optical fibre core, which has etched into the surrounding clad. Right—microspheres can be loaded into the microwells. | ||
Optical fibre bead arrays can serve as a substrate for microarrays. Individual beads in the array are the features or sensing elements of the microarray.4 Because bead assembly is random, i.e. a particular bead cannot be placed in a particular microwell on the fibre face, it is necessary to encode different beads to identify their specificity (Fig. 5). For example, assume we want to prepare an array containing three different specificities—glucose, lactic acid, and cholesterol.
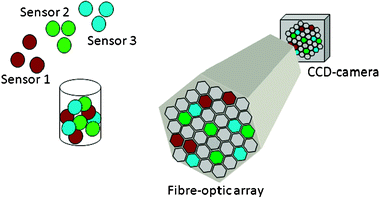 | ||
| Fig. 5 Three different bead types, each carrying its own colour code, are loaded into the etched fibre array, creating a “random array”. | ||
We start by preparing three different bead sets by attaching the three specific chemistries to each bead type. Either before or after we attach the different chemistries to the beads, we encode each bead type by incorporating a fluorescent dye, either through entrapment within the bead or by attachment to the bead surface. The choice between entrapment or attachment depends on the bead composition. The fluorescent dyes used for encoding should not react with the analyte, should not interfere with the sensing chemistry, and should not have spectral overlap with the sensing dye. Different types of encoding are employed—different dyes, different amounts of each dye, and different dye combinations can all be employed to build a set of codes that provide a large number of bead types. After the three different microsphere types have been prepared, they are mixed into a sensor library by simply placing equal aliquots of the three bead solutions into a vial (Fig. 5). A gram of 3 μm diameter beads contains 1012 particles. Consequently, a small absolute mass of beads contains enough material to prepare thousands to millions of microarrays. The bead mixture is then loaded into an etched optical fibre array. The different bead types load randomly into the wells, but since each bead type carries with it a different encoding dye, it is trivial to decode the different beads in the array and thereby map the position of each bead in the microarray.4 The loading process is random, resulting in a statistical number of beads of each sensor type being loaded into a particular array. While each array is different in the positions of each bead type, every array is identical in terms of the response characteristics of the beads. This fabrication method enables reproducible arrays to be prepared, making for a simple manufacturing process.
While different beads within a given sensor type may have slight variations in response, by summing the signals from all the beads of a given specificity, the bead-to-bead variation is eliminated. Summing beads has another advantage—an improved signal-to-noise ratio. It is well known that S/N ratio scales as the number of measurements N by a factor of √N. By having multiple replicates of each microsphere type, the S/N ratio can be improved leading to more precise measurement and also to improved sensitivity.5
The random assembly of the bead arrays is quite distinct from virtually all other types of microarray. All other microarrays are directed arrays in which the position of a particular feature (i.e. specificity) is pre-determined by its assembly process.1 Although directed arrays do not require any decoding, because the position of each feature is defined, there is a significant amount of effort required to prepare such arrays—either by sequential spotting, photo-masks, or localized chemical addressing. Random arrays, on the other hand, are easy to assemble but require an additional step of decoding to map the locations of all the beads in the microarray.
In addition, because the beads self-assemble into the etched fibres, the feature sizes can be quite small compared to most other microarray fabrication protocols. It is even possible to prepare nanobead arrays using the same approach, showing the scalability of the assembly process.6
2.2 Instrumental aspects
Optical fibres are able to carry light to remote locations. Consequently, the instrumentation used to interrogate the fibre and collect signals from the fibre array is slightly different from conventional instrumentation. Fibre optic microarrays employ fluorescence as the transduction mechanism. The light path for a typical optical fibre microarray is shown in Fig. 6.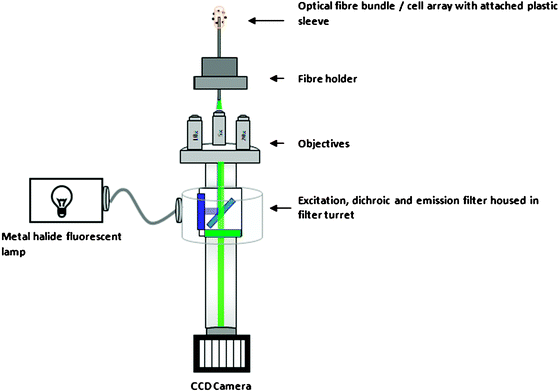 | ||
| Fig. 6 Instrumental setup for interrogating optical fibre arrays. Courtesy Ragnhild Whitaker. | ||
Excitation light is introduced into the proximal end of the fibre (i.e. closest to the instrument) from a monochromatic light source such as a laser, LED, or broadband white light source filtered with an appropriate dichroic filter. Usually, the excitation light is first collimated and then sent through an objective to focus the light onto the proximal end of the fibre. Excitation light entering the proximal end of the fibre within the fibre’s acceptance cone is transmitted via total internal reflection to the distal end of the fibre. Fluorescence is isotropic; i.e., fluorescent light emitted from a fluorescent indicator close to the fibre’s distal surface is emitted in all directions. Light that is emitted in the direction of the optical fibre will be captured into the core as long as it is within the acceptance cone. As a result, emitted fluorescent light will return only through the individual optical fibre in the microarray that was used to excite it. In this manner, each optical fibre in the fibre optic microarray can be used to individually interrogate each bead within the wells. The optical fibres serve as conduits for carrying light from a remote light source to the microarray and then back.
Upon exiting the proximal end of the fibre, the returning light is first magnified through the same objective that was used to focus the excitation light and is filtered to remove any reflected or scattered excitation light. The remaining fluorescence light is then sent to a two dimensional detector, such as a CCD camera, to create an image of the fluorescence as a function of position. The fluorescence intensity collected from each bead corresponds to the amount of analyte and can be used to quantify analyte concentration. This general setup can be used to prepare microarrays for many different applications. These applications will be discussed in the remaining sections of this review.
3. Applications
3.1 Nucleic acids
The most common application of microarrays is for detecting nucleic acids. Today’s commercially available DNA microarrays are capable of detecting over one million DNA sequences at a time. Fibre optic microarrays are a significant component in the commercial DNA microarray field.7–14DNA microarrays employ optical fibres in the same manner as described above. First, different nucleic acid sequences are attached to surface modified microspheres. Microspheres can be composed of either polymers, such as cross-linked polystyrene, or they can be made of silica. In either case, the surface of the microspheres is first activated to enable attachment of a DNA probe molecule. DNA probes are single-stranded DNA sequences that are complementary to a sequence of interest. For example, silica beads can be activated by reacting them with an organosilane, such as trimethoxyaminopropyl silane. The silane reacts with surface hydroxyl groups on the silica surface to produce a covalently attached aminopropyl group. The aminopropyl group can be activated with a variety of cross-linking reagents. For example, glutaraldehyde can be used to activate the surface by reacting with the surface amino groups. Synthetic single-stranded DNA probes, containing a reactive functional group modification, such as an amino group, is then allowed to react with the surface activated microspheres. Each individual microsphere typically contains hundreds of thousands of identical copies of the DNA probe molecule. To prepare a DNA microarray, anywhere from 10 to over one million microsphere types can be combined.
For fibre optic DNA microarrays containing on the order of 10–100 probes, the encoding scheme described above can be used in which each different microsphere type is encoded with a particular combination of dyes with varying intensities. For arrays with more than 100 microsphere types, a different strategy is required. Rather than encoding microspheres, the different microsphere types are decoded. The decoding process takes advantage of the fact that each bead type contains a different DNA sequence. These sequences intrinsically provide the information about their specificities. Imagine that we have eight different bead types in a mixture and this mixture is used to prepare many fibre optic microarrays (Fig. 7). Each microarray will contain the same eight bead types except that the positions of each bead in the array are different. What distinguishes one bead from another is the DNA sequence attached to its surface. In order to decode the array, each microarray is exposed to a decoding solution containing all eight complementary DNA sequences. Four sequences, numbered 0–3, are labelled with a red fluorescent dye and the remaining eight sequences 4–7 are labelled with a green fluorescent dye. After hybridization to each sequence’s complementary probe, a fluorescence image is taken. Any microsphere that appears red must contain the complements to sequences 0–3, while any green microspheres must be complementary to sequences 4–7. This first “decoding solution” has reduced the uncertainty of each microsphere type from one in eight to one in four. After the images are taken, the fibre array is placed in a dehybridization solution to remove or strip hybridized sequences off the beads leaving only the covalently attached probe molecules on the surface. The procedure is repeated two additional times with two additional decoding solutions, containing the same eight complementary sequences but with different combinations of red and green labels in each decoding solution. The result of a three step decoding process containing two colours is 23 = 8 unique codes as can be seen in Fig. 7.
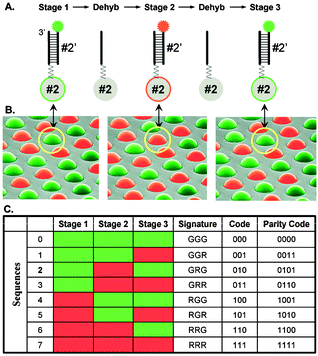 | ||
| Fig. 7 Decoding eight different probe sequences in a random array. In the first step, four complementary sequences are labelled green and four others are labelled red. Upon hybridization, decoding sequences complementary to beads 0–3 fluoresce green while sequences 4–7 fluoresce red. After dehybridization, another decoding solution is hybridized containing the red and green labels on a different set of sequences. Three iterative hybridization–dehybridization steps give unique codes to every bead in the array.32 Reprinted by permission of Cold Spring Harbor Press. | ||
In practice, four-colour decoding is employed in six steps providing 46 = 4096 unique codes. The same decoding solution can be employed for decoding many thousands of arrays. The ability to decode large numbers of different bead types in this combinatorial but scalable manner makes the random array concept practical and extremely useful.
There have been many papers published using DNA fibre optic microarrays. I will give only a few illustrative examples here. DNA microarrays can be used to detect the presence or absence of specific pathogens including both viruses and bacteria. Applications where pathogen detection is important include medical diagnostics, food safety,12 and protection from terrorist threats.13,14 The value of microarrays is that they can be used to detect as many organisms as required. Even within a given species, such as Escherichia coli, there are many different strains with some strains exhibiting further diversification called serotypes. Small differences between strains and serotypes can have dramatically different effects on humans with some being innocuous while other strains can be extremely pathogenic, such as the E. coli strain H157:07, a strain that has been responsible for many cases of food borne illness with some severe cases leading to death. These differences can only be deduced by interrogating the DNA sequence. There are a number of ways to determine DNA sequences using microarrays with hybridization being the common readout mechanism for all of them.
Before hybridization to the array, a variety of biochemical or molecular biological methods are employed. These methods are designed to purify, fragment, and amplify the DNA. For example, for microorganisms, cells must be lysed to break open the contents and release the DNA. A variety of methods can be used to isolate and purify the DNA from cell membrane fragments, proteins, and small molecules present within the cell. DNA needs to be fragmented because there is only one very high molecular weight copy of each DNA molecule per cell. Fragmentation reduces the formation of secondary structures, improves diffusional properties by reducing molecular size, and prevents DNA from existing in a highly compact form. Amplification is performed using a variety of molecular biology techniques with the polymerase chain reaction (PCR) being the most commonly used. PCR enables an exponential amplification of a user-defined specific DNA sequence.
Genotyping is aimed at determining the variation in gene sequence over parts of the genome. Genotyping can range from determining relatively large sequence differences at different loci to determining single base differences, known as single nucleotide polymorphisms (SNPs). SNPs require a much more sophisticated analysis scheme to ensure specificity.
For most DNA genotyping studies, hybridization is simply a readout mechanism. It is a common misconception of many researchers that hybridization alone is sufficient for specificity. For large scale genotyping where many thousands to over a million sequences are analyzed simultaneously, it would be impossible to use only hybridization for specificity as there are too many sequences with similar structure. Consequently, all modern methods for performing high content DNA analysis rely on an enzymatic assay as a preliminary step before hybridization to the array. One example that illustrates this concept is the ligation assay (Fig. 8). In this approach, a series of DNA probes is hybridized in solution to the target sequences. For each region of DNA, three different probes are employed: the first probe is common to the particular region of DNA being interrogated—the locus—and the other two probes interrogate either of the single nucleotide polymorphisms (SNPs) associated with that locus. In the presence of a DNA polymerase and a ligase, extension and ligation of the two probe sequences occurs. Each of the two different SNPs has a different dye attached to the two allele-specific sequences. After ligation of all the sequences, the entire solution is hybridized to the array using a locus-specific sequence probe attached to the microspheres. By observing which colour dye hybridizes to each microsphere in the array, it is possible to simultaneously genotype over a million genomic sites.
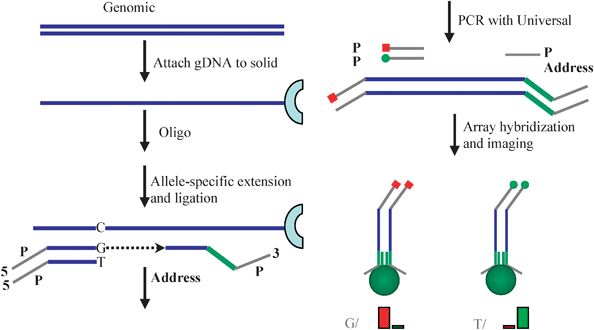 | ||
| Fig. 8 Genotyping using an extension–ligation assay. A solution-based enzymatic assay is conducted first in which SNPs are converted into dye-labelled extended sequences that can hybridize to beads in the array. Adapted from ref. 33 and reprinted with permission of Cold Spring Harbor Press. | ||
The extension–ligation assay is only one type of enzymatic assay that can be used to generate specificity into a nucleic acid assay. A variety of assays can be used to accomplish the same type of specificity.
Assays enable the preparation of universal arrays. Microarrays for microbial detection can be comprehensive in that they can include sequences for virtually all known pathogens—food borne pathogens, diseases such as influenza or other respiratory diseases, biological warfare agents, etc. Such arrays can be considered “universal” because they can detect all known human pathogens. Even if a mutation exists in these organisms, there are enough sequences present in such arrays that some type of signal will be produced, indicating that a closely related pathogen may be present. It is important to note that for most microbes, there are no unique sequences that enable the identification of a particular organism; rather, there are differences in the bases at many locations that provide the uniqueness. For example, at a given locus, there may be a small number of different alleles. Many organisms may share this allel at each locus. At a different locus, the organism may share its sequence with a different subset of microbes. Thus, no single locus, or even subset of loci may enable unequivocal identification of a particular organism but by looking at many different loci, one can distinguish the different organisms. These similarities in sequence across many different parts of the genome between organisms require that microarrays contain many different sequences.
3.2 Proteins
Proteins are another important analyte class that can be measured using optical fibre microarrays. For protein detection, the most common assay format is based on enzyme linked immunosorbent assays, also referred to as ELISAs. In bead-based ELISAs, a “capture” antibody is attached to the bead surface. When incubated with a solution containing a protein of interest, the capture antibody binds to the protein. All other proteins are then washed from the array surface. A detection antibody that recognizes a different epitope on the protein is then exposed to the protein bound to the surface, creating a sandwich. The detection antibody is labelled with a fluorescent dye or an enzyme. If the detection antibody is labelled with a dye, then the microsphere becomes fluorescent. If an enzyme label is used, then the detection antibody is visualized with a fluorogenic substrate in which a non-fluorescent substrate is converted into a fluorescent product by the enzyme. By attaching different capture antibodies to different encoded beads, a multiplexed protein array can be prepared. Using this methodology, fibre optic microarrays for a variety of proteins was developed to measure the presence of cytokines (inflammatory response proteins) in saliva.153.3 Artificial nose
A very different approach to performing optical sensing is based on the mammalian olfactory system. Unlike most biological recognition processes in which a specific ligand binds to a specific receptor, the olfactory system is based upon cross-reactive receptors. In mammalian olfaction, between several hundred and 1000 receptor types are distributed throughout the olfactory epithelium. Each odorant receptor cell expresses only one type of receptor with many cells expressing each receptor type. Upon exposure to a particular odorant, even a pure compound, many different cell types respond. Upon exposure to a different odorant, a different population of cells will respond. The particular pattern of response encodes the identity of the odorant. Each receptor type has the ability to respond to many different odorants, usually within a particular class of compound (e.g. aldehydes) and within a limited range of structural variation. Consequently, receptors are referred to as “cross-reactive” because they can respond to a range of compounds. Moreover, a specific receptor is not responsible for recognizing a particular odorant; rather, recognition is distributed over the entire response pattern.Electronic noses have been around for almost three decades. These systems are loosely based on the mammalian olfactory system in that they contain an array of cross-reactive sensor elements to generate a pattern upon exposure to a particular vapour.16 These systems have been plagued by their poor reproducibility that is the inability to prepare multiple arrays that respond similarly. The problem becomes one of training a suitable pattern recognition program and being able to transfer that training from one array to another. Although it is fairly straightforward to train a particular array to recognize a given set of vapours, when that array loses its sensitivity over time, it must be replaced by another array that, while close, is not identical. As a result, the pattern recognition program must be trained with the new array. Getting back to the biological system, our odorant receptor cells are replaced approximately every six months. Imagine what would happen if every time our odorant cells were replaced we lost all of our previous odour memory because our brains could no longer recognize the odours that we had been exposed to six months before.
Optical fibre microarrays can be used to create “artificial noses”—a term we use instead of electronic noses since they are based on optical, rather than electronic, transduction. We employ fluorescent sensors using the beads in wells approach described previously. Sensor responses are based on the solvatochromic effect. A solvatochromic dye is either bound to the surface of microspheres or is entrapped within a microsphere. Solvatochromic dyes respond to their local polarity. Consequently, the surface or interior of a microsphere causes the solvatochromic dye to fluoresce at a particular wavelength and with a particular intensity. When a given microsphere is exposed to an organic vapour, the vapour will partition into the microsphere and the polarity of the microsphere will be changed such that it will be a combination of the intrinsic polarity of the microsphere material and the polarity of the vapour. For example, if a vapour is less polar than the microsphere material, when the vapour either adsorbs or absorbs to the microsphere, it will cause the local microenvironment to become less polar and will cause the solvatochromic dye to shift its emission maximum toward the blue range of the spectrum. The same vapour will cause a low polarity microsphere to shift toward the red end of the spectrum. This pattern of spectral shifts can be used to create a cross-reactive array when a library of microspheres is employed. In practice, microspheres are typically interrogated at a single wavelength so that the spectral shift manifests as either an increase or decrease in fluorescence depending upon whether the dye’s emission maximum is moving closer to or farther away from the wavelength that is being monitored.
To create an artificial nose using microspheres, we employ the same general approach described previously.5,17,18 A library of different microspheres with different compositions is distributed randomly on a microwell array that has been etched on the distal end of an optical fibre. As before, microspheres distribute randomly over the array face. Decoding is still required; however, it is much simpler with artificial nose arrays.5 Upon exposure to a particular vapour (e.g. methanol), a given microsphere type will respond with a characteristic pattern. Different microspheres give different temporal response profiles and these profiles can be recognized and used to map the locations of each different microsphere in the array. We refer to these types of arrays as “self-encoded” because the intrinsic response pattern of each microsphere indicates which type of microsphere it is. Once the locations of each microsphere type are known, the array can be used for analytical purposes.
A typical response to a particular vapour consists of a time varying fluorescence intensity resulting from exposure of the bead to a vapour pulse (Fig. 9). Images of all the beads in the array are taken before, during and after the vapour pulse.
 | ||
| Fig. 9 Concatenated vapour responses from different bead types (top labels). Different vapour types are colour coded: chloroform (blue), dimethyl methylphosphonate (pink), ethanol (green), heptane (red), p-cymene (purple), isopropenyl acetate (turquoise), water (gray). Courtesy of Sandra Bencic-Nagale. | ||
Each bead provides a different temporal response profile depending upon how a particular vapour affects the polarity of the solvatochromic dye. Each different bead type in the array provides a unique response profile for a given vapour. The response profiles of many different bead types in the array provide a characteristic pattern that can be used to identify a particular vapour.
Before an artificial nose array can be used for identification, it must first be trained. In the initial training, the array is exposed to a wide range of vapour analytes. The response patterns from all the microspheres in the array are collected. A sufficient number of vapour responses is required to build up an adequate database. The database serves as an “odour memory”. These response patterns are used to train a pattern recognition algorithm. The pattern recognition algorithm converts vapour responses into analyte identification. Many different algorithms can be employed including principal component analysis, learning vector quantization, support vector machines, and other classification methods. While beyond the scope of this review, all pattern recognition algorithms fall into one of two categories. In a supervised algorithm, the identity of the vapours used during training is provided to the system and the classification algorithm searches for the closest match between an unknown response profile and the response profiles stored in a database. In an unsupervised algorithm, the identities are unknown and the classification scheme is used to group or cluster all the response profiles from a set of vapour exposures.
Several unique advantages of artificial nose array-based optical fibres are that many replicates of each bead type are present. As a result, once the array has been decoded, as described above, all the beads of a particular type can be summed. By summing beads, bead-to-bead variation is eliminated because, by summing an identical but statistically significant number of beads, the variations cancel. In addition, improvements in signal-to-noise ratio are obtained.5 Signal-to-noise improves by a factor of the square root of the number of beads summed. Consequently, by summing more beads, the signal-to-noise ratio increases and the detection limit improves. In this way, by using thousands of beads, it is possible to use intrinsically insensitive beads to make sensitive measurements.
Finally, the bead array approach provides a solution to the problem of having to retrain the system each time an array needs to be replaced.18 The bead library contains billions to trillions of replicates per gram of solid. Consequently, when a given array loses its sensitivity or becomes photobleached, the sensing elements can be readily replaced with identically responding beads from the same library. In this manner, a new array is prepared that has the same response profile. Because of the random nature of the array, decoding is necessary but no retraining is required.
3.4 Cells
Another way of using optical fibre microarrays is to fill them with living cells. Using the same etching procedures described above, fibre arrays can be prepared such that individual living cells can be loaded into individual microwells. Cell loading is accomplished by placing a sleeve around the optical fibre, filling the sleeve with a culture medium containing cells, and allowing the cells to settle via gravity. By using optical fibre arrays in which the fibre cores are matched in size to the size of the cells of interest, after loading, each well contains only one cell. It is important to maintain a liquid medium at all times because exposing the cells to air even for a fraction of a second is sufficient to cause complete evaporation of the residual liquid from the fibre surface and will lead to cell death.What is the value of isolating individual cells in microwells? It is becoming increasingly clear that observing the average or ensemble responses from many hundreds, thousands, or millions of cells masks the cell-to-cell diversity. An illustrative experiment was performed with single cell microwell arrays to study the diversity of responses in a yeast two-hybrid experiment. A yeast two-hybrid experiment is designed to determine if two proteins interact. Under normal transcription, a promoter sequence of a gene is activated by a protein containing both a DNA binding domain and an activation domain. In a yeast two-hybrid experiment, these two domains are split and each domain is coupled to one of the two proteins being studied for protein–protein interaction. If the two proteins interact, they reconstitute the activator protein and transcription occurs. If the two proteins do not interact, then no transcription occurs. Transcription leads to the production of a reporter gene, such as a fluorescent protein or an enzyme, located downstream from the promoter.
In this study, different strains of yeast were first encoded with three colours of dye-labelled concanavalin A (Fig. 10). Concanavalin A binds to mannose residues on the yeast membrane surface. Three different strains of yeast were each labelled with concanavalin A conjugated to three different dyes. The three different yeast strains were mixed and the mixture was then distributed onto an etched optical fibre array. An image was taken and the three different colours were used to identify which strain of yeast was located in each well. The three strains included a wild-type strain that had not been genetically manipulated, a negative control in which the two non-interacting halves of the enzyme were genetically inserted, and a positive strain in which two proteins were inserted that were known to interact. In the construct used in our experiments, the reporter gene was β-galactosidase and the yeasts were exposed to a fluorogenic substrate resulting in fluorescence in cells where protein–protein interaction had occurred. In the experiment, all three cell types were simultaneously exposed to the same conditions such as a growth medium, various washings, and exposure to the substrate. This protocol offers a significant advantage over bulk cell studies in which each individual strain is grown in a separate culture vessel or microtiter plate well because it is possible that different strains would be exposed to slightly different conditions.
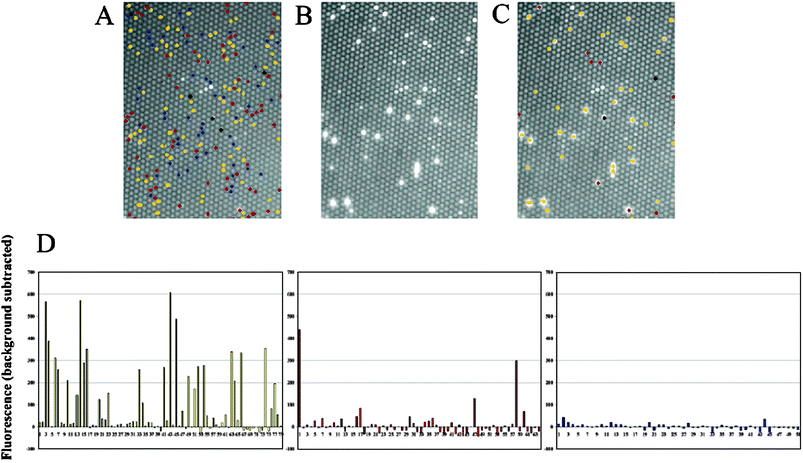 | ||
| Fig. 10 Multiplexed gene expression measurement from different yeast two-hybrid strains. Three strains, wild-type strain (xy222-1A), positive two-hybrid control strain, and negative two-hybrid control strain, were encoded with ConA-Alexa Fluor 350, ConA-Texas Red, and ConA-Alexa Fluor 660, respectively. (A) The decoded signals are overlaid on the fluorescence image of the yeast array before it was incubated with the substrate. The distribution of wild-type (blue), positive (yellow), and negative (red) control strains are shown. (B) Fluorescence signals from β-galactosidase-expressing cells after incubating in substrate. (C) Encoding signals overlaid on signal producing cells. (D) Individual responses for positive (yellow), negative (red), and wild-type (blue) cells.19 Reprinted by permission of American Chemical Society. | ||
By observing which cells expressed β-galactosidase, it was possible to quantify cell-to-cell differences (Fig. 10). The wild-type cells were found to contain no β-galactosidase, as expected. These cells expressed only background fluorescence levels. The positive cells, which had been engineered with two interacting proteins, showed a wide diversity of response with some cells giving a high fluorescence signal while others had only background levels similar to the wild-type cells. By looking at the individual cells, one could observe a distribution of responses rather than just measuring an average, relatively high fluorescence signal. Even more interesting were the negative controls in which only a few cells expressed fluorescence but at levels that were comparable to the positive cells. With so few cells expressing fluorescence signals, the average response of all the cells in a bulk experiment would have been virtually indistinguishable from the background levels. By looking at individual cells however, it was possible to observe very high responses from a few outliers. Yeast two-hybrid experiments are notorious for their high numbers of false positives and false negatives. By observing single cells, it is possible to quantify the underlying distribution. Subsequent experiments performed in our laboratory allowed us to determine the best conditions to minimize such false positives and false negatives.20 This study demonstrates the power of observing single cells rather than the ensemble responses from large cell populations.
4. Fundamental studies
4.1 Single molecules
A new direction for fibre optic microarrays is in the area of single molecule detection. In our initial proof of concept experiment, we demonstrated that we could use the microwells as reaction vessels for confining single enzyme molecules.21 The volume of liquid in a microwell with a diameter of a few microns and a depth of a few microns is on the order of several tens of femtolitres. A hundred molecules of a fluorescent dye confined in such a small volume would be in the nanomolar range—a trivial concentration to detect using conventional instrumentation. We reasoned that by confining a single enzyme molecule in a microwell along with a fluorogenic substrate, it should be possible to detect the presence or absence of that enzyme molecule by observing the fluorescent product resulting from enzymatic catalysis.It is important to trap only a single enzyme molecule in each microwell. Single molecule trapping is accomplished by ensuring that only a few wells are occupied in an array of many unoccupied wells. One can use the Poisson equation to determine the relative numbers of occupied to unoccupied wells at a given concentration. By ensuring that this ratio is less than 1 : 10, the number of multiply occupied wells is small. To demonstrate the feasibility of this approach, we prepared solutions containing β-galactosidase at concentrations in the range determined by the Poisson equation that would lead to singly-occupied microwells. An etched optical fibre microarray was mounted on a microscope as shown in Fig. 11. The microscope stage held a microscope slide onto which a thin layer of PDMS had been cast. A droplet of a fluorogenic substrate solution containing a dilute concentration of enzyme was placed on top of the PDMS layer. The enzyme concentration was so low that the bulk solution would not become fluorescent for a long period of time. The microscope stage was then raised so that the microwell array was immersed in the droplet and each microwell filled with liquid via capillary forces. The stage was raised until the array was in contact with the PDMS layer and then additional pressure was applied to effect sealing of the microwells. In this manner, the enzyme–substrate solution was partitioned into 50![[thin space (1/6-em)]](https://www.rsc.org/images/entities/char_2009.gif) 000 individual femtolitre volume wells. The enzymatic reaction was allowed to proceed for approximately 10 minutes during which time each enzyme molecule converted substrate into many thousands of molecules of fluorescent product. When the array was interrogated, only wells that contained an enzyme should have been fluorescent. The results agreed remarkably well with the Poisson equation prediction. The number of single enzyme molecules could be counted easily by simply looking at the fluorescent wells. Using this approach, it was possible to perform a digital readout of the enzyme concentration in the bulk solution.21
000 individual femtolitre volume wells. The enzymatic reaction was allowed to proceed for approximately 10 minutes during which time each enzyme molecule converted substrate into many thousands of molecules of fluorescent product. When the array was interrogated, only wells that contained an enzyme should have been fluorescent. The results agreed remarkably well with the Poisson equation prediction. The number of single enzyme molecules could be counted easily by simply looking at the fluorescent wells. Using this approach, it was possible to perform a digital readout of the enzyme concentration in the bulk solution.21
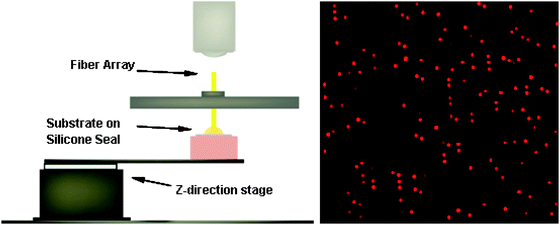 | ||
Fig. 11 Single molecule assays using the microscope–mechanical platform system. Left—A 2 mm hexagonally packed optical fibre bundle with 50![[thin space (1/6-em)]](https://www.rsc.org/images/entities/char_2009.gif) 000 individual 40 fL reaction chambers on the distal surface is fastened to the microscope stage. A solution containing RGP and a low concentration of β-galactosidase (typically 1.0 pM) is deposited onto a cleaned silicone gasket. Using precision z-direction and tilt stages, the solution is brought into contact with the reaction chambers of the fibre array. After a short time (<1 min) the silicone gasket is moved into position, sealing off each femtolitre reaction chamber. Right—fluorescence image of sealed wells containing single enzyme molecules. Red circles are wells containing single molecules of β-galactosidase. Thousands of molecules of the resorufin product can be easily observed in the wells with an enzyme molecule.21 Reprinted by permission of American Chemical Society. 000 individual 40 fL reaction chambers on the distal surface is fastened to the microscope stage. A solution containing RGP and a low concentration of β-galactosidase (typically 1.0 pM) is deposited onto a cleaned silicone gasket. Using precision z-direction and tilt stages, the solution is brought into contact with the reaction chambers of the fibre array. After a short time (<1 min) the silicone gasket is moved into position, sealing off each femtolitre reaction chamber. Right—fluorescence image of sealed wells containing single enzyme molecules. Red circles are wells containing single molecules of β-galactosidase. Thousands of molecules of the resorufin product can be easily observed in the wells with an enzyme molecule.21 Reprinted by permission of American Chemical Society. | ||
Once we demonstrated our ability to detect single enzyme molecules, we employed the approach for fundamental studies.22 In the first study, an identical experiment to the one just described was conducted except that individual enzyme molecules were monitored continuously rather than just taking an image at the reaction endpoint. By observing the kinetics of hundreds of individual enzyme molecules simultaneously, we observed a large degree of heterogeneity between the activities of single enzyme molecules. While the average activity of all the individual enzyme molecules correlated well with bulk measurements, the difference between the most active β-galactosidase molecule and the least active molecule was approximately eightfold. We speculate that this wide range is due to conformational differences between the folded forms of different enzyme molecules. β-Galactosidase is an extremely large protein (450 kDa) and it is perhaps not surprising that such large differences in activity would be observed. The microwell array enables hundreds to thousands of individual enzyme molecules to be observed in a single experiment making it a high throughput platform for such studies.
An added twist to this experiment was to include a competitive inhibitor in the substrate solution.23 This experiment was performed in two ways. First, a steady-state experiment was conducted in which the enzyme was pre-incubated with inhibitor in a concentration that was much higher than the inhibition constant (Ki). At these concentrations, inhibitor occupied all the active sites of the enzyme. Next, the enzyme–inhibitor solution was diluted by adding it to a substrate solution. The solution was diluted nearly 1000-fold, thereby reducing the inhibitor concentration well below the Ki. A droplet of the diluted enzyme solution was then placed on a microscope slide as before and the femtolitre wells were sealed. Under these conditions, the inhibitor molecule is able to dissociate from the enzyme active site and restore enzymatic activity. In the experiment, it was observed that dark wells would suddenly increase their fluorescence in a stochastic manner, indicating release of inhibitor from the enzyme active site. By plotting the number of such events as a function of time, it was possible to calculate a first order rate constant corresponding to the off rate of inhibitor from the active site. The calculated value was identical to the literature value obtained from bulk measurements, indicating the power of the single molecule technique.
In a second experiment, the same pre-incubation was performed, but this time the inhibited enzyme was diluted into substrate solution such that the inhibitor concentration was equal to Ki. Under these conditions, upon sealing in the microwells, there is enough inhibitor to competitively bind with the substrate at the active site. After sealing the microwells containing the enzyme–inhibitor–substrate solution, blinking was observed indicating that the inhibitor was binding and unbinding from the active site and causing the enzyme to be either inhibited or active, respectively. While it is beyond the scope of this review due to the detailed analysis required, it is important to note that by analyzing the data, it was possible to gain insight into the mechanism of inhibition. These results underscore the utility of the platform for performing fundamental single enzyme molecule experiments using a relatively simple experimental setup.
In an application of the single molecule approach, we have developed a method for performing digital concentration determinations using binding assays.24,25 In this approach, the etched microwell array is functionalized with a binding agent. In one concept, the array was functionalized with a DNA probe. It is important to note that unlike the bead arrays described above, in this case the entire microarray was functionalized with the same molecule. Each microwell contained several hundred thousand probe molecules on its surface. The array was exposed to a low concentration (pM) of a biotinylated complementary target DNA, followed by incubation with streptavidin-labelled β-galactosidase. After extensive washing, the wells were sealed with substrate and the enzyme-labelled DNA catalyzed the production of fluorescent product only in wells where a single molecule of DNA had bound. By counting the number of fluorescent wells relative to dark wells, it was possible to quantify the concentration of complementary DNA in the original solution.
5. Imaging and sensing
Another approach to using the optical arrays involves combined imaging and sensing. In this approach, the entire surface of the optical fibre array is coated with a thin polymer layer containing an indicator. The layer is thin enough to enable white light to illuminate an object and to collect its image through the optical fibre. In this manner, one can both observe a sample and collect chemical information with spatial resolution equal to the size of the optical fibres comprising the array.5.1 Corrosion
In one application of the technique, we investigated the localized corrosion of an aluminium–copper couple.26 The optical imaging fibre was used to visualize remote corrosion sites, map the topography of the metal surface, and measure local chemical concentrations of H+, OH−, and Al3+. The first method employed a pH-sensitive imaging fibre, in which the fluorescent dye SNAFL was covalently attached to the fibre’s distal end. Fluorescence images were acquired at different areas of the galvanic couple as a function of time (Fig. 12).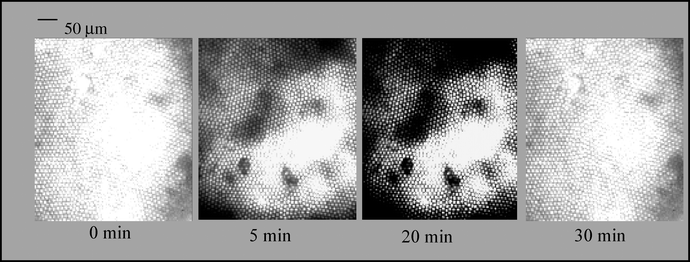 | ||
| Fig. 12 Change of fluorescence intensity with time monitored with an imaging fibre modified with SNAFL-SE over one region of an aluminium surface. The dark spots indicate active regions of corrosion resulting in a drop in pH.26 Reprinted by permission of American Chemical Society. | ||
The fluorescent dye morin, an Al3+ sensitive indicator, could also be immobilized on the fibre optic imaging sensor. This layer allowed the in situ localization of corrosion processes on pure aluminium to be visualized over time by monitoring the release of Al3+.
5.2 Biological imaging and sensing
In more biological applications, the same type of pH sensing layer was used to measure the acidification wave that occurs upon fertilization of a sea urchin egg.27 Spatially-resolved images showed that the wave occurs from the same side of the egg where the sperm was introduced. In a more complicated scheme, imaging fibres were covered with a glutamate-sensitive layer. Glutamate is the predominant excitatory transmitter in vertebrate brains and is also an important signaling molecule. In an attempt to determine if glutamate release was present in insects, we attempted to use the imaging fibres to observe L-glutamate release and re-uptake from the foregut plexus of Manduca sexta—the tobacco hornworm.28 The glutamate-sensitive layer contained glutamate oxidase and the pH-sensitive fluorescent dye SNAFL co-immobilized in a cross-linked polyacrylamide later spin coated on the distal end of the fibre array. Deamination of L-glutamate by glutamate oxidase causes a localized pH change which is detected by the pH-sensitive dye. By measuring the change in fluorescence upon stimulation, we were able to confirm that glutamate was released and that it serves as the neurotransmitter on the foregut of M. sexta.6. Hybrid arrays
Optical fibre arrays can clearly address a significant number of interesting and important analytical problems. Electrochemical sensors employ another transduction mechanism that offers additional capabilities not accessible via optical transduction. By combining both optical and electrochemical transduction mechanisms into a hybrid sensor array, it should be possible to access information that cannot be obtained by either sensing mechanism alone. In addition, by including two different transduction mechanisms into a single array, superior selectivity can be achieved. We have developed a number of strategies for preparing hybrid sensors. In one format,29 an array of 600 optical fibres was cleaned and then immersed into a solution of SnCl2 to deposit Sn2+ ions onto the glass fibre surface. The fibres were then dipped into an aqueous ammoniacal solution of AgNO3 resulting in the deposition of silver nanoparticles on the fibres while oxidizing the surface-bound Sn2+ to Sn4+. The silver coated fibres were then immersed in an aqueous solution of Na3Au(SO3)2 and formaldehyde. The silver particles oxidize formaldehyde catalytically and reduce and deposit elemental gold on the fibre surface. A self-assembled monolayer was deposited on the surface of the gold-coated fibres by immersing the fibres into 10 mM 11-mercapto-1-undecanol solution. The fibre was coated with an epoxy polymer and then the distal ends were polished to provide an array of ring-shaped microelectrodes. The array was used to perform electrochemiluminescence (ECL) experiments in which an electrical potential was applied to the electrodes and the luminescent signal was collected through the fibres. In a more recent approach, an imaging fibre array was prepared containing hollow capillaries in the centre of each fibre core.30 The capillaries could be filled with gold such that each fibre had a gold wire in its centre. In this manner, arrays could be prepared containing both optical and electrochemical transducers. In a practical application of this approach, a bead array was prepared in which ECL was used for multiplexed detection.317. Conclusions
Optical fibre microarrays are a flexible platform for performing a variety of measurements. They can be used for multiplexed analysis of samples, for studying single cell responses, for observing single molecules, and for simultaneous imaging and sensing. Applications include broad-based vapour sensing, DNA detection, corrosion monitoring, and chemical release detection from single cells to name a few. By combining electrochemical and optical capabilities in a single array platform, additional selectivity can be designed into the system. The flexibility (both physical and conceptual) of optical fibre microarrays, combined with their high density, make them a powerful platform for many applications.References
- C. N. LaFratta and D. R. Walt, Chem. Rev., 2008, 108, 614–637 CrossRef CAS.
- (a) S. M. Barnard and D. R. Walt, Nature, 1991, 353, 338–340 CrossRef; (b) B. G. Healey, S. E. Foran and D. R. Walt, Science, 1995, 269, 1078–1080 CrossRef CAS.
- P. Pantano and D. R. Walt, Chem. Mater., 1996, 8, 2832–2835 CrossRef CAS.
- K. L. Michael, L. C. Taylor, S. L. Schultz and D. R. Walt, Anal. Chem., 1998, 70, 1242–1248 CrossRef CAS.
- T. A. Dickinson, K. L. Michael, J. S. Kauer and D. R. Walt, Anal. Chem., 1999, 71(11), 2192–2198 CrossRef CAS.
- J. Tam and D. R. Walt, Biosens. Bioelectron., 2009, 24, 2488–2493 CrossRef CAS.
- F. J. Steemers, J. A. Ferguson and D. R. Walt, Nat. Biotechnol., 2000, 18, 91–94 CrossRef CAS.
- J. Ferguson, F. J. Steemers and D. R. Walt, Anal. Chem., 2000, 72, 5618–5624 CrossRef CAS.
- J. Epstein, M. Lee and D. R. Walt, Anal. Chem., 2002, 74, 1836–1840 CrossRef CAS.
- J. Epstein, A. Leung, K. Lee and D. R. Walt, Biosens. Bioelectron., 2003, 18, 541–546 CrossRef CAS.
- J. Epstein, J. Ferguson, K. Lee and D. R. Walt, J. Am. Chem. Soc., 2003, 125, 13753–13759 CrossRef CAS.
- S. Ahn and D. R. Walt, Anal. Chem., 2005, 77, 5041–5047 CrossRef CAS.
- L. Song, S. Ahn and D. R. Walt, Emerging Infect. Dis., 2005, 11, 1629–1632 Search PubMed.
- L. Song and D. R. Walt, Anal. Chem., 2006, 78, 1023–1033 CrossRef CAS.
- T. M. Blicharz, W. L. Siqueira, E. J. Helmerhorst, F. G. Oppenheim, P. J. Wexler, F. F. Little and D. R. Walt, Anal. Chem., 2009, 81, 2106–2114 CrossRef CAS.
- K. J. Albert, N. S. Lewis, C. L. Schauer, G. A. Sotzing, S. E. Stitzel, T. P. Vaid and D. R. Walt, Chem. Rev., 2000, 100, 2595–2626 CrossRef CAS.
- K. J. Albert, D. S. Gill, T. C. Pearce and D. R. Walt, Anal. Chem., 2001, 73, 2501–2508 CrossRef CAS.
- S. E. Stitzel, L. J. Cowen, K. J. Albert and D. R. Walt, Anal. Chem., 2001, 73, 5266–5271 CrossRef CAS.
- I. Biran and D. R. Walt, Anal. Chem., 2002, 74, 3046–3054 CrossRef CAS.
- R. D. Whitaker and D. R. Walt, Anal. Biochem., 2007, 360, 63–74 CrossRef.
- D. M. Rissin and D. R. Walt, Nano Lett., 2006, 6, 520–523 CrossRef CAS.
- D. M. Rissin, H. H. Gorris and D. R. Walt, J. Am. Chem. Soc., 2008, 130, 5349–5353 CrossRef CAS.
- H. H. Gorris, D. M. Rissin and D. R. Walt, Proc. Natl. Acad. Sci. U. S. A., 2007, 104, 17680–17685 CrossRef CAS.
- D. M. Rissin and D. R. Walt, J. Am. Chem. Soc., 2006, 128, 6286–6287 CrossRef CAS.
- Z. Li, R. B. Hayman and D. R. Walt, J. Am. Chem. Soc., 2008, 130, 12622–12623 CrossRef CAS.
- S. Szunerits and D. R. Walt, Anal. Chem., 2002, 74, 886–894 CrossRef CAS.
- K. L. Michael and D. R. Walt, Anal. Biochem., 1999, 273, 168–178 CrossRef CAS.
- J. Issberner, C. L. Schauer, B. A. Trimmer and D. R. Walt, J. Neurosci. Methods, 2002, 120, 1–10 CrossRef CAS.
- S. Szunerits and D. R. Walt, ChemPhysChem, 2003, 4, 186–192 CrossRef CAS.
- D. Monk and D. R. Walt, J. Am. Chem. Soc., 2004, 126, 11416–11417 CrossRef CAS.
- F. Deiss, C. N. LaFratta, M. Symer, T. M. Blicharz, N. Sojic and D. R. Walt, J. Am. Chem. Soc., 2009, 131, 6088–6089 CrossRef CAS.
- K. L. Gunderson, S. Kruglyak, M. S. Graige, F. Garcia, B. G. Kermani, C. Zhao, D. Che, T. Dickinson, E. Wickham, J. Bierle, D. Doucet, M. Milewski, R. Yang, C. Siegmund, J. Haas, L. Zhou, A. Oliphant, J. Fan, S. Barnard and M. S. Chee, Genome Res., 2004, 14, 870–877 CrossRef CAS.
- J.-B. Fan, A. Oliphant, R. Shen, B. G. Kermani, F. Garcia, K. L. Gunderson, M. Hansen, F. Steemers, S. L. Butler, P. Deloukas, L. Galver, S. Hunt, C. McBride, M. Bibikova, T. Rubano, J. Chen, E. Wickham, D. Doucet, W. Chang, D. Campbell, B. Zhang, S. Kruglyak, D. Bentley, J. Haas, P. Rigault, L. Zhou, J. Stuelpnagel and M. S. Chee, Cold Spring Harbor Symp. Quant. Biol., 2003, 68, 69–78 CrossRef CAS.
| This journal is © The Royal Society of Chemistry 2010 |
