Effect of annealing on the electronic structure of poly(3-hexylthiophene) thin film
Kaname
Kanai
*a,
Takahiro
Miyazaki
b,
Hiroyuki
Suzuki
b,
Mina
Inaba
b,
Yukio
Ouchi
b and
Kazuhiko
Seki
b
aResearch Core for Interdisciplinary Sciences, Okayama University, 3-1-1 Tsushima-naka, Okayama 700-8530, Japan. E-mail: kaname@cc.okayama-u.ac.jp; Fax: +81 (0)86![[thin space (1/6-em)]](https://www.rsc.org/images/entities/char_2009.gif) 2518705
2518705
bGraduate School of Science, Nagoya University, Furo-cho, Chikusa-ku, Nagoya 464-8602, Japan
First published on 10th November 2009
Abstract
The electronic structure and film structure of poly(3-hexylthiophene) (P3HT) have been studied by X-ray diffraction (XRD) measurements, ultraviolet-visible (UV-vis) absorption spectroscopy, near-edge X-ray absorption fine structure (NEXAFS) measurements, ultraviolet photoemission spectroscopy (UPS) and inverse photoemission spectroscopy (IPES). As reported in previous works, XRD results show that the crystallinity of the film with regioregular P3HT is significantly improved by annealing at 170 °C. The effects of annealing on the electronic structure strongly depend on the substrate and the degree of regioregularity of the P3HT polymer backbone. Even in the case of the regiorandom sample, annealing considerably changes the vacuum level energy, which is the result of changes in the conformation of the hexyl groups at the free surface of the film. The π- and π*-band onsets uniformly shift downward by the annealing resulting in an increased hole-injection barrier at the electrode interface. The effects of annealing on the electronic structure of regioregular samples are more complex and depend on multiple factors. It is necessary to take into account variations in the π- and π*-band widths and the polarization energy to determine the effects of annealing. The former is associated with the conformation of the backbones of the polymer chains, and the latter is associated with the packing density of the conjugated polymer planes. The combination of these variations determines the effects of annealing on the electronic structure of the regioregular film. This is a possible reason for the strong dependence of the effects of annealing on the surface roughness of the substrate, since substrate roughness has a considerable effect on the morphology and crystallinity of regioregular P3HT films.
Introduction
A series of conjugated polymers, poly(3-alkylthiophene)s (P3ATs), is widely used as a hole-transporting material in organic field-effect transistors (OFETs) and organic photovoltaic cells.1–6 The mobilities of OFETs with poly(3-hexylthiophene) (P3HT; Fig. 1) have now reached 0.1 cm2 V−1 s−1,1–3 which is comparable to that of amorphous-silicon-based FETs. These mobilities are much higher than that of the first OFET with non-substituted polythiophene.7 This dramatic improvement in hole mobility has been attributed to the high degree of intrachain and interchain order in the P3AT films. The structure of P3HT films as deduced by X-ray analysis is composed of polycrystalline domains embedded in an amorphous matrix.8,9 In the polycrystalline domain, P3HT stacks in one-dimensional chains and forms a lamellar structure consisting of two-dimensional conjugated sheets through interchain stacking. The degree of structural order in P3AT film strongly depends on the degree of regioregularity of the polythiophene backbone.10 It is thought that the conformation and packing of the polymer backbone plays a dominant role in determining the transport properties of the material. OFETs with highly regioregular P3HT have high mobility of 0.1 cm2 V−1 s−1,1 while OFETs with regiorandom P3HT have mobility in the range of only 10−5 to 10−4 cm2 V−1 s−1.11 The high mobility of regioregular P3HT films is partly attributable to the highly ordered structure of the film.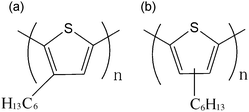 | ||
| Fig. 1 Molecular structures of regioregular P3HT (a) and regiorandom P3HT (b). | ||
Kline et al. have reported a clear correlation between the mobilities of regioregular P3HT and its molecular weight.12 The mobility increases as the molecular weight increases. Variations in molecular weight are also accompanied by significant changes in film morphology. Although lower-molecular-weight P3HT films have a higher degree of crystallinity, they have significantly lower mobility. Kline et al. proposed that this is due to the lower-molecular-weight P3HT films having more well-defined grain boundaries that limit the mobility in transistors. Similar trends in mobility have been reported for OFETs composed of oligothiophene polycrystalline films.13 The difference in morphology rather than the difference in crystallinity is the more critical parameter affecting the transport properties of regioregular P3HT films.
The morphology of the regioregular P3HT polycrystalline film changes considerably upon annealing. The characteristics of OFETs with P3HT films are also affected by annealing, namely, the mobility is dramatically improved.14,15 The increase in mobility due to annealing is accompanied by an increased structural order as observed by atomic force microscopy and X-ray analysis.14 This result is in contrast to the interpretation by Kline et al. that grain boundaries are the major cause of low mobility in low-molecular-weight P3HT films since the annealed films have high crystallinity. Zen et al. have suggested that the main cause of the low mobility of the low-molecular-weight P3HT films is the disordered conformation of the backbones of a majority of the polymer chains, which hinders interchain charge transport as a result of fewer interchain contacts.14 Alternatively, polymer chains of higher-molecular-weight P3HT possibly have more extensive π-conjugation, which would provide more opportunities for charge carriers travelling along the polymer chain to hop to a neighboring polymer through an interchain contact.
To date, the variations in the transport properties of P3HT films caused by annealing have been discussed only in terms of structural changes. However, the effects of annealing on the electronic structure remain an open question. The conformation of the regioregular polymer chain is assumed to change after annealing at high temperatures, making the polymer chain planar and increasing the degree of interchain π-stacking. The intrachain order increases the π-conjugation length in the regioregular P3HT polymer and reduces its energy gap. Moreover, the enhanced interchain π-stacking promotes wider π- and π*-band dispersions, improving interchain charge transport. This situation is likely to be favorable for charge transport inside the polymer film and result in the increase of mobility. Furthermore, the changes in the π- and π*-band energies directly affect the carrier injection properties at the electrode interfaces. Therefore, to optimize the process for the preparation of P3AT films in order to obtain high field-effect mobility, it is highly worthwhile to investigate the effects of annealing on the electronic structure of the films. In addition, this will provide insights into the transport mechanism in the P3AT films.
In this work, the effects of annealing on the electronic structure of P3HT films were investigated by using ultraviolet photoemission spectroscopy (UPS) and inverse photoemission spectroscopy (IPES). We focused on the changes induced in the electronic structure of the P3HT films upon annealing. It was found that annealing strongly influences the energy gap and the vacuum level energy and π- and π*-band energies. Consequently, the carrier injection barriers at the interfaces between the polymer film and the electrodes are significantly altered. In addition, it was revealed that the effects of annealing differ considerably according to the substrate.
Experimental
Regioregular (Fig. 1(a); >95% head-to-tail) and regiorandom P3HT (Fig. 1(b); 50% head-to-tail/50% head-to-head) were purchased from Aldrich Chemical Co. The average molecular weights (Mn) of the regioregular P3HT used in this study are 17400–35000. The purity of the regioregular P3HT was 99.995%. The samples were used without further purification. P3HT was spin-coated onto indium tin oxide (ITO) glass and naturally oxidized Si(111) substrates (about 100 nm of ITO thickness) under a dry nitrogen atmosphere inside a glove box at ambient pressure. Before the fabrication of the polymer films, the Si and ITO substrates were cleaned in an ultrasonic bath for 10 min in acetone and 10 min in isopropanol. The samples were then cleaned by UV–ozone treatment for 10 min. First, P3HT was spin-coated from a 0.1 wt% solution in chloroform at 500 rpm for 3 s, then 3500 rpm for 40 s. The film thicknesses of the prepared regioregular and regiorandom P3HT films measured by grazing incidence X-ray reflectometry (GIXR) were approximately 18 and 17 nm, respectively. Annealing was performed at 100 or 170 °C for 1 h in the glove box. The annealed films were cooled to room temperature before analysis. The prepared P3HT films were immediately transported in a dry nitrogen atmosphere and introduced into the ultrahigh vacuum for measurements of UPS, IPES and X-ray photoemission spectroscopy (XPS) (base pressure less than 1 × 10⁻⁷ Pa) without exposure to air. X-Ray diffraction (XRD) measurements and ultraviolet-visible (UV-vis) absorption spectroscopy were performed in air. The near-edge X-ray absorption fine structure (NEXAFS) measurements were performed at Beam-line 7A of the Photon Factory at the High Energy Accelerator Research Organization (KEK-PF) in Tsukuba, Japan. The estimated degree of linear polarization of the soft X-rays in beam-line 7A was P = 0.90. The spectra were obtained at the C 1s region in a partial electron yield (PEY) mode.
The molecular orbital (MO) calculations were performed based on density functional theory (DFT) using the GAUSSIAN03 package with the B3LYP/6-31G(d,p) basis set.
Results and discussion
First, the relation between the crystallinity of P3HT films on a substrate and annealing temperature is discussed. The X-ray diffraction measurement (XRD) data for the regiorandom and regioregular P3HT films on Si substrates and the regioregular P3HT films on an indium tin oxide (ITO) substrate are shown in Fig. 2(a), (b) and (c), respectively. There are no peaks in the XRD spectra of the regiorandom samples, indicating disordered structures. The spectra of the regioregular samples on the Si substrate in Fig. 2(b) have (100) Bragg peaks of the first order at 2θ = 5.3°; these peaks are indicative of a stacked structure with an out-of-plane spacing of the polymer chain layers of 1.6 nm as depicted in Fig. 2(d). The spectra of the non-annealed samples have broad (100) peaks indicating the self-assembly of the P3HT film from the chloroform solution. In addition, hydrophobic interactions between the hexyl group of P3HT and the Si substrate surface results in an “edge-on” structure of the polymer chain. Higher-order peaks were not observed due to the thickness (17 nm) of the P3HT films used in the measurements. This thickness corresponds to several polymer chain layers and is too thin to obtain high intensities of the higher-order peaks. The well-resolved (100) peak was observed after annealing, indicating that the crystalline order in the layers increased. At the same time, narrowing of the (100) peak width occurs upon annealing. This indicates an increase in the crystal size perpendicular to the substrate. Weak (100) peaks have been reported even in annealed P3HT films prepared from chloroform solution.1 The strong peaks observed in Fig. 2(b) are most likely due to the thinness of the film and the flat surface of the Si substrate. These results indicate that the P3HT layer directly on the Si-oxide substrate in the OFET is highly crystalline. Fig. 2(c) shows the spectra of the regioregular samples on ITO substrates. The non-annealed sample and the sample annealed at 100 °C exhibit weak shoulders at around 2θ = 5.3°. This is in contrast to the regioregular sample on the Si substrate. As shown in Fig. 2(b), even the spectrum of the non-annealed sample on the Si substrate shows the (100) peak clearly. The samples in Fig. 2(c) have somewhat lower molecular weights than the samples in Fig. 2(b). The lower-molecular-weight P3HT films are generally thought to have a higher degree of crystallinity.12 However, based on a comparison of the results shown in Fig. 2(b) and (c), the lower-molecular-weight samples have a lower degree of crystallinity. Thus, the roughness of the substrate surface has a considerable effect on the crystallinity of the polymer film. The surface of the ITO substrate is very rough. The shoulder observed around 2θ = 5.3° in the spectrum of the sample annealed at 100 °C increases to a size comparable to that of the (100) Bragg peak produced by annealing at 170 °C. However, the peak intensity is still lower and its width is larger than those observed for the annealed samples on the Si substrates shown in Fig. 2(b), indicating that the P3HT films on ITO substrates have a smaller crystal size. The crystallinity of the annealed films is adversely affected by the roughness of the substrate.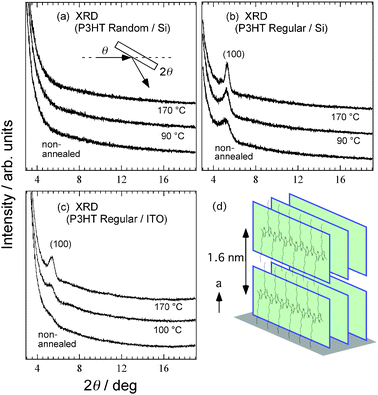 | ||
| Fig. 2 Annealing temperature dependence of XRD data for films of regiorandom P3HT (Mn = 25000–35000) on Si substrate (a), regioregular P3HT on Si substrate (b) and regioregular P3HT (Mn ∼ 17500) on ITO substrate (c). Inset in (a) represents measurement geometry. Temperature values at side of spectra are annealing temperature. (d) Schematic microcrystalline structure of regioregular P3HT film with respect to the substrate. | ||
The XPS sulfur 2p core spectra of the regiorandom and regioregular samples on the Si substrates are shown in Fig. 3(a). The spectral shapes are broad and similar to each other. The energies of the structures labeled “a”, “a′”, “b” and “b′” are 165.4, 165.0, 164.2 and 133.9 eV, respectively. The broad spectral shapes are characteristics of oligothiophene and polythiophene solid films,16,17 which are attributed to the inhomogeneous broadening of the ionization energy of the films.17 There is no clear effect of annealing on the spectra, but in the case of the regioregular sample, a small shoulder, which is denoted by an arrow, appears at a lower binding energy of 163.6 eV after annealing. The XPS spectra of the regioregular samples on the ITO substrate are shown in Fig. 3(b). Whereas only one doublet of “c” and “d” is observed in the non-annealed sample and the sample annealed at 100 °C, a doublet shifted 0.5 eV in the direction of lower binding energies appears after annealing at 170 °C. The energies of the original doublet of “c” (2p1/2) and “d” (2p3/2) are 165.2 and 164.1 eV, respectively, and those of the shifted doublet of “c′” and “d′” are 164.7 and 163.6 eV, respectively. The spectrum of the sample annealed at 170 °C is similar to those of the regiorandom and regioregular samples on Si substrates. As shown in Fig. 2(c), for the regioregular films on ITO substrates, only the film annealed at 170 °C shows a clear (100) peak in the XRD spectrum. Therefore, the broad spectral shapes of the XPS spectra must be associated with the morphology of the films. Recently, the clear morphological dependence of the ionization energy of a thiophene-based (α,ω-dihexyl-sexithiophene: DH6T) film has been reported by Duhm et al.17 They reported that the S 2p XPS spectrum of a film with a flat-lying DH6T monolayer on the substrate has only one doublet (S 2p1/2 and 2p3/2). On the other hand, the doublet shifted toward lower binding energies by 0.6 eV in thicker films of DH6T. The shifted spectra are due to the second standing layer of DH6T deposited on the first flat-lying layer. There is one origin of the changes in the XPS spectrum upon annealing that can possibly explain the results in the case of DH6T as well as the results shown in Fig. 3(b). The one doublet of “c” and “d” in the spectra of the non-annealed sample and the sample annealed at 100 °C is due to low crystallinity of the films on the ITO substrate since those films have a negligibly small (100) peak. Annealing at 170 °C partially converts the morphology of the film from a “disordered state” to an ordered state, which is accompanied by an increase in crystallinity. It should be noted that the “disordered state” here does not refer to a state like in the regiorandom sample since the XPS spectra of the regiorandom samples have broad shapes. Here, the “disordered state” denotes the state in which a majority of the polymer chain is randomly adsorbed on the ITO substrate. The XRD data in Fig. 2(d) show the structure of the film annealed at 170 °C in which the stacked molecular planes of the regioregular P3HT are perpendicular to the substrate. As the crystallinity is increased by annealing, the morphology of the regioregular film, especially the molecular orientation, changes considerably. The surface potential at the P3HT film is strongly affected by the molecular orientation at the surface, which determines the ionization energy of the film.17 The changes in molecular orientation due to annealing induce a variation in ionization energy. Therefore, the stacked P3HTs in the annealed film are expected to shift the S 2p doublet toward lower binding energies. A mixture of the disordered and ordered states in the film gives the XPS spectrum a broad shape. In this scenario, the appearance of the shoulder at 163.6 eV, which is denoted by the arrow in the XPS spectrum of the annealed regioregular sample on the Si substrate, is the result of the increased crystallinity caused by annealing.
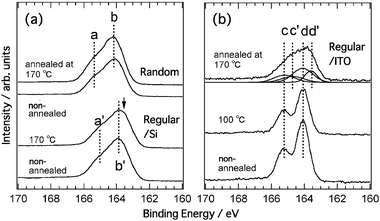 | ||
| Fig. 3 Annealing temperature dependence of XPS spectra in sulfur 2p region for regiorandom and regioregular P3HT films on Si substrates (a) and regioregular film on ITO substrate (b). The abscissa represents the biding energy with respect to EF. | ||
The ultraviolet-visible (UV-vis) absorption spectra in the π–π* transition region of the regiorandom and regioregular P3HT films on glass substrates are shown in Fig. 4(a) and (b), respectively. The spectra of the regiorandom films in Fig. 4(a) are broad and featureless. The film spectra show a minor red-shift relative to the maximum absorption of the chloroform solution spectrum. The solution spectrum of regioregular P3HT shown in Fig. 4(b) is broad and featureless, and there is a minor red-shift relative to the absorption maximum of the solution spectrum of regiorandom P3HT. The spectrum of regioregular P3HT in solution is considerably different from that in the film, and a large red-shift was observed. The shoulder structure indicated by an arrow appears at around 600 nm in the film spectrum. This pronounced change in the spectrum of the film compared to that of the solution is thought to be related to the conformational changes of the P3HT polymer.18 After annealing at 170 °C, the spectrum becomes more structured with the appearance of well-resolved vibrational structures indicated by tick marks. The polymer backbone becomes a well-ordered structure after annealing due to the formation of the larger lamellar structure, which ensures a more extended π-conjugation along the polymer chain. Consequently, the spectrum shows well-resolved structures with an enhanced shoulder structure. The less structured and broad spectra of the regiorandom films are attributed to a lack of sufficient π-conjugation and inhomogeneous broadening of the π–π* transitions due to the distribution of π-conjugation lengths in the polymer chain.19
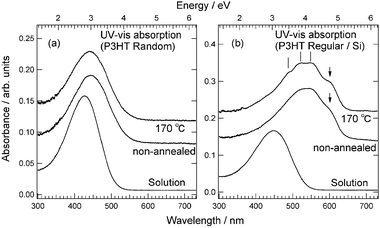 | ||
| Fig. 4 Annealing temperature dependence of UV-vis absorption spectra for solutions and films on Si substrates of regiorandom P3HT (a) and regioregular P3HT (Mn = 25000–35000) (b). Bottom spectra show the results for P3HT solutions in chloroform. Middle and top spectra show the results for non-annealed films on Si substrates and films annealed at 170 °C on Si substrates, respectively. | ||
Fig. 5 shows the near-edge X-ray absorption (NEXAFS) spectra at the carbon 1s absorption edge of the regioregular P3HT film on the Si substrate. The measurements were carried out in partial electron yield (PEY) mode for five incidence angles of photons, θ = 30, 40, 55, 70 and 90°. The inset shows the definition of θ. Measurements in PEY mode are more sensitive to surface states than those in total electron yield (TEY) mode due to the shorter probing depth of the former. The spectral features are similar for the five incidence angles except for the peak intensities. The spectral features are in reasonably good agreement with the reported spectra measured in TEY mode.20 The sharp resonances at ∼285.8 eV are caused by the transition from the C 1s core level to the unoccupied π* states that are distributed over the thiophene rings (π*-peak). Above hν of 287 eV, the peaks correspond to the transitions to the σ* states in both the thiophene rings and the hexyl groups. The orientation of the molecular plane of the thiophene rings can be determined by analyzing the polarization dependence of the π*-peak intensity. The transition moment for the 1s → π* transition is perpendicular to the thiophene ring; hence, the transition intensity is the largest when the electric vector of the light E is parallel to the axes of the atomic pz orbitals forming the π* orbital. A quantitative description of the 1s → π* transition intensity I for a sample with azimuthally random orientation is given as21
| I = A[PI∥ + (1 − P)I⊥], | (1) |
| I∥ = ⅓[1 + ½(3cos2θ − 1)(3cos2α − 1)], | (2) |
| I⊥ = ½sin2α. | (3) |
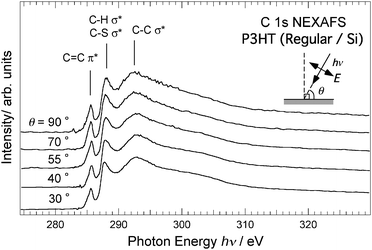 | ||
| Fig. 5 Normalized C 1s NEXAFS spectra for regioregular P3HT film on Si substrate measured by varying incident angle θ of soft X-ray irradiation. Values of θ are shown on left axis. Abscissa represents photon energy of incident soft X-rays, hν. Inset depicts definition of θ. | ||
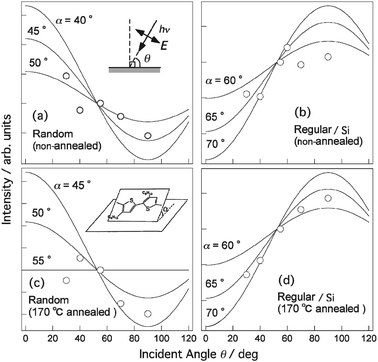 | ||
| Fig. 6 Variations of π* peak intensities as a function of θ. a, b, Regiorandom P3HT film on Si substrate (a) and regioregular P3HT film on Si substrate (b). Annealed regiorandom P3HT film on Si substrate (c) and annealed regioregular P3HT film on Si substrate (d). Annealing temperature was 170 °C. Inset in (c) depicts definition of tilt angle of molecular plane with respect to substrate surface α. | ||
Fig. 7 shows the effects of annealing on the NEXAFS spectra of the regiorandom and regioregular samples. The NEXAFS spectra were measured at normal incidence. The broad peak at ∼292 eV is caused by the transition to the C–C σ* states in the hexyl groups, thiophene rings and polymer backbone. The intensity of this peak considerably decreases upon annealing, while that of the π* peak remains almost constant. In particular, the spectra of the regiorandom sample show a more dramatic decrease. This decrease is primarily due to the conformation change of the hexyl groups at the surface. Smaller changes of the π* peak intensities indicate that the orientation of the thiophene rings is less affected by annealing. Thus, changes in the orientation of the thiophene ring and polymer backbone can be excluded as the origin of the considerable decreases observed. The inset depicts the selection rule for the transition to the C–C σ* state. The hexyl groups oriented normally toward a vacuum have a small transition moment, while hexyl groups with gauche conformation have a larger transition moment. Therefore, there is a higher concentration of the normally oriented hexyl groups at the surface of the annealed film as a result of the annealing removing the gauche conformation. In fact, it has been shown previously that annealing converts the gauche conformation in the alkyl chain to the normal conformation.22 This scenario reasonably explains the greater decrease in intensity of the peak at ∼292 eV of the regiorandom sample since regiorandom P3HT has a higher concentration of hexyl groups in the gauche conformation as a result of the smaller energy gain that results from the van der Waals interactions between the hexyl groups.
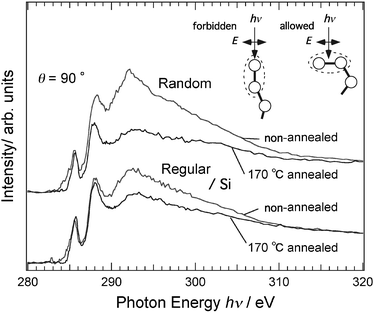 | ||
| Fig. 7 Normalized C 1s NEXAFS spectra for regiorandom and regioregular P3HT films on Si substrates measured at normal incidence. Comparisons between a non-annealed sample and a sample annealed at 170 °C are shown. Inset depicts the selection rule for the absorption process at C 1s → σ*(C–C) transition in the hexyl groups of P3HT. | ||
Fig. 8 shows the combined UPS and IPES spectra of the regiorandom and regioregular P3HT films on Si substrates. UPS and IPES spectra provide information on the occupied and unoccupied electron density of states, respectively, if we assume there is no electron correlation effect on the spectra. The vacuum level (dotted lines labeled VL in the figure) energies Evac were determined from the energies of the secondary electron onsets of the UPS spectra. The energies of the π- and π*-band onsets relative to the VL correspond to adiabatic ionization energy I and electron affinity EA, respectively. The relative energies of the π- and π*-band onsets to the Fermi level (EF) of a given electrode correspond to the hole-injection barrier and electron-injection barrier heights of the polymer film, respectively. The energy difference between the π- and π*-band onsets directly provides a value of the transport gap Eg. Eg is defined as the energy difference between a negative polaron and a positive polaron, separated in space and uncorrelated, traveling through the polymer chain. For all the spectra of the P3HT films in Fig. 8, the π-band onsets are nearer to EF than the π*-band onsets. These small hole-injection barriers result in the hole-transporting properties of P3HT films. Fig. 8(a) shows the spectra of the non-annealed and annealed regiorandom samples. There are peaks at 1–2 eV in the UPS spectra, which are attributable to the π-bands. On the other hand, the IPES spectra are broad and featureless. It was found that the energies of the UPS and IPES spectra were uniformly shifted to lower binding energies by 0.3 eV after annealing. The VL was also 0.4 eV lower. The spectra of the regioregular samples are shown in Fig. 8(b). Annealing has a relatively small effect on the π- and π*-band onset positions. On the other hand, in contrast to the regiorandom sample, the VL became higher after annealing. In addition, annealing slightly increased the spectral intensity of the π*-band, as indicated in the figure by an arrow. It is easier to distinguish this variation in the high-resolution IPES spectra. Fig. 9 shows the combined UPS and high-resolution IPES spectra of the regioregular P3HT films on ITO substrates. The π-band onset in the non-annealed sample is very close to EF and shifts to higher binding energies after annealing, while the VL position and the π*-band onset are less affected. The high-resolution IPES spectra of the annealed films are more structured with the appearance of shoulders, denoted in the figure by arrows. In addition, the UPS spectra at the onset of the π-band became more structured after annealing. Simulated spectra derived from molecular orbital (MO) calculations based on density functional theory (DFT) are shown in Fig. 9. The MO calculations were performed using a hexylthiophene oligomer with ten repeating units of 3-hexylthiophene rings (n = 10; 10HT) as a model system. Fujimoto et al. reported that the observed UPS spectra of thiophene oligomers beyond n = 6 (6T) are almost identical to that of polythiophene, indicating that these oligomers are indistinguishable from polythiophene with regard to their electronic structure.23 Therefore, 10HT is a good model system for discussing the electronic structure of P3HT. From the calculated results, the prominent peak observed at ∼3.5 eV is a nonbonding π-band. Its energy is almost independent of the number of the repeating unit, and the highest occupied and lowest unoccupied bands of 10HT, indicated by asterisks, are primarily composed of the π- and π*-orbitals distributed over the conjugated polymer chain. The simulated lowest unoccupied molecular orbital (LUMO) of 10HT is shown in Fig. 10. The simulated spectra reproduce the observed spectra well. Based on a comparison of the observed spectra with the simulated spectra, the shoulder structures indicated by arrows are assigned to the π*-band. It is clear that the π- and π*-band became larger after annealing as the π-conjugation length increases by a conformation change of the polymer chain. These results are consistent with the change in the UV-vis spectra after annealing shown in Fig. 4(b).
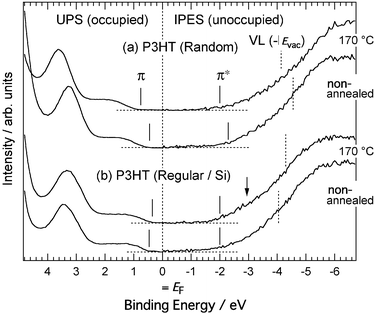 | ||
| Fig. 8 UPS and IPES spectra for films on Si substrates of regiorandom (a) and regioregular P3HT (b). Comparisons between the non-annealed and annealed samples at 170 °C are shown. The abscissa represents the binding energy with respect to EF. Vertical solid lines represent onsets of π- and π*-bands. Vertical dotted lines represent the vacuum level determined by secondary electron onsets of the UPS spectra. | ||
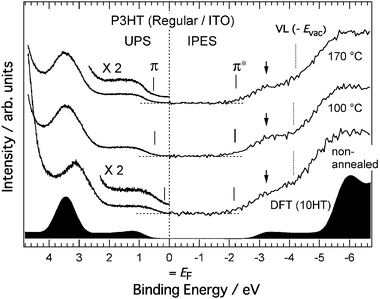 | ||
| Fig. 9 UPS and IPES spectra for regioregular P3HT film on ITO substrate. A comparison between non-annealed sample, and samples annealed at 100 and 170 °C is shown. The abscissa represents the binding energy with respect to EF. Vertical solid lines represent the onsets of π and π*-bands. Vertical dotted lines represent the vacuum level determined by secondary electron onsets of the UPS spectra. Filled spectra at bottom show simulated the spectra derived from MO calculations for 10HT based on DFT. Bands indicated by asterisks are mainly due to π- and π*-orbitals distributed over the 10HT molecule. | ||
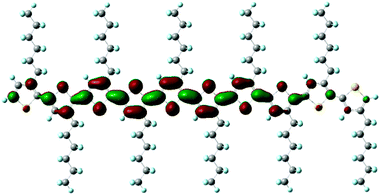 | ||
| Fig. 10 Simulated LUMO of 10HT. LUMO is distributed over the conjugated chain. Hexyl groups are not contributed to the LUMO. | ||
Energy diagrams of regiorandom and regioregular P3HT films are shown in Fig. 11; these are derived from the UPS and IPES spectra shown in Fig. 8 and 9. The parameters I, EA, Eg and Evac are summarized in Table 1. The higher energy diagrams are depicted with reference to EF of the substrate. These diagrams are suitable for discussing the variations in the VL and carrier-injection barriers. The lower energy diagrams are depicted with reference to Evac. These diagrams are suitable for discussing the variations in Eg and the π- and π*-band onset positions. Fig. 11(a) shows the results for the regiorandom samples. The VL shows a large downward shift (Δ = −0.4 eV) after annealing. One possible origin of this shift is the formation of an electric dipole layer at the outermost layer of the regiorandom P3HT film. As discussed with regard to Fig. 6, annealing considerably changes the conformation of the hexyl groups at the free surface of the regiorandom film. The hexyl groups are oriented normally toward the vacuum at the surface of the annealed regiorandom film. The ends of the hexyl groups are expected to have a slight positive charge due to the electron-donating nature of the methyl groups. Therefore, the electric dipoles directed outward are aligned at the surface to decrease the surface potential. This effect is also observed in the case of the regioregular sample, in which the hexyl group orientation is affected by annealing as shown in Fig. 7, although the effect is smaller than in the case of the regiorandom film. As a result of the VL shift, the hole-injection barrier of the regiorandom film increases after annealing. However, it should be noted that in the case of the regiorandom sample, the variations in the hole-injection barrier cannot be directly linked to the variations in the field effect mobility with certainty, since there are localized states in the tail of the π- or π*-band in the disordered systems. As can be seen from the lower energy diagram, I, EA and Eg are not affected by annealing.
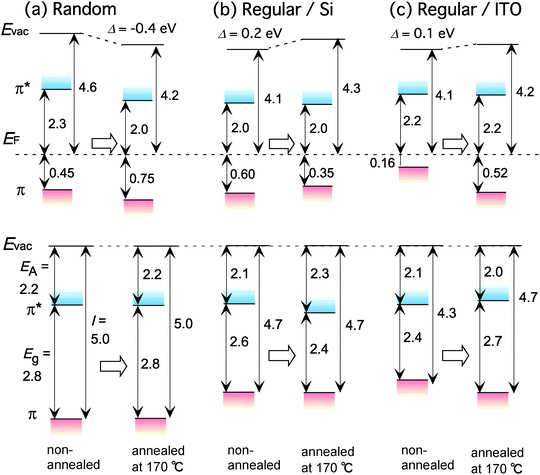 | ||
| Fig. 11 Schematic energy diagrams for non-annealed and annealed samples at 170 °C derived from UPS and IPES results. Upper and lower panels are depicted with reference to EF and Evac, respectively. Diagrams for non-annealed and annealed films on Si substrates of regiorandom (a) and regioregular P3HT (b). (c) Diagrams for non-annealed and annealed regioregular P3HT film on ITO substrate. | ||
| I/eV | E A/eV | E g/eV | E vac/eV | |
|---|---|---|---|---|
| Random (N.A.) | 5.0 | 2.2 | 2.8 | 4.6 |
| Random (170 °C) | 5.0 | 2.2 | 2.8 | 4.2 |
| Regular | ||||
| (Mn = 25000–35000)/Si (N.A.) |
4.7 | 2.1 | 2.6 | 4.1 |
| Regular | ||||
| (Mn = 25000–35000)/Si (170 °C) |
4.7 | 2.3 | 2.4 | 4.3 |
| Regular (Mn ∼ 17500)/ITO (N.A.) |
4.3 | 2.1 | 2.4 | 4.1 |
| Regular (Mn ∼ 17500)/ITO (170 °C) |
4.7 | 2.0 | 2.7 | 4.2 |
The results for the regioregular samples on Si substrates are shown in Fig. 11(b). After annealing, the VL shifts upward by 0.2 eV and the π-band onset moves toward EF by 0.25 eV. The hole-injection barrier decreases to 0.35 eV after annealing due to the downward shift of the π*-band onset. On the other hand, the π-band onset is less affected. The energy diagram indicates that annealing reduces Eg. Fig. 11(c) shows the energy diagrams for the regioregular samples on ITO substrates. The electronic structure of the regioregular sample on the ITO substrate shown in Fig. 11(c) is quite different from that of the regioregular sample on the Si substrate shown in Fig. 11(b). A remarkable difference from the electronic structure shown in Fig. 11(b) is that the π-band onset is very close to EF. It was also found that annealing has a different effect on the π-band onset position. In Fig. 11(b) the π-band onset shifts upward after annealing, while the π-band onset shifts downward in Fig. 11(c). Consequently, as shown in the lower energy diagram, annealing dramatically increases I and Eg. At first glance, the results shown in Fig. 11 seem to indicate that there is no systematic correlation between annealing and the variation in the electronic structure of the regioregular samples. The effects of annealing seem to strongly depend on the substrate of the regioregular P3HT film.
To interpret the results in Fig. 11, we focus on two effects of annealing on the electronic structure of the P3HT films. One is the change in the distribution of the π-conjugation length in the polymer chain. The π- and π*-bands of regiorandom samples have a wide distribution of the π-conjugation lengths. In fact, the UV-vis spectra of the regiorandom samples are featureless and broad as discussed with regard to Fig. 4(a); the IPES spectra shown in Fig. 8 are also featureless and broad. Similarly, the non-annealed film of the regioregular P3HT is expected to have a somewhat wide distribution of π-conjugation lengths in the polymer chain. Annealing removes the gauche conformation of the hexyl groups, makes the molecular plane planar, increases the packing density of the polymers and improves crystallinity. As a result, the π-conjugation length increases, and the distribution width of the π-conjugation length decreases. A more structured UV-vis absorption spectrum, UPS and IPES spectra of the annealed regioregular P3HT films are indicative of the narrowing of the π- and π*-bands. The other effect of annealing is the change in the polarization energy of the polymer chain. A charge carrier in the polymer chain polarizes its surroundings and forms a polaron. The polarization energy increases due to the enhancement of the interchain interactions resulting from the increased packing density of the film after annealing. This increase in the polarization energy shifts the π(π*)-band to lower (higher) binding energies. Schematics shown in Fig. 12 depict the two above mentioned effects on the electronic structure of P3HT films. Here, the important parameters are W, W′, ΔP+ and ΔP−, which determine the variation in the electronic structure of the P3HT films. W and W′ are the width of the π- and π*-bands, respectively. ΔP+ and ΔP− are the changes in the polarization energies after annealing for holes (positive polarons) and electrons (negative polarons) in the polymer chain, respectively. In general, ΔP+ and ΔP− are different from each other. Fig. 12(a) shows the development of the electronic structure from the regiorandom sample to the annealed regioregular sample with a Si substrate via the non-annealed regioregular sample. The top panel is the electronic structure of the regiorandom sample. The π- and π*-bands are depicted as normal distribution curves with full widths at half maximum of W and W′, respectively. W and W′ of the non-annealed regioregular sample (middle) are smaller than those of the regiorandom sample. This difference is due to the narrowing of the distribution width of π-conjugation lengths in regioregular P3HT as compared to that in regiorandom P3HT. On the other hand, the π- and π*-bands shift by ΔP+ and ΔP−, respectively, due to the dramatic increase in the degree of π-stacking between the polymer chains. The π(π*)-band onset positions are determined by a combination of the variations in W (W′) and ΔP+ (ΔP−). The π-band onset of the regioregular sample shifts toward lower binding energies while the π*-band onset is less affected since the decreases in W′ and ΔP− balance each other out. Annealing further decreases W and W′. Moreover, the improvement in crystallinity after annealing provides further polarization energy gains in terms of ΔP+ and ΔP−. As a result, Eg slightly decreases after annealing. The hole-injection barrier, which is defined as the energy difference between the π-band onset and EF is reduced as a result of the change in the polarization energy ΔP+. In this case, the enhancement of crystallinity improves hole-injection efficiency. On the other hand, the improvement in the conformation of the backbones of a majority of polymer chains, which decreases W and W′, has an effect on mobility as suggested by Zen et al.14 The effect of annealing on the hole-injection barrier will also increase the field effect mobility.
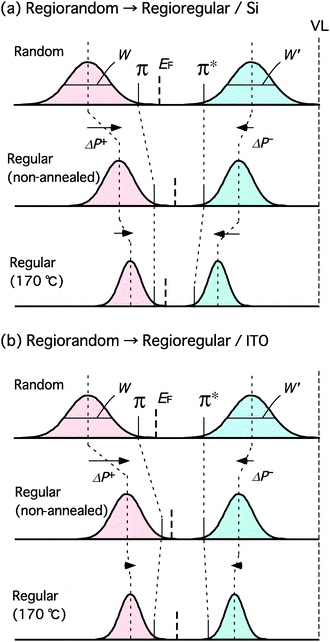 | ||
| Fig. 12 Schematics for the development of electronic structures of P3HT films. Development of the electronic structure from regiorandom P3HT film to annealed regioregular P3HT film on Si substrate via non-annealed regioregular P3HT film (a) and from regiorandom P3HT film to annealed regioregular P3HT film on ITO substrate via non-annealed regioregular P3HT film (b). W and W′ are the width of the π and π* bands, respectively. ΔP+ and ΔP− are the changes in polarization energy after annealing for holes (positive polarons) and electrons (negative polarons) in the polymer chain, respectively. | ||
Fig. 12(b) depicts the development of the electronic structure from the non-annealed regiorandom sample to the annealed regioregular sample on ITO substrates via the non-annealed regioregular sample. As in Fig. 12(a), the π-band onset shifts toward lower binding energies while the π*-band onset is less affected. Eg of the non-annealed regioregular sample on the ITO substrate is much smaller than that of the non-annealed regioregular sample on the Si substrate shown in Fig. 12(a); this is due to the remarkably low energy of the π-band onset. The XRD spectrum of the non-annealed regioregular film on the ITO substrate in Fig. 2(c) does not have a well-resolved (100) Bragg peak, which indicates that the film structure of the sample is disordered. There is a wide distribution of π- and π*-bands and W and W′ are expected to be larger than those of the regioregular sample shown in Fig. 12(a). A large W is a possible reason for the low energy of the π-band onset. After annealing at 170 °C, the XRD spectrum of the regioregular sample on the ITO substrate exhibits a well-resolved (100) peak. However, the width of the (100) peak in the XRD spectrum for the annealed regioregular sample on the ITO substrate is larger than that of the annealed regioregular sample on the Si substrate. The approximate crystal size of the annealed regioregular sample on the ITO substrate as determined by the Debye-Sherrer formula is around 75% of that of the annealed regioregular sample on the Si substrate. The π- and π*-bands become larger after annealing as discussed with regard to Fig. 9. This means that annealing decreases W and W′ and increases the intensities of the π- and π*-bands. Assuming the extra gain in polarization energy is small in the annealed regioregular sample on the ITO substrate due to its low crystallinity, the decrease in W (W′) exceeds ΔP+ (ΔP−). Consequently, the π(π*)-band onset shifts toward higher (lower) binding energies and Eg decreases after annealing.
Conclusions
We conclude that the electronic structure around the energy gap of P3HT film is highly correlated with its film structure. The effects of annealing on the electronic structure strongly depend on the substrate and the degree of regioregularity of the polymer backbone. Even in the case of the regiorandom sample, annealing considerably changes the VL, which is the result of changes in the conformation of the hexyl groups at the free surface of the film. The π- and π*-band onsets uniformly shift downward resulting in an increased hole-injection barrier at the electrode interface. The effects of annealing on the electronic structure of regioregular samples are more complex and depend on multiple factors. It is necessary to take into account variations in the π- and π*-band widths and the polarization energy to determine the effects of annealing. The former is associated with the conformation of the backbones of the polymer chains, and the latter is associated with the packing density of the conjugated polymer planes. The combination of these variations determines the effects of annealing on the electronic structure of the regioregular film. This is a possible reason for the strong dependence of the effects of annealing on the surface roughness of the substrate since substrate roughness has a considerable effect on the morphology and crystallinity of regioregular P3HT films.The information obtained in this study regarding the relationship between film structure and electronic structure, especially the critical parameters of I, EA, Eg and carrier injection barrier heights, offers insights into the transport mechanism of P3HT and other related films.
Acknowledgements
This work was supported in part by a Grant-in-Aid for Scientific Research (S) (Grant No. 19105005) from the Ministry of Education, Culture, Sports, Science and Technology of Japan (MEXT) and Special Coordination Funds for Promoting Sciences and Technology from MEXT.References
- H. Sirringhaus, N. Tessler and R. H. Friend, Science, 1998, 280, 1741 CrossRef CAS.
- H. Sirringhaus, P. J. Brown, R. H. Friend, M. M. Nielsen, K. Bechgaard, B. M. W. Langeveld-Voss, A. J. H. Spiering, R. A. Janssen, E. W. Meijer, P. Herwig and D. M. de Leeuw, Nature, 1999, 401, 685 CrossRef CAS.
- Z. Bao, A. Dodapalapur and A. J. Lovinger, Appl. Phys. Lett., 1996, 69, 4108 CrossRef CAS.
- J. Y. Kim, K. Lee, N. E. Coates, D. Moses, T.-Q. Nguyen, M. Dante and A. J. Heeger, Sience, 2007, 317, 222 Search PubMed.
- F.-C. Chen, H.-C. Tseng and C.-J. Ko, Appl. Phys. Lett., 2008, 92, 103316 CrossRef.
- M. D. Irwin, D. B. Buchholz, A. W. Hains, R. P. H. Chang and T. J. Marks, Proc. Natl. Acad. Sci. U. S. A., 2008, 105, 2783 CrossRef CAS.
- A. Tsumura, H. Koezuka and T. Ando, Appl. Phys. Lett., 1986, 49, 1210 CrossRef CAS.
- T. A. Chen, X. M. Wu and R. D. Rieke, J. Am. Chem. Soc., 1995, 117, 233 CrossRef CAS.
- S. Hugger, R. Thomann, T. Heinzel and T. Thurn-Albrecht, Colloid Polym. Sci., 2004, 282, 932 CrossRef CAS.
- C. Yang, F. P. Orfino and S. Holdcroft, Macromolecules, 1996, 29, 6510 CrossRef CAS.
- A. Tsumura, A. Fuchigami and H. Koezuka, Synth. Met., 1991, 41, 1181 CrossRef CAS.
- R. J. Kline, M. D. McGehee, E. N. Kadnikova, J. Liu and J. M. J. Fréchet, Adv. Mater., 2003, 15, 1519 CrossRef CAS.
- G. Horowitz, M. Hajlaoui and R. Hajlaoui, J. Appl. Phys., 2000, 87, 4456 CrossRef CAS.
- A. Zen, J. Pflaum, S. Hirschmann, W. Zhuang, F. Jaiser, U. Asawapirom, J. P. Rabe, U. Scherf and D. Neher, Adv. Funct. Mater., 2004, 14, 757 CrossRef CAS.
- M. S. A. Abdou, X. Lu, Z. W. Xie, F. Orfino, M. J. Deen and S. Holdcroft, Chem. Mater., 1995, 7, 631 CrossRef CAS.
- H. Y. Seung and J. E. Whitten, Synth. Met., 2000, 114, 305 CrossRef CAS.
- S. Duhm, G. Heimel, I. Salzmann, H. Glowatzki, R. L. Johnson, A. Vollmer, J. P. Rabe and N. Koch, Nat. Mater., 2008, 7, 326 CrossRef CAS.
- O. Inganäs, W. R. Salaneck, J. E. Osterholm and J. Laakso, Synth. Met., 1988, 22, 395 CrossRef CAS.
- P. J. Brown, D. S. Thomas, A. Kohler, J. S. Wilson, J.-S. Kim, C. M. Ramsdale, H. Sirringhaus and R. H. Friend, Phys. Rev. B: Condens. Matter Mater. Phys., 2003, 67, 064203 CrossRef.
- X. T. Hao, T. Hosokai, N. Mitsuo, S. Kera, K. Mase, K. K. Okudaira and N. Ueno, Appl. Phys. Lett., 2006, 89, 182113 CrossRef.
- N. Uyeda, M. Ashida and E. Suito, J. Appl. Phys., 1965, 36, 1453 CrossRef CAS.
- M. Yamamoto, Y. Sakurai, Y. Hosoi, H. Ishii, K. Kajikawa, Y. Ouchi and K. Seki, J. Phys. Chem. B, 2000, 104, 7363 CrossRef CAS.
- H. Fujimoto, U. Nagashima, H. Inokuchi, K. Seki, Y. Cao, H. Nakahara, J. Nakayama, M. Hoshino and K. Fukuda, J. Chem. Phys., 1990, 92, 4077 CrossRef CAS.
| This journal is © the Owner Societies 2010 |