Investigation of a BiB3O6 crystal growth mechanism by high-temperature Raman spectroscopy
Songming
Wan
*a,
Bing
Teng
*b,
Xia
Zhang
a,
Jinglin
You
c,
Wenping
Zhou
a,
Qingli
Zhang
a and
Shaotang
Yin
a
aAnhui Institute of Optics and Fine Mechanics, 350 Kexueyuan Road, Hefei, 230031, China. E-mail: smwan@aiofm.ac.cn; Fax: +86 0551 5591039; Tel: +86 0551 5591039
bCollege of Physics Science, Qingdao University, Qingdao, 266071, China
cSchool of Material Science and Engineering, Shanghai University, Shanghai, 200072, China
First published on 2nd September 2009
Abstract
High-temperature Raman spectroscopy has been applied to investigate the melt structure near the BiB3O6 (BIBO) crystal–melt interface. Based on the experimental results, the crystal growth mechanism was proposed. (BOØ)n (Ø = bridging oxygen atom) chains and free Bi3+ cations present in the BIBO bulk melt act as the crystal growth units. Bi-Ø bonds and [BØ4]-tetrahedra were found near the BIBO crystal–melt interface. Two neighboring oxygen atoms in a (BOØ)n chain or in two different (BOØ)n chains are connected by the Bi3+ cations to form the structural prototype of BIBO crystal. Two adjacent (BOØ)n chains are further connected to each other through the [BØ4] tetrahedra to form the BIBO crystal structure. The predicted growth habit of the BIBO crystal is consistent with the observed one based on the mechanism.
Introduction
Frequency conversion of solid-state lasers by nonlinear optical (NLO) crystals is the most effective way to obtain visible and UV lasers which have widely been used in laser medicine, optical communication and signal processing.1–3 BiB3O6 (BIBO) crystal is an excellent NLO crystal due to its exceptionally large NLO coefficients, high damage threshold and non-hygroscopic nature.4–6 Third harmonic picosecond laser (355 nm) and tunable femtosecond laser (from 375 nm to 435 nm) have been achieved by using the crystal.7,8 In the past decade, a large number of studies have been performed on BIBO crystal growth, however, problems are far from being solved in producing a highly perfect BIBO single crystal.9–11Dynamic processes near a solid–liquid interface are of key importance across broad areas of science and technology,12–16 which are also a fundamental problem of crystal growth. Crystal growth mechanism, which gives an insight into the microdynamic processes near a crystal–melt interface, can help us understand the formation of various crystal defects at a molecular level and then to develop more perfect growth techniques to improve crystal quality. Since crystal growth occurs at a crystal–melt interface, the melt structure near the interface plays a crucial role in the study of the crystal growth mechanism. However, experimental investigation on the melt structure in this region is very difficult due to the lack of a suitable high-temperature probing technique, especially in high-temperature crystal growth systems.17 The solution to this problem will greatly facilitate the fundamental research of crystal growth. In comparison with other probing techniques, high-temperature Raman spectroscopy possesses at least three features:18 (1) it can be used to study the systems at high temperature; (2) it can collect the information of the molecular structure in a tiny region; (3) it is an in situ probing technique and can be used without disturbing crystal growth process. These features make high-temperature Raman spectroscopy a promising tool for investigating crystal growth mechanism.19,20 In this paper, high-temperature Raman spectroscopy was used to study the melt structure near the BIBO crystal–melt interface for the first time. A mechanism for BIBO crystal growth was proposed to explain the crystal growth habit.
Results and discussion
BIBO crystallizes in monoclinic system, C2 space group, with cell parameters a = 7.116 Å, b = 4.993 Å, c = 6.508 Å, β = 106.5°. The unit cell consists of two formula units (Z = 2). One Bi atom and one B atom occupy the positions with C2 symmetry, and the remaining two B atoms and six O atoms occupy the positions with C1 symmetry.21 Nuclear site group analysis has demonstrated that its lattice vibrational modes Γopt = 13A + 14B, and all of the 27 vibrational modes are Raman active.22 The Raman spectrum of the BIBO crystal was recorded from 200 to 800 cm−1 at room temperature (see Fig. 1), twelve Raman peaks are observed in this range, which is consistent with the BIBO Raman spectrum reported by Egorysheva et al.23 | ||
| Fig. 1 Raman spectrum of the BIBO crystal at room temperature. | ||
Clear assignments of the BIBO crystal vibrational modes are essential for us to more deeply understand the bonding properties of the BIBO crystal. Usually, the displacements of the Bi atoms are negligible in these assignments since the Bi atom is much heavier than boron and oxygen atoms. the Raman vibrational modes are empirically assigned with reference to the corresponding vibrational modes of BO3 triangle and BO4 tetrahedron reported in other borate crystals or glasses.22–24 Detailed assignments of the BIBO crystal vibrational modes have been offered by Hu et al. The strongest peak located at 576 cm−1 is important for the following discussion on the BIBO crystal growth mechanism, it has been assigned to the symmetric stretching vibration of [BØ4] tetrahedron (Ø = bridging oxygen atom).22
The high-temperature Raman spectra of the BIBO crystal were recorded at 200, 400 and 600 °C, as shown in Fig. 2. With increasing temperature, all of the peaks broaden and decrease in frequency, two adjacent peaks overlap each other, which is ascribed to the wider distribution of the bond angles and the increase in interatomic distances in the BIBO crystal structure when the crystal is heated.25
 | ||
| Fig. 2 Raman spectra of the BIBO crystal at different temperatures: (a) 200 °C, (b) 400 °C, and (c) 600 °C. | ||
When the temperature increased above the melting point of the BIBO crystal, the sample started to melt at the hot side. By slow cooling the temperature, the crystal gradually grew to the hot side. Finally, a stable crystal–melt interface was obtained, as shown in Fig. 3. The melt structure near the crystal–melt interface was studied by high-temperature Raman spectroscopy. The measurement positions are also shown in Fig. 3, their corresponding Raman spectra are presented in Fig. 4.
 | ||
| Fig. 3 A typical BIBO crystal–melt interface with the measurement positions. (Position a: in the crystal, 5 µm from the interface. Positions b, c and d: in the melt, 2, 10 and 50 µm from the interface, respectively.) | ||
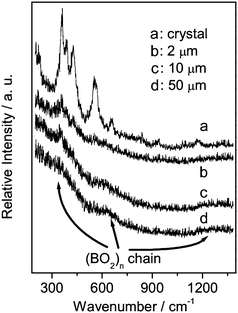 | ||
| Fig. 4 Raman spectra recorded from different positions near the BIBO crystal–melt interface. (Position a: in the crystal, 5 µm from the interface; Positions b, c and d: in the melt, 2, 10 and 50 µm from the interface, respectively.) | ||
The Raman spectrum recorded from position d (in the BIBO bulk melt) has three vibrational bands located at around 350, 630, 1300 cm−1. Similar Raman spectra have been observed in several B2O3–Bi2O3 glasses with a composition around Bi2O3·3B2O3,26–28 it also resembles the Raman spectra of LiBO2 and CaB2O4 crystals which are known to contain simple (BOØ)n chains.29 Based on the results reported by Rulmont et al., the vibrational band around 1300 cm−1 can be assigned to the B–Ø stretching vibration of (BOØ)n chain; the vibrational band around 630 cm−1 can be assigned to the chain deformation modes; the vibrational band below 400 cm−1 can be assigned to the external vibrational modes which originate from the weak coupling between the (BOØ)n chain and the rest of the BIBO melt.29 The Raman spectrum suggests that the (BOØ)n chain and free Bi3+ cations are the primary structural units existing in the BIBO bulk melt.
From position d to b, the vibrational band located at around 350 cm−1 increases in intensity and divides to some smaller peaks (from 300 to 500 cm−1). Considering that the symmetric stretching vibrational frequency of the bridging oxygen atom in an angularly constrained Bi–Ø–Bi configuration is in the range of 300∼600 cm−1,30,31 the broad and strong bands should be associated with the vibration of the Bi–Ø (i.e., Bi–Ø–B) bond. The presence of the Bi–Ø bond indicates the free Bi3+ cations connect with the (BOØ)n chain near the crystal–melt interface. When the measuring point moved from the BIBO melt to crystal (from position b to a), a band located at around 575 cm−1 appears. This peak was assigned to the symmetric stretching vibration of [BØ4] tetrahedron by Hu et al.,22 which implies that an isomerization process, as shown in Scheme 1, occurs accompanying the crystalline process. The isomerization process has also been found in numerous borate systems,20,32–34 which leads to the conversion of some 3-coordinated boron atoms to 4-coordinated boron atoms. The (BOØ)n chains are connected by the isomerization process near the BIBO crystal–melt interface and gradually form a boron-oxygen network.
 | ||
| Scheme 1 Isomerization process near the BIBO crystal–melt interface. | ||
The BIBO crystal structure is a continuous three-dimensional network, its basic unit is the Bi2B3Ø8 group (see Fig. 5), which contains two [BØ3]-triangles, one [BØ4]-tetrahedron, and two Bi3+ cations, forming two six-membered rings.21 From the above results, we know that the free Bi3+ cations and (BOØ)n chains play the roles of crystal growth units in the BIBO crystal growth process. On the basis of the BIBO crystal structure, we further propose a mechanism for the crystal growth, as shown in Scheme 2. First, two neighboring oxygen atoms in a (BOØ)n chain are connected by Bi3+ cations to form the BiB2Ø3 six-membered rings, and meanwhile two adjacent (BOØ)n chains are connected by Bi3+ cations through Ø–Bi–Ø bonds. As a result, the structural prototype of the BIBO crystal is present near the crystal–melt interface. Then, the boron atoms in a (BOØ)n chain (chain 2) connect with the oxygen atoms in the adjacent (BOØ)n chain (chain 1) to form the BIBO crystal structure. The (BOØ)n long chains, Bi-Ø bonds and the BØ4 groups near the crystal–melt interface lead to a very high viscosity, as reported in previous papers.9,10 It not only inhibits the initial nucleation of the crystal, but also limits the mixing and mass transport in the melt.
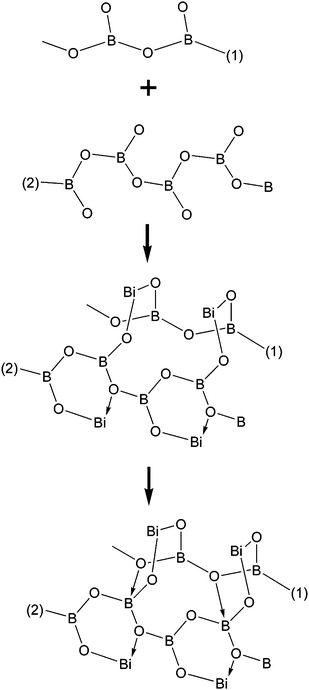 | ||
| Scheme 2 A mechanism for BIBO crystal growth. | ||
 | ||
| Fig. 5 The basic unit in the BIBO crystal structure. Dark, medium and light grey balls denote oxygen, bismuth and boron atoms, respectively. | ||
The growth habit of the BIBO crystal can be explained based on the above results. According to crystal growth theories, the crystal habit is dominated by the slow-growing faces.35 The fast-growing faces will not be present in the final crystal morphology. In the attachment energy model for crystal habit, the relative growth rates of various faces are assumed to be proportional to their attachment energy (Ratt, defined as the energy released when one additional growth slice of thickness dhkl is attached to the crystal face identified by the Miller indices hkl.). The attachment energy is determined primarily by the binding strength between the growth units and the crystal face.36 By comparing the structure of the BIBO crystal to the BIBO melt, we conclude that the weak bonds in the BIBO crystal structure are the Bi–Ø and B4–Ø bonds (the B–Ø bands of BØ4 tetrahedron) because the two bonds will break when the BIBO crystal melts. Thus, the faces only containing B–Ø or B4–Ø bonds possess weaker strength of binding. According to the BIBO crystal structure, the faces only containing Bi–Ø bonds are parallel to the {001} faces, the faces only containing Bi–Ø and B4–Ø bonds are parallel to the {110}, {111} and {102} faces. Therefore, these faces should be the large developed faces in the final crystal morphology. The predicted growth habit is in good agreement with the experimental results reported by Becker et al.9,10 The cases of the (001) and (011) faces are shown in Fig. 6.
 | ||
| Fig. 6 Packing arrangement of the BIBO crystal structure as viewed along the b axis (top) and the c axis (bottom). The (001) face is parallel to the faces rich in Bi–Ø bonds; the (110) face is parallel to the faces rich in Bi–Ø bonds and B4–Ø bonds. Dark, medium and light grey balls denote oxygen, bismuth and boron atoms, respectively. | ||
Conclusions
High-temperature Raman spectroscopy has been used to study the BIBO crystal growth mechanism. (BOØ)n chains and free Bi3+ cations, the crystal growth units, were found in the BIBO bulk melt. Two neighboring oxygen atoms in a (BOØ)n chain or in two different (BOØ)n chains are connected by the Bi3+ cations to form the structural prototype of the BIBO crystal. This structural prototype further converts into a BIBO crystal through an isomerization process. The predicted crystal growth habit is in good agreement with the observed one based on the mechanism.Investigation on the crystal growth mechanism is crucial for us to identify the factors affecting the quality of single crystals, and thus to develop new growth techniques for producing high-quality crystals. Our work has proved that high-temperature Raman spectroscopy is the effective tool for investigating the crystal growth mechanism. We believe that the method has the potential to widen our knowledge of crystal growth micro-processes.
Experimental
Our experimental system comprises two components:19,20 a Jobin Y'von LABRAM HR800 Raman spectrometer and a crystal growth cell. Unpolarized Raman spectra were recorded on the high-temperature Raman spectrometer with a back scattering configuration. The excitation source was the 532 nm line of a Q-switch pulsed SHG-Nd:YAG laser. The laser beam was introduced into a BIBO crystal sample with the incident beam perpendicular to the (011) crystal face. The Raman scattering light was collected using a mirror, a lens, and an ICCD (intensive charge couple device). Typically 30 scans were accumulated for the crystal, and 5 scans for the melt. All spectra were recorded at 2 cm−1 resolution. The spatial resolution of the Raman spectrometer was about 2 µm. The growth cell was fabricated from high-grade stainless steel and consists of a water jacket surrounding a main sample chamber. A platinum boat with the size of 5 × 10 × 20 mm was placed in the centre of the chamber. The BIBO crystal sample was mounted in the boat and heated on the right side by a platinum wire winding. The heating system provided a horizontal temperature gradient in the boat.Acknowledgements
This research is supported by the National Natural Science Foundation of China (Nos. 50472104 and 10304009). The authors thank The National Key Laboratory of Crystal Materials at Shangdong University for providing the BIBO crystal. The authors also thank Sijie Zhao, Yuanyuan Wang, Li Xiao, and Wei Wang for helpful discussions and technical support.References
- T. Sasaki, Y. Mori, M. Yoshimura, Y. K. Yap and T. Kamimura, Mater. Sci. Eng., R, 2000, 30, 1–54 CrossRef.
- P. Becker, Adv. Mater., 1998, 10, 979–992 CrossRef CAS.
- S. M. Wan in New Developments in Crystal Growth Research, ed. G. V. Karas, Nova, Virginia, 2006, pp. 1–39 Search PubMed.
- H. Hellwig, J. Liebertz and L. Bohaty, J. Appl. Phys., 2000, 88, 240–244 CrossRef CAS.
- H. Hellwig, J. Liebertz and L. Bohaty, Solid State Commun., 1998, 109, 249–251 CrossRef.
- M. Ebrahim-Zadeh, IEEE J. Sel. Top. Quantum Electron., 2007, 13, 679–691 CrossRef CAS.
- M. Ghotbi, Z. Sun, A. Majchrowski, E. Michalski, I. V. Kityk and M. Ebrahim-Zadeh, Appl. Phys. Lett., 2006, 89, 173124–173127 CrossRef.
- M. Ghotbi, M. Ebrahim-Zadeh, A. Majchrowski, E. Michalski and I. V. Kityk, Opt. Lett., 2004, 29, 2530–2532 Search PubMed.
- P. Pecker, J. Liebertz and L. Bohaty, J. Cryst. Growth, 1999, 203, 149–155 CrossRef CAS.
- B. Teng, J. Y. Wang, Z. P. Wang, H. D. Jiang, X. B. Hu, R. B. Song, H. Liu, Y. G. Liu, J. Q. Wei and Z. S. Shao, J. Cryst. Growth, 2001, 224, 280–283 CrossRef CAS.
- B. Teng, J. Y. Wang, Z. P. Wang, X. B. Hu, H. D. Jiang, H. Liu, X. F. Cheng, S. M. Dong, Y. G. Liu and Z. S. Shao, J. Cryst. Growth, 2001, 233, 282–286 CrossRef CAS.
- M. J. Williamson, R. M. Tromp, P. M. Vereecken, R. Hull and F. M. Ross, Nat. Mater., 2003, 2, 532–536 CrossRef CAS.
- W. A. Curtin, Phys. Rev. Lett., 1987, 59, 1228–1231 CrossRef CAS.
- O. G. Shpyrko, R. Streitel, V. S. K. Balagurusamy, A. Y. Grigoriev, M. Deutsch, B. M. Ocko, M. Meron, B. Lin and P. S. Pershan, Science, 2006, 313, 77–80 CrossRef CAS.
- S. H. Oh, Y. Kauffamann, C. Scheu, W. D. Kaplan and M. Rühle, Science, 2005, 310, 661–663 CrossRef CAS.
- S. Piana, M. Reyhani and J. D. Gale, Nature, 2005, 438, 70–73 CrossRef CAS.
- A. A. Chernov, J. Cryst. Growth, 2004, 264, 499–518 CrossRef CAS.
- J. L. You, G. C. Jiang, H. Y. Hou, H. Chen, Y. Q. Wu and K. D. Xu, J. Phys.: Conf. Ser., 2006, 28, 25–29 CrossRef CAS.
- S. M. Wan, X. Zhang, S. J. Zhao, Q. L. Zhang, J. L. You, H. Chen, G. C. Zhang and S. T. Yin, J. Appl. Crystallogr., 2007, 40, 725–729 CrossRef CAS.
- S. M. Wan, X. Zhang, S. J. Zhao, Q. L. Zhang, J. L. You, L. Lu, P. Z. Fu, Y. C. Wu and S. T. Yin, Cryst. Growth Des., 2008, 8, 412–414 CrossRef CAS.
- V. R. Frohlich, L. Bohaty and J. Lieberta, Acta Crystallogr., Sect. C: Cryst. Struct. Commun., 1984, 40, 343–344 CrossRef.
- X. B. Hu, J. Y. Wang, B. Teng, C. K. Loong and M. Grimsditch, J. Appl. Phys., 2005, 97 Search PubMed 033501–1–4.
- A. V. Egorysheva, V. I. Burkov, Yu. F. Kargin, V. G. Plotnichenko and V. V. Koltashev, Crystallogr. Rep., 2005, 50, 127–136 CrossRef CAS.
- D. Kasprowicz, T. Runka, M. Szybowicz, P. Ziobrowski, A. Majchrowski, E. Michalski and M. Drozdowski, Cryst. Res. Technol., 2005, 40, 459–465 CrossRef CAS.
- F. Cerderira, F. E. A. Melo and V. Lemos, Phys. Rev. B: Condens. Matter Mater. Phys., 1983, 27, 7716–7729 CrossRef.
- L. Baia, R. Stefan, J. Popp, S. Simon and W. Kiefer, J. Non-Cryst. Solids, 2003, 324, 109–117 CrossRef CAS.
- L. Baia, R. Stefan, W. Kiefer and S. Simon, J. Raman Spectrosc., 2005, 36, 262–266 CrossRef CAS.
- L. Baia, R. Stefan, W. Kiefer, J. Popp and S. Simon, J. Non-Cryst. Solids, 2002, 303, 379–386 CrossRef CAS.
- A. Rulmont and M. Almou, Spectrochim. Acta, Part A, 1989, 45, 603–610 CrossRef.
- S. Hazra, S. Mandal and A. Ghosh, Phys. Rev. B: Condens. Matter Mater. Phys., 1997, 56, 8021–8025 CrossRef CAS.
- A. A. Kharlamov, R. M. Almeda and H. Heo, J. Non-Cryst. Solids, 1996, 202, 233–240 CrossRef CAS.
- G. D. Chryssikos, E. I. Kamitsos, Proc. Second Int. Conf. on Borates Glasses, Crystal and Melts, Sheffield, 1997 Search PubMed.
- R. Akagi, N. Ohtori and N. Umesaki, J. Non-Cryst. Solids, 2001, 293–295, 471–476 CrossRef CAS.
- G. D. Chryssikos, E. I. Kamitsos and M. A. Karakassides, Physics Chem. Glasses, 1990, 31, 109–116 Search PubMed.
- P. Hartman, in Morphology of Crystal, ed. I. Sunagawa, Terra, Tokyo, 1987, pp. 269–319 Search PubMed.
- M. Brunsteiner, A. G. Jones, F. Pratola, S. L. Price and S. J. R. Simons, Cryst. Growth Des., 2005, 5, 3–16 CrossRef CAS.
| This journal is © The Royal Society of Chemistry 2010 |