Introduction of fluorescence and chemiluminescence detection to capillary chromatography based on tube radial distribution of water–hydrophilic–hydrophobic organic mixture carrier solvents
Seiji
Ishimoto
,
Yudai
Kudo
,
Naoya
Jinno
,
Masahiko
Hashimoto
and
Kazuhiko
Tsukagoshi
*
Department of Chemical Engineering and Materials Science, Faculty of Science and Engineering, Doshisha University, Kyotanabe, Kyoto 610-0321, Japan. E-mail: ktsukago@mail.doshisha.ac.jp
First published on 2nd August 2010
Abstract
Fluorescence and chemiluminescence detection were introduced into a tube radial distribution chromatography (TRDC) system using an open fused-silica capillary tube and a water–acetonitrile–ethyl acetate mixture carrier solution. Model analyte mixture solutions, such as Eosin Y and perylene as well as dansyl methionine and perylene, were injected into the capillary tube by a gravity method. The analyte solution was subsequently delivered through the capillary tube with the carrier solution by a microsyringe pump; the system worked under laminar flow conditions. The analytes were separated through the tube and detected by on-capillary with fluorescence detection or by end-capillary with chemiluminescence detection taking advantage of peroxyoxalate chemiluminescence reaction. Eosin Y and perylene as well as dansyl methionine and perylene were detected in this order with a carrier solution of water–acetonitrile–ethyl acetate (15![[thin space (1/6-em)]](https://www.rsc.org/images/entities/char_2009.gif) :3:2 volume ratio), while they were detected in the reverse order with a carrier solution of water–acetonitrile–ethyl acetate (3:8:4 or 2:7:4 volume ratio) with fluorescence or chemiluminescence detection. The elution times of the analytes were reversed by changing the component ratio of the solvents in the carrier solution. A fluorescein isothiocyanate-labeled bovine serum albumin was also analyzed and separated from the coexisting labeling reagent with the present system.
:3:2 volume ratio), while they were detected in the reverse order with a carrier solution of water–acetonitrile–ethyl acetate (3:8:4 or 2:7:4 volume ratio) with fluorescence or chemiluminescence detection. The elution times of the analytes were reversed by changing the component ratio of the solvents in the carrier solution. A fluorescein isothiocyanate-labeled bovine serum albumin was also analyzed and separated from the coexisting labeling reagent with the present system.
1. Introduction
Capillary chromatography and related separation technology, including capillary electrochromatography,1,2 capillary electrophoresis,3,4 capillary liquid chromatography,5–7 and hydrodynamic chromatography,8 are among the most active areas of research in chemical engineering, analytical technology, and separation science. A novel capillary chromatography method using an open capillary tube and a water–hydrophilic–hydrophobic organic mixture as a carrier solution was developed.9,10 This is called a tube radial distribution chromatography (TRDC) system,9 which is based on the tube radial distribution of carrier solvents in the capillary tube under laminar flow conditions. Separation in the system was performed without the use of any specific materials, i.e., packed or modified capillary tubes, additives of gels, surfactants, host molecules, or high-voltage supply devices. Furthermore, the elution order of the analytes could be changed easily by altering the component ratio of the solvents in the carrier solution.To date, fused-silica, polyethylene, or polytetrafluoroethylene capillary tubes have been used as open capillary tubes in TRDC systems.9,10 Model mixture analyte solutions, such as 2,6-naphthalenedisulfonic acid and 1-naphthol, perylene and Eosin Y, 1,1′-bi-2-naphthol and calcein, and p-nitroaniline and 2,7-naphthalenedisulfonic acid, were well separated through the open capillary tube with a water–hydrophilic–hydrophobic organic solvent mixture as a carrier solution. All the experiments were carried out on-capillary with absorption detection.
Fluorescence and chemiluminescence detection, as well as absorption detection, have been widely used in flow analyses, including flow-injection analysis, high-performance liquid chromatography, and capillary electrophoresis, to extend the analytical performance with regard to sensitivity and analytical subjects.11–15 In this study, we attempted to introduce fluorescence and chemiluminescence detection into the TRDC system.
2. Experimental
2.1. Reagents and materials
Water was purified with an Elix UV 3 (Millipore Co.). All reagents used were commercially available and of analytical grade. Eosin Y, perylene, dansyl methionine, acetonitrile, ethyl acetate, bis[2-(3,6,9-trioxadecayloxycarbonyl)-4-nitrophenyl] oxalate (TDPO), and bovine serum albumin (BSA) were purchased from Wako Pure Chemical Industries, Ltd. Hydrogen peroxide solution (30 wt%) and fluorescein isothiocyanate (FITC) were purchased from Nacalai Tesque and Tokyo Chemical Industry Co., respectively. Fused-silica capillary tubes (50 or 75 µm id and 150 µm od) were purchased from GL Science.2.2. Apparatus and procedures
Schematic diagrams of the TRDC systems comprised of an open capillary tube and a microsyringe pump (MF-9090; Bioanalytical Systems, Inc.) equipped with a fluorescence detector (modified RF-535 fluorescence detector; Shimadzu Co.) and a chemiluminescence detector (Kimoto Electric Ltd, Co.), as shown in Fig. 1(a) and (b), respectively. Fused-silica capillary tubes, 80 cm in length (effective length: 60 cm) and 75 µm id for fluorescence detection, and 90 cm in length and 50 µm id for chemiluminescence detection, were installed in the systems. Mixtures of water–acetonitrile–ethyl acetate at various volume ratios (15:3:2, 2:7:4, and 3:8:4) were used as the carrier solution. Analyte mixture solutions, Eosin Y and perylene mixture as well as dansyl methionine and perylene mixture, were prepared with the carrier solutions.
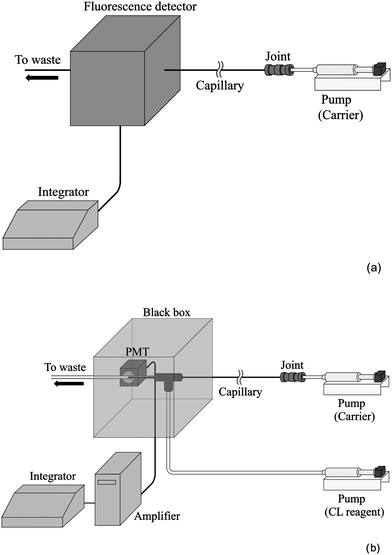 | ||
| Fig. 1 Schematic diagrams of the present TRDC systems with (a) fluorescence detection and (b) chemiluminescence detection. | ||
The analyte solution was introduced directly into the capillary inlet for 10 s from a height of 25 cm for fluorescence detection, or for 10 s from a height of 30 cm for chemiluminescence detection by the gravity method. After analyte injection, the capillary inlet was connected through a joint to a microsyringe. The syringe was set on the microsyringe pump. The carrier solution was fed into the capillary tube at a flow rate of 0.2 µL min−1 for fluorescence and chemiluminescence detection under laminar flow conditions.
On-capillary fluorescence detection was carried out with ex. 430 nm and em. 520 nm for Eosin Y and perylene mixture as well as ex. 360 nm and em. 515 nm for dansyl methionine and perylene mixture. End-capillary chemiluminescence detection was performed making use of peroxyoxalate chemiluminescence reaction as follows. A flow-type chemiluminescence detection cell (0.5 mm id polytetrafluoroethylene tube) was used (Fig. 1(b)). The chemiluminescence reagent consisting of acetonitrile solution (2 mM TDPO and 200 mM hydrogen peroxide) was delivered at the flow rate of 20 µL min−1 to the capillary outlet in the detection cell where the chemiluminescence reagent and the analytes were mixed to induce chemiluminescence.
3. Results and discussion
3.1. Fluorescence detection
The analyte mixture solution of Eosin Y and perylene was examined with the present TRDC system equipped with a fluorescence detector using an open fused-silica capillary and water–acetonitrile–ethyl acetate mixture carrier solution. Eosin Y and perylene were eluted through the capillary tube in this order with the water–acetonitrile–ethyl acetate carrier solution (15:3:2 volume ratio). In addition, they were eluted in the reverse order with the water–acetonitrile–ethyl acetate carrier solution (2:7:4 volume ratio). The chromatograms obtained with the water-rich and organic solvent-rich carrier solutions are shown in Fig. 2(a) and (b), respectively.
 | ||
| Fig. 2 Chromatograms of a mixture of Eosin Y and perylene by the present TRDC system with fluorescence detection. Conditions: capillary tube, 80 cm (effective length: 60 cm) of 75 µm id fused-silica; carrier, (a) water–acetonitrile–ethyl acetate (15:3:2 volume ratio) mixture solution and (b) water–acetonitrile–ethyl acetate (2:7:4 volume ratio) mixture solution; sample injection, 25 cm height (gravity) × 10 s; flow rate, 0.2 µL min−1; analyte concentration, 1 mM each. | ||
The analyte mixture solution of dansyl methionine and perylene was analyzed in a similar way using the system equipped with a fluorescence detector. Dansyl methionine and perylene were separated and detected in this order with the water-rich carrier solution and they were detected in the reverse order with the organic solvent-rich carrier solution. The chromatograms thus obtained are shown in Fig. 3(a) and (b), respectively.
 | ||
| Fig. 3 Chromatograms of a mixture of dansyl methionine and perylene by the present TRDC system with fluorescence detection. Conditions: capillary tube, 80 cm (effective length: 60 cm) of 75 µm id fused-silica; carrier, (a) water–acetonitrile–ethyl acetate (15:3:2 volume ratio) mixture solution and (b) water–acetonitrile–ethyl acetate (2:7:4 volume ratio) mixture solution; sample injection, 25 cm height (gravity) × 10 s; flow rate, 0.2 µL min−1; analyte concentration, 1 mM each. | ||
3.2. Chemiluminescence detection
The peroxyoxalate chemiluminescence reaction16 is one of the most important such reactions used in various flow systems. Oxalate reagents, such as bis(2,4,6-trichlorophenyl) oxalate (TCPO) and TDPO, react with hydrogen peroxide to give a dioxetane compound as an immediate, which interacts with fluorescent compounds. Energy transfer occurs from the dioxetane compound to the fluorescent compound through complex formation, and the excited fluorescent compound drops to the ground state, emitting chemiluminescence. The fluorescent compounds can be detected with high sensitivity through the chemiluminescence by taking advantage of the peroxyoxalate chemiluminescence reaction.The analyte mixture solution of Eosin Y and perylene was subjected to the present TRDC system equipped with the chemiluminescence detector. They were eluted with the water–acetonitrile–ethyl acetate carrier solution (15:3:2 volume ratio) in this order and in the reverse order with the water–acetonitrile–ethyl acetate carrier solution (3:8:4 volume ratio). The chromatograms obtained with the water-rich carrier solution and the organic solvent-rich carrier solution are shown in Fig. 4(a) and (b), respectively.
 | ||
| Fig. 4 Chromatograms of a mixture of Eosin Y and perylene by the present TRDC system with chemiluminescence detection. Conditions: capillary tube, 90 cm of 50 µm id fused-silica; carrier, (a) water–acetonitrile–ethyl acetate (15:3:2 volume ratio) mixture solution and (b) water–acetonitrile–ethyl acetate (3:8:4 volume ratio) mixture solution; sample injection, 30 cm height (gravity) × 10 s; flow rate, 0.2 µL min−1; analyte concentration, 50 µM each. | ||
The analyte mixture of dansyl methionine and perylene was examined in a similar way using this system with the chemiluminescence detector. The chromatograms obtained with the water-rich carrier solution and the organic solvent-rich carrier solution are shown in Fig. 5(a) and (b), respectively. Dansyl methionine and perylene were eluted in this order with the water-rich carrier solution and in the reverse order with the organic solvent-rich carrier solution.
 | ||
| Fig. 5 Chromatograms of a mixture of dansyl methionine and perylene by the present TRDC system with chemiluminescence detection. Conditions: capillary tube, 90 cm of 50 µm id fused-silica; carrier, (a) water–acetonitrile–ethyl acetate (15:3:2 volume ratio) mixture solution and (b) water–acetonitrile–ethyl acetate (3:8:4 volume ratio) mixture solution; sample injection, 30 cm height (gravity) × 10 s; flow rate, 0.2 µL min−1; analyte concentration, 50 µM each. | ||
The detection limits of the fluorescent compounds for fluorescence detection were 10–100 µM order (S/N = 3), and those for chemiluminescence detection were 1–10 µM order (S/N = 3), respectively. Chemiluminescence detection provided greater detection sensitivity than fluorescence detection under the present analytical conditions. The data obtained here with fluorescence and chemiluminescence detection suggested that the TRDC system could be applied successfully to the separation and determination of fluorescence-labeled compounds, such as amino acids, peptides, proteins, saccharides, and nucleic acids.
3.3. Consideration of the elution order
Various mixtures consisting of hydrophilic and hydrophobic molecules as analytes have been examined using the TRDC system with fused-silica, polyethylene, or polytetrafluoroethylene capillary tubes and a water–acetonitrile–ethyl acetate mixture carrier solution.9,10 The separation performance in the TRDC system is explained as follows. (1) Water and organic solvents in the carrier solution are not dispersed uniformly in the capillary tube based on the tube radial distribution of the solvents under laminar flow conditions. A major solvent phase (water-rich or organic solvent-rich) forms around the middle of the tube far from the inner wall, while a minor solvent phase (organic solvent-rich or water-rich) is generated near the inner wall of the capillary tube as a pseudo-stationary phase. (2) Hydrophilic molecules in the analyte mixture are subsequently dispersed in the water-rich phase, and hydrophobic molecules are dissolved in the organic solvent-rich phase. (3) The analyte dispersed in the major solvent phase around the middle of the capillary tube is eluted with near average linear velocity, while the analyte dispersed in the minor solvent phase near the inner wall of the tube is eluted with a smaller than average linear velocity; the separation is chromatographically performed through distribution between inner and outer phases. The elution times of the analytes can be easily reversed by changing the component ratio of the solvents in the carrier solution.Eosin Y and dansyl methionine are comparatively hydrophilic compounds and perylene is a hydrophobic compound. The elution orders observed on the chromatograms in Fig. 2–5 were consistent with the separation performance based on the tube radial distribution of the carrier solvents in the TRDC system. For example, Eosin Y (hydrophilic) and perylene (hydrophobic) were eluted in this order with the water-rich carrier solution (Fig. 2(a) and 4(a)) and in the reverse order with the organic solvent-rich carrier solution (Fig. 2(b) and 4(b)).
3.4. Analysis of fluorescence labeled protein
Bovine serum albumin as a model protein was labeled with FITC that is one of the most useful labeling reagents for biomolecules. Bovine serum albumin (0.5 µmol) and FITC (1.0 µmol) were dissolved in a solution of water–triethylamine (95:5 volume ratio) (100 µL). The mixture was stirred for 1 min and left in the dark for 20 min. After evaporation of the solvent, the residue was redissolved in the carrier solution (1 mL) to give the analyte solution including an excess (or free)-FITC and FITC-labeled BSA.
The mixture of FITC and FITC-labeled BSA was subjected to the TRDC with fluorescence detection. FITC and FITC-labeled BSA were separated and detected in this order with the organic solvent-rich carrier solution, while they were detected in the reverse order with the water-rich carrier solution. Clearly, the elution times of the analytes were changed by altering the component ratios of the carrier solvents. The elution orders obtained for the mixture of FITC and FITC-labeled BSA were reasonable considering the free-FITC to be more hydrophobic than the FITC-labeled protein.
The chromatograms obtained for the mixture of FITC and FITC-labeled BSA as well as the mixture of FITC, FITC-labeled BSA, and perylene that was added to the solution after the labeling procedure are shown in Fig. 6 together with the analytical conditions in the captions. As shown in Fig. 6(b), perylene, FITC, and FITC-labeled BSA were separated and detected in this order with the organic solvent-rich carrier solution. The first peak of perylene on the chromatograms roughly appeared with the average linear velocity and the others, FITC and FITC-labeled BSA peak, were eluted with lower velocity under laminar flow conditions. The average linear velocity was confirmed by the experiment with a normal aqueous carrier solution not including any organic solvents. The elution order of perylene, FITC, and FITC-labeled BSA on the chromatogram was consistent with the nature of hydrophilicity or hydrophobicity of these analytes including the labeled protein.
 | ||
| Fig. 6 Chromatograms of (a) a mixture of FITC and FITC-labeled BSA as well as (b) a mixture of perylene, FITC, and FITC-labeled BSA by the present TRDC system with fluorescence detection. Conditions: capillary tube, 120 cm (effective length: 100 cm) of 50 µm id fused-silica; carrier, water–acetonitrile–ethyl acetate (3:8:4 volume ratio) mixture solution; sample injection, 30 cm height (gravity) × 30 s; flow rate, 0.2 µL min−1; fluorescence detection, ex. 495 nm and em. 520 nm; analyte concentration, 1 mM perylene and 0.5 mM FITC-labeled BSA. | ||
The separation was performed using an untreated open fused-silica capillary tube and a water–acetonitrile–ethyl acetate mixture carrier solution without any additives, such as gels, or applying a high voltage. To date, the TRDC has mostly been applied to the analysis of organic compounds with low molecular weights. The results obtained for biopolymer analysis here provide insight to expand the TRDC system to future research.
4. Conclusions
The TRDC system had been applied using an open capillary tube made of fused-silica, polyethylene, or polytetrafluoroethylene and a water–hydrophilic–hydrophobic organic solvent mixture carrier solution for separation and determination of mixture analyte solutions of hydrophilic and hydrophobic compounds with absorption detection.9,10 In the present study, we attempted to introduce fluorescence and chemiluminescence detection into the TRDC system to extend its analytical performance with regard to both analyte subjects and sensitivity. The model analyte solutions of Eosin Y and perylene mixture as well as dansyl methionine and perylene mixture were separated and detected with fluorescence or chemiluminescence detection in the TRDC system. The chemiluminescence detection was about 10–100 times more sensitive than fluorescence detection in the present TRDC system. The elution times of the analytes of the mixture solution could be easily changed by altering the component ratio of the carrier solvents. The data obtained here suggested that the present TRDC system would be useful for the separation and determination of fluorescence-labeled compounds.Acknowledgements
This work was supported by a Grant-in-Aid for Scientific Research (C) from the Ministry of Education, Culture, Sports, Science, and Technology, Japan.References
- H. J. Issaq, K. C. Chan, J. Blonder, X. Ye and T. D. Veenstra, J. Chromatogr., A, 2009, 1216, 1825 CrossRef CAS.
- A. C. Otieno and S. M. Mwongela, Anal. Chim. Acta, 2008, 624, 163 CrossRef CAS.
- K. Tsukagoshi, N. Jinno and R. Nakajima, Anal. Chem., 2005, 77, 1684 CrossRef CAS.
- M. C. Breadmore, J. R. E. Thabano, M. Dawod, A. A. Kazarian, J. P. Quirino and R. M. Guijt, Electrophoresis, 2009, 30, 230 CrossRef CAS.
- M. C. Jung, N. Munro, G. Shi, A. C. Michael and S. G. Weber, Anal. Chem., 2006, 78, 1761 CrossRef CAS.
- J. Urban and P. Jandera, J. Sep. Sci., 2008, 31, 2521 CrossRef CAS.
- T. Charoenraks, M. Tabata and K. Fujii, Anal. Sci., 2008, 24, 1239 CrossRef CAS.
- T. Okada, M. Harada and T. Kido, Anal. Chem., 2005, 77, 6041 CrossRef CAS.
- N. Jinno, M. Itano, M. Hashimoto and K. Tsukagoshi, Talanta, 2009, 79, 1348 CrossRef CAS.
- M. Murakami, N. Jinno, M. Hashimoto and K. Tsukagoshi, Chem. Lett., 2010, 272 CrossRef CAS.
- L. Gámiz-Gracia, A. M. García-Campaña, J. F. Huertas-Pérez and F. J. Lara, Anal. Chim. Acta, 2009, 640, 7 CrossRef CAS.
- K. Tsukagoshi, M. Tahira and R. Nakajima, Anal. Sci., 2003, 19, 1019 CAS.
- K. Tsukagoshi, K. Matsumoto, F. Ueno, K. Noda, R. Nakajima and K. Araki, J. Chromatogr., A, 2006, 1123, 106 CrossRef CAS.
- G. Rammouz, M. Lacroix, J. C. Garrigues, V. Poinsot and F. Couderc, Biomed. Chromatogr., 2007, 21, 1223 CrossRef CAS.
- Z. Yang, X. Wang, W. Qin and H. Zhao, Anal. Chim. Acta, 2008, 623, 231 CrossRef CAS.
- Chem- and Bioluminescence, ed. J. G. Burr, Marcel Dekker, Inc., 1985, ch. 5 Search PubMed.
| This journal is © The Royal Society of Chemistry 2010 |