Global illumination Raman chemical imaging of a combination of two drug molecules in a dry powder inhaler formulation
Slobodan
Šašić
*a and
Ljiljana
Harding
b
aPfizer Global Research and Development, Groton, 06344, CT, USA. E-mail: slsasic@yahoo.com
bPfizer Global Research and Development, Sandwich, CT13 9NJ, UK
First published on 27th August 2010
Abstract
Isolated particles of a combination dry powder inhalation blend consisting of a lactose carrier and two Active Pharmaceutical Ingredients (APIs) are imaged by a global illumination Raman instrument. The imaged APIs individually adhere on the surface of large particles of lactose or appear as aggregates of smaller particles. This is probably the first Raman report describing the visualization of API particles on the surface of lactose carriers and also on the use of the global illumination Raman imaging platform on a dry powder inhalation blend. Two methods of dispersing particles for imaging are described: using a particle sizing instrument (mechanical dispersion), which achieves high dispersion, or manually (lightly) dispersing the powder with a spatula so as to minimize the perturbation of the API deposits. Both APIs are clearly identified in the chemical images although the key band of one of them interferes with the bands of lactose which negatively affects the background of the corresponding images. The method of dispersion is found to have a profound effect on the API deposits because the mechanical dispersion leads to complete separation of lactose and API particles previously adhered to its surface. The results presented here reveal the significant potential of this imaging hardware for fast and reliable visualization of the inhalation blends.
Introduction
Raman chemical imaging is a method for chemical (via Raman spectra) and visual (via images) identification of the components in a formulation. A number of recent applications of Raman chemical imaging illustrate considerable potential of this modern method for analyzing pharmaceutical samples in development or manufacturing.1–10Every Raman imaging instrument consists of an automated microscope stage for moving the sample and a spectroscopic section for collection of the Raman signal. Depending on how the Raman data are obtained, there are two groups of imaging platforms: the so-called mapping platform that contains all the spectroscopic components for collection of the full-length spectra, and the global illumination imaging platform that collects chemical images at a single wavenumber.11,12 As such, the latter is a true imaging technique because the images are directly produced in each experiment while for the former the experiments produce the spectra from which the images are built through mathematical manipulations that can be rather complicated.
This submission addresses only a global illumination instrument, a more recent and less frequently used platform. This platform is equipped with special optical elements for transmitting scattered light only through a very narrow range of wavenumbers – this being its major technical difference over the mapping platform-type instruments. The instrument employed here uses liquid crystal tunable filters for selective transmission.11 Experiments consist of selecting wavenumbers uniquely assignable for each of the components in a formulation and collecting Raman signal from an area on the sample at each of those wavenumbers. As a result, a chemical image is produced for each of the components.
The most important characteristics of this setup are fast, simple, and high-fidelity imaging across large areas. Coverage of large areas is achieved by using defocused irradiation with the laser light which is substantially broader than the illumination through a spot or line with the mapping instruments. The obtained images typically are of high quality because of the very large number of sampling points from which the Raman signal is reflected onto the CCD camera. Achieving the same number of sampling points with the mapping platform would require minuscule shifts of the microscope stage and hence very long overall acquisition times. The key drawbacks of this technology are extensive effect of photon migration due to defocused irradiation and rather coarse spectral resolution.
Pharmaceutical applications of the global illumination imaging hardware were described in a few very recent studies.13–15 Those studies report on the suitability of the spatially separated samples as targets for imaging with this platform because of the large coverage and high fidelity achievable. One of those recent imaging studies described bulk characterization of separated pharmaceutical granules of no less than 200 μm in diameter across an area of approximately 10 mm2.15
Dry powder inhaler (DPI) formulations pose a specific scientific challenge due to a number of physical, chemical and surface properties that govern their performance and stability.16,17 Most commonly they represent adhesive mixtures of micronised drug particles on a lactose carrier.18 Ternary adhesive mixtures, consisting of coarse and fine excipients mixed with drug particles, were introduced as a means of improving drug product performance.19 More specifically, it has been shown that fine excipient particles increase drug fine particle fraction (FPF) and hence enable a more efficient delivery to the lungs. Quaternary formulations whereby two drug molecules are blended with a coarse and fine carrier introduce further formulation challenges. Insight into spatial distribution of components within quarternary blends and their mutual interactions is critically important for the success of DPI drug product development.
Inhalation blends are a very demanding target for Raman chemical imaging due to the small size of API particles (typically less than 5 μm) and low concentration (typically 0.5–5% w/w API). Conversely, these formulations usually have a simple chemical composition, with lactose carrier(s) and one or two APIs being the only components. The major challenge is thus to obtain acceptable Raman signal and recognizable spatial distribution for API particles.
To our knowledge, this is the first time that Raman imaging of an inhalation blend with a global illumination imaging platform is attempted. In this work we describe the imaging of inhalation blends that contain micronised API particles with a D50 (diameter where 50 mass-% (of the particles) of the powder have a larger equivalent diameter, and the other 50 mass-% have a smaller equivalent diameter) of approximately 3μm in a blend consisting of 98% w/w lactose carrier. The emphasis of this work is to illustrate the capability of this instrument to identify micronised drug particles on the surfaces of large carrier particles as well as within smaller particle agglomerates. In most cases the images are presented in a single field of view of 100 × 100 or 200 × 200 μm2.
Experimental
Lactohale LH100 (Friesland Foods Domo, The Netherlands) and Lactohale LH200 (Friesland Foods Domo, The Netherlands) were used as coarse and fine lactose carrier, respectively. D50-s (median or the 50th percentile of the particle size distribution, by volume) for the two types of lactose were 130 and 16 microns, respectively. A pre-blend of coarse and fine lactose grades (in an 80![[thin space (1/6-em)]](https://www.rsc.org/images/entities/char_2009.gif) :
:![[thin space (1/6-em)]](https://www.rsc.org/images/entities/char_2009.gif) 20 coarse
20 coarse![[thin space (1/6-em)]](https://www.rsc.org/images/entities/char_2009.gif) :
:![[thin space (1/6-em)]](https://www.rsc.org/images/entities/char_2009.gif) fine ratio) was obtained in a 0.5 L Diosna high-shear mixer by blending at 1200 rpm for 5 min and rested overnight prior to blending with the two APIs. The nature of the used APIs is not disclosed in this manuscript for proprietary reasons; this report focuses on exploring the potential of an instrumental technique and it was hence deemed that the actual chemical nature of the materials is of secondary importance. The API A (1% w/w) was added to the lactose pre-blend using the same set of parameters as described above. The API B (1% w/w) was added in a final blending step, conducted at 1000 rpm for 1 min.
fine ratio) was obtained in a 0.5 L Diosna high-shear mixer by blending at 1200 rpm for 5 min and rested overnight prior to blending with the two APIs. The nature of the used APIs is not disclosed in this manuscript for proprietary reasons; this report focuses on exploring the potential of an instrumental technique and it was hence deemed that the actual chemical nature of the materials is of secondary importance. The API A (1% w/w) was added to the lactose pre-blend using the same set of parameters as described above. The API B (1% w/w) was added in a final blending step, conducted at 1000 rpm for 1 min.
In this study, we describe two methods for particle dispersion, as the major goal of this experiment was to visualize the surface of the isolated particles of lactose. More specifically, mechanical and manual methods of dispersion are described and the advantages and disadvantages of both techniques are discussed. The mechanical dispersion method was applied in order to eliminate particle interaction and improve visual presentation. As this approach involves input of significant dispersion energy, it may cause particle de-aggregation and removal of API particles from the surfaces of lactose carrier. The mechanical method was compared with a manual dispersion in order to define a ‘base point’, i.e. the distribution of the blend components in the unperturbed blend. In this method, a small amount of powder blend is transferred onto a microscope slide with a spatula and the slide simply tapped by hand so as to separate particles as much as possible. This allowed for visualization and imaging of large particles but some particle agglomerates remained visible as the power of dispersion was not high enough to separate the blend completely.
An Occhio particle size system was used for mechanically dispersing the particles. This instrument consists of a high resolution 2 megapixel camera combined with an objective lens which analyses particles for size and shape information as they pass the camera and objective. A vacuum dispersion system was used to disperse a 2 mm diameter scoop of material, with the aim of providing a reasonably gentle way of separating agglomerated particles into their primary size and allowing them to fall gently onto a glass slide. It was not possible to measure the force/energy applied for the dispersion. This dispersion method resulted in particles distinctly far from each other.
The particles were not prepared in any particular way for the imaging (pressed or sliced), i.e. all of them were imaged ‘as obtained’ on the slide. Fig. 1 shows the Raman spectra of the API A and B, and lactose. Both APIs (incidentally) have bands that are suitable for chemical imaging by the global illumination system, i.e. in both spectra there are bands of medium to strong intensity that are not (significantly) overlapped with the bands of lactose. The wavenumber regions for imaging are hence set so as to cover the two most suitable bands at 1660 cm−1 (for A) and 1290 cm−1 (for B, Fig. 1). In practice, this means that the images are collected over the range of 1630 to 1680 cm−1 in order to cover the band 1660 cm−1, and 1240 to 1320 cm−1 to cover the band at 1290 cm−1, both in 10 cm−1 steps. For the latter range, there is some interference from lactose which will adversely affect detection of the Raman signal of the API B at 1290 cm−1. On the other hand, the prospect for imaging the API A is excellent, as there is no interference.
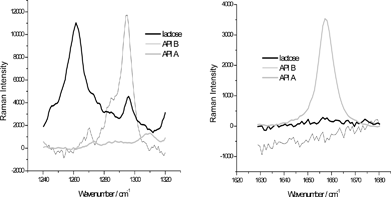 | ||
| Fig. 1 The Raman spectra of APIs A and B, and lactose in the spectral regions used for imaging (obtained by a dispersive Raman instrument). The original intensities of the spectra are manipulated in order to display them on the most appropriate scale. | ||
Theoretically, the applied imaging technique is supposed to be effective at a single specific wavenumber (i.e. peak position) that would reflect variation in the concentration of an imaged component.11 If that indeed were the case, it would be incomparably faster than the competing point- or line-mapping approaches due to very fast spectroscopic scanning. However, this normally cannot be achieved because the Raman signal at any given wavenumber is a combination of physical and chemical effects which are reflected in the overall baseline variation and peak gradients at the selected wavenumbers, respectively. In other words, the intensity variations at all wavenumbers are affected by both the baseline shift and concentration variation and the former has to be eliminated in order to obtain correct spatial distribution of the components. This can only be achieved if the baseline is measured and afterwards removed and that is why the imaging range always has to be wider than the bandwidth so that not only the selected peak but the corresponding baseline is captured. This in fact is the reason for choosing an interval of nine wavenumbers for imaging the API B – because of the presence of strong lactose band at 1260 cm−1, the first wavenumber position at which the baseline could be determined was 1240 cm−1.
For all the images acquired in this study the magnification objectives of ×10 and ×20 were used, with field of view (FOV) covering approximately 200 μm2 and 100 μm2, respectively. The former magnification was used more often as this work mostly focused on particles larger than 100 μm, while the latter was employed for sharper focusing on surface of big particles from the blends dispersed by the Occhio disperser. The ×20 objective provided better spectroscopic evidence but due to the uneven surfaces of the particles the visual quality of the images was inferior to those obtained with the ×10 objective.
All Raman chemical images, as well as the optical microscopy images, were obtained using ChemImage's ‘Falcon’ global illumination Raman imaging platform (Pittsburgh, PA, USA). The measurement conditions were varied during the analysis so as to achieve the best combination of the three factors: the quality of images, the spatial resolution, and the acquisition time. The quality of the images is obviously dependent on the latter two. The spatial resolution and the acquisition time are correlated in the following way: the better the spatial resolution (i.e. clearer visualization of smaller particles), the longer the acquisition time needed for obtaining satisfactory Raman signal/chemical images. The acquisition times varied considerably with the size of the particles imaged. For smaller particles, higher spatial resolution was mandatory and such images required longer acquisitions in comparison with the imaging of larger particles.
Both acquisition times and spatial resolution were adjusted by binning the pixels on the CCD camera. This operation reduces spatial resolution and improves the strength of the Raman signal (thereby reducing overall acquisition times) and the effects of its application need to be carefully weighed so as not to improve one too much at the expense of the other. Ideally, one sets conditions of an acquisition so as to obtain the strongest possible Raman signal without too detrimental effects on the spatial resolution.
After a series of experiments, in most cases, the final imaging condition was chosen to be binning of 7 × 7 pixels on the CCD camera into a single pixel thus setting the spatial resolution at about 5 μm for the ×10 magnification (i.e. that was the size of each pixel in the final image). The acquisition time varied between 1.5 and 2 min per wavenumber which in most cases sufficed to collect very good Raman signals of the APIs. This selection was based on the premise that the spatial resolution of 5 μm should be adequate for the given formulation; the purpose of this work was to detect the presence of drug particles rather than count them and assess their particle size distribution.
On average, it took between 9 and 18 min to collect a full image for one API across all wavenumbers with one FOV (which most often was the case because large single particles were typically imaged here). For larger areas appropriate FOV multiples apply.
All the Raman data were collected after exciting a sample with a 514 nm Ar+ laser line in an enclosed environment. The particles were not photo-bleached prior to Raman acquisitions as there was no fluorescence. None of the particles was laser-damaged during the experiments. This is confirmed by visual inspection and also by the fact that the obtained images did not contain any anomalous data.
All the software manipulation with the images was carried out with ChemAnalyze v.13 (imaging software that accompanies the instrument) and Matlab 6 (Matworks, Natick MA, USA). Matlab was used for inspecting one-dimensional representation of pixels, selecting the colors, and thresholding. This was of particular importance for images of groups of smaller particles in which the API signal was not always easily noticeable.
Results
Acquisition of all the Raman images was preceded with acquisition of light microscopy images that are very helpful for gaining a better visual perspective of the samples. This is due to the superior quality of the light microscopy images in comparison with the Raman chemical images, as the former are far more pixilated and much simpler to obtain. Identifying particles of interest is certainly easier if both images are present in parallel.The light microscopy image of the Occhio-dispersed sample is shown in Fig. 2. The dispersion appears to be quite strong (the dispersion force could not be controlled) and only several big particles are captured in this image across a very large area (approx. 10 mm2 is covered which is substantial in comparison with the sizes of the particles in the blends). In addition to these big particles, one can also notice a few spots on the slide with agglomerates of smaller particles (the term ‘agglomerates’ is used here to describe any group of particles that appear to be positioned close to each other). Both of these groups are imaged. The big particles are analyzed first and then the focus is shifted to the ‘agglomerates’.
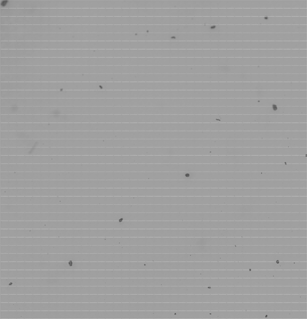 | ||
| Fig. 2 An example of optical microscopy image obtained from the blend dispersed by an instrument for particle sizing. The size of the image is 3.5 × 3.5 mm2. Relatively few big particles of lactose can be spotted in the image, with the groups of smaller particles also being present. These can clearly be seen only by a close inspection of this image by software. The size of the small white squares in the image, that represent FOVs, is about 100 × 100 μm. | ||
The analysis of the images of the big particles after mechanical dispersion shows that in practically all the cases no deposits were detected on the particles of lactose the size of which was normally above 100 μm. It is worth mentioning however that there were a few isolated cases in which a weak Raman signal was detected and in all of them only the API A was identified. Fig. 3 shows the best illustration of this. The corresponding Raman spectra are shown alongside.
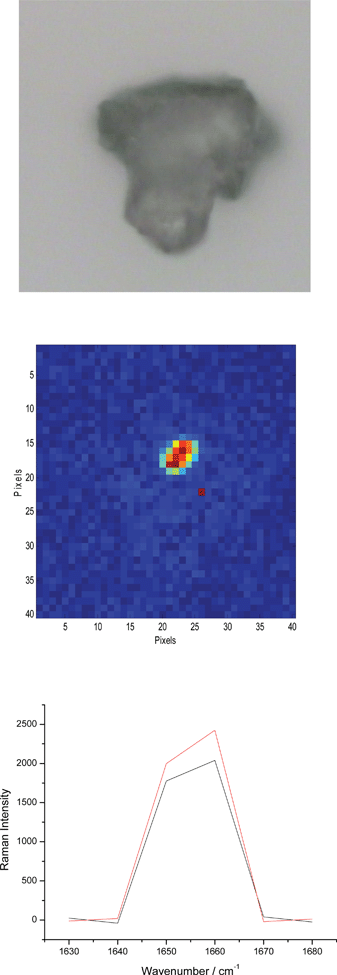 | ||
| Fig. 3 The optical microscopy image and the corresponding chemical image of the API A at 1660 cm−1 (both 200 × 200 μm2). The Raman spectra below are obtained from two random red pixels in the image above. This particular signal is about 10 times more intense than in any other case in which a similar situation is observed. | ||
The Raman spectra in Fig. 3 feature a strong band at 1660 cm−1 which clearly reveals presence of the API A. In a few other similar cases the Raman signal of the API A was significantly weaker and hence the corresponding images less reliable although still useful. The Raman spectra in Fig. 3 were obtained at only six wavenumbers (as described above) and thus do not appear to be as smooth as normally expected. The limitation regarding the number of positions at which the spectra are recorded implies that the spectra obtained with this type of imaging instrument cannot be as good as those obtained on instruments equipped with optical components that disperse the scattered light (such as a grating). Notwithstanding this issue, the spectra of API A are still easily recognizable.
In contrast, the analysis of the few observed groups of smaller particles (‘agglomerates’) only indicates the presence of the API B. A persuasive example of this is given in Fig. 4. A convincing Raman signal of the API B is detected and the particles from the optical microscopy image can be correlated (to some extent at least) with the particles of API B identified in the Raman images. It is interesting to notice that the Raman spectra in Fig. 4 do not feature the bands of lactose. It needs to be borne in mind that lactose is a much weaker scatterer than the two APIs but much more abundant; hence it is somewhat surprising that its strong band at 1260 cm−1 is not seen. The signal from the API A was not found. Given that API A has somewhat better Raman response than the API B and that previous analysis has shown that its particles of ca. 10 μm in diameter produce a detectable Raman signal, it is very likely that it would have been detected if it was present.
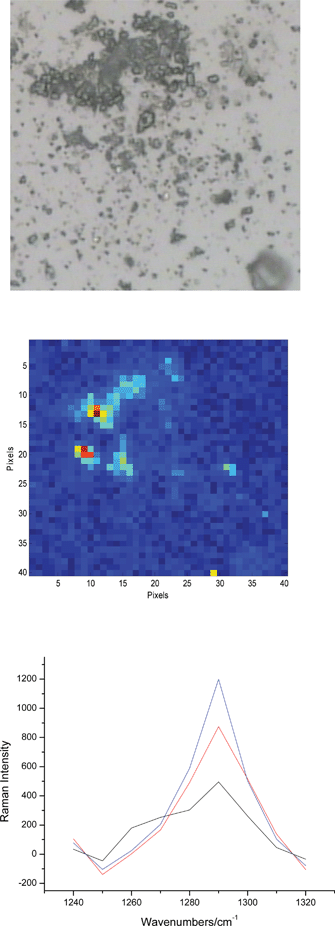 | ||
| Fig. 4 An example of the images from a group of small particles after the dispersion by Occhio. Optical microscopy and Raman chemical image of the API B are shown (both 200 × 200 μm2). As in the previous figure, a few Raman spectra are selected from the red pixels in the chemical image. The selected spectra only feature the band at 1290 cm−1 which points out to the absence of lactose from the few particles from which the spectra are obtained. | ||
Manually dispersed blends show significantly different results (Fig. 5). Although the particles are much less separated here, it is still possible to select and image large lactose particles. On the other hand, it is much more difficult to meaningfully analyze smaller particles – these are very close to each other and always feature both APIs so it is difficult to define a rationale for imaging them.
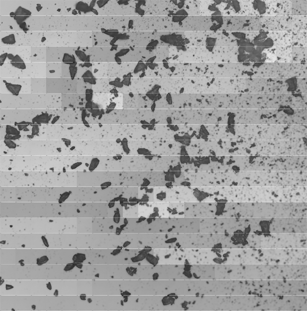 | ||
| Fig. 5 An optical microscopy image obtained from the manually dispersed blend (about 4 × 4 mm2). The particles are much closer to each other here than in Fig. 2 but it is still easy to select and image large particles of lactose (a FOV is 200 μm). | ||
For all the big particles of lactose analyzed, strong Raman signals from both APIs are detected which resulted in rather effortless identification of particles of both APIs (Fig. 6). Particles of the API A are particularly simple to image. Every lactose particle imaged contained several deposits of the API A ≥10 μm that all feature a strong Raman band at 1660 cm−1. It was more difficult to determine the presence of the API B because of the interference from lactose.
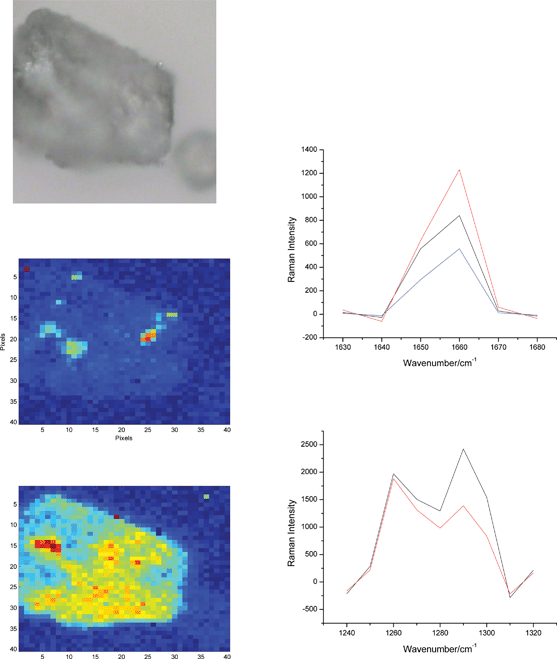 | ||
| Fig. 6 One of lactose particles from Fig. 5 (100 × 100 μm, b/w) and the chemical images of the API A (top) and B (bottom) with the accompanying Raman spectra from the red pixels. There is at least one big particle of the API B that is identified on the left side of the bottom image (large red domain) that gives rise to a strong Raman band at 1290 cm−1. Interference of the strong band of lactose at 1260 cm−1 is unavoidable and is behind the whole particle being contoured in this image. However, only the red-hot pixels are to be considered as API B. | ||
As mentioned above (and as can be seen in Fig. 1), there is a weak Raman band of lactose at 1295 cm−1 that overlaps with the key band of the API B at 1290 cm−1. (The tail of the strong lactose band at 1260 cm−1 also interferes, and this is probably of more importance.) This band would not interfere if the Raman signal originated only from a 10 μm particle on the surface of lactose carrier. However, due to the penetration of laser light into the lactose particle and multiple scattering, the Raman signal comes not only from the irradiated API particle but also from around it and from under the surface. This applies to all Raman imaging techniques, although it should be noted that the effect is particularly manifested for the imaging platforms that use defocused irradiation in order to obtain large FOVs, as was the case here14.
This causes the background in the Raman image of the API B to be higher than that observed in the image of the API A. This interference from lactose produces the yellow background (which contours the whole particle) on which the hot pixels pointing to API B can be spotted. Despite this issue, API B can still be reliably determined. All the hot (red only) pixels in the images in Fig. 6 and 7 feature the API B – specific peak at 1290 cm−1 so there is doubt about their identity. With respect to the interference from lactose, the image in Fig. 6 in particular can be more clearly rendered and contribution from lactose nearly eliminated by manipulating this image via a threshold. By setting a high threshold so that only the highest intensities at 1290 cm−1 are kept while everything else is annulled, the ‘yellowness’ of the image would disappear and only the hot pixel of API B would remain. This is not attempted here as we found no compelling reason to process the images. In fact, none of the images shown was manipulated in any way so the presented results exactly reflect what can be obtained by this method. (Principal Component Analysis, proven to be of great use for analyzing Raman mapping spectra,8 was tried too but it failed to clearly separate the Raman signal from API B from that from lactose).
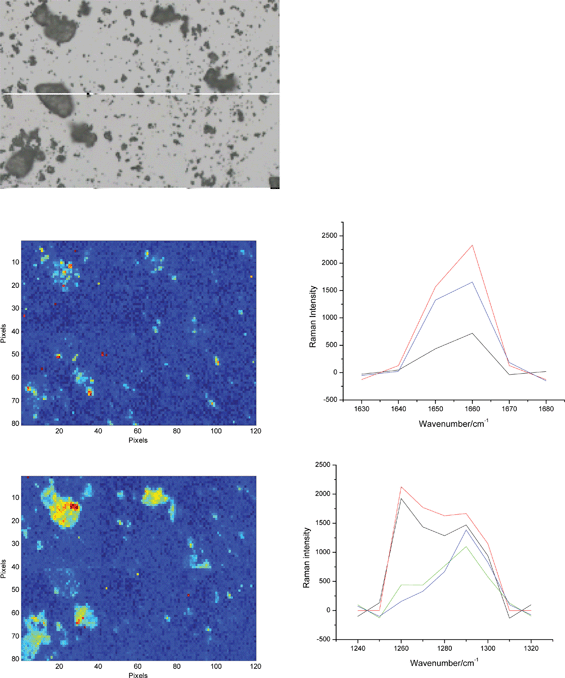 | ||
| Fig. 7 An optical microscopy image of a mixture of big and small particles from the manually dispersed blend and the corresponding chemical images of the API A (top) and B (bottom). Several representative Raman spectra of the two API forms from the hot pixels are shown as well. The yellow background in the image of the API B is due to lactose band at 1260 cm−1 being clearly visible in some of the upper spectra. As in Fig. 6, only the hot (red) pixels can be assigned to form B. The size of all images is 600 × 400 μm2. | ||
Both APIs are also easily determined in the images of the small particles of the manually dispersed blend (Fig. 7). These images are not discussed here further because it is hard to find a strong rationale for producing such images – these small particles are very close to each other so that it is hard to distinguish them in a chemical image. A statistical evaluation of their sizes thus cannot be made (unless stronger dispersion is applied). Useful information that could be obtained from images such as those in Fig. 7 is about API agglomeration. For example, the two APIs analyzed here do not seem to agglomerate as Fig. 7 does not reveal presence of clusters of either of the forms.
We decided to ignore Raman chemical images of lactose throughout for simple reason that all the displayed optical microscopy images with large particle effectively represent lactose while the images of smaller particles tend to be rather confusing.
Discussion
This study clearly reveals the significant potential of global illumination Raman imaging for the analysis of combination DPI formulations by demonstrating the prospects for identification of particles of multiple API compounds on the surface of large particles of lactose carrier. To the best of our knowledge, this is the first experimental evidence of such kind. The technique was capable of detecting micronized API particles, although the spatial resolution applied here was not sufficient to image particles within the size range that is clinically most desirable for delivery to the lungs. It is the aim of this application to demonstrate that the employed technology is generally effective, not necessarily that it can be straightforwardly used for the visualization of arbitrarily small particles.Therefore, this study does not aim at estimating size distribution of API particles which can be seen in relatively similar Raman mapping experiments (the approach featured here is imaging, not mapping).13,20 Better visualization of particles of or less than 5 μm (which in most cases was the pixel size in this study) would require a different experimental setup in which the spatial resolution would have to be prioritized. The imaging of large particles (both API and lactose) was effective with the selected pixel size.
Re-setting of spatial resolution would require appropriate changes in the binning parameters and acquisition times. The employed imaging hardware should be technically capable of producing images of inhalation particles that are meant to reach the lungs. Shifting the focus of research to smaller particles would be a natural progression of the work presented here. While for the API A this seems to be a relatively straightforward extension because of the very favorable spectral conditions, for API B there are problems with lactose making such studies more difficult. The interference from lactose obstructs precise estimation of particles of the API B which is only possible if the blend is dispersed. In addition, the thresholding of the pixels needs to be addressed more thoroughly so that the visual appearance of particles is improved.
The images shown here may appear crude given in some of them only one pixel is assigned to an API. Improving the spatial resolution (through less binning of CCD pixels) would lead to more pixels in an image and hence a better definition of the particles but would probably require much longer acquisition times for obtaining satisfactory Raman signal. This is also dependent on the objective used in experiments. Larger magnification objectives provide better Raman signal due to tighter focusing but cover smaller areas and are more sensitive to unevenness of the surfaces of particles. Smaller magnifications are normally easier to handle but the associated Raman signal may be an issue and also there is a question of acceptability of the spatial resolution that can be achieved. In any case, for the small particles from the dispersed blend, it is tremendously important to analyze the optical microscopy images in parallel with the Raman chemical images because it is much easier to visually identify API particles in the former images than it is to characterize API particles via the Raman images alone. Optical microscopy images are ineffective for the analysis of large particles of lactose – only the Raman chemical images were able to provide information about the API particles.
Another interesting facet of the results shown is in the significant differences in the images of particles with regards to the dispersion energy applied. If the blend is dispersed by a particle sizing instrument, the lactose carrier particles are almost completely free of both APIs, whereas the reverse is true when imaging the unperturbed blend samples. This evidence points to the possibility of monitoring the binding energy between an API and lactose by correlating a gradual change of the applied dispersion force with the chemical images of lactose particles. For strongly bonded APIs, a higher energy would have to be applied to detach them from the surface of lactose. In this particular study, the dispersion force was such that both APIs were detached but still there is some evidence (Fig. 3) that API A forms stronger bonds with lactose than API B, given that some particles of the former can be seen in the chemical images. Similarly, analysis of the groups of smaller particles shows that only API B is observed which suggest that this API may be more cohesive. These conclusions are in agreement with unpublished results on aerosolization performance of the aforementioned DPI formulation.
Conclusion
This study represents the first attempt to image a combination DPI blend formulation using a global illumination Raman instrument. The technique was used to image the surfaces of larger lactose carrier particles, as well as smaller particle agglomerates. Two methods of particle dispersion are assessed here; mechanical (whereby a particle sizing instrument was used to disperse the blend) and a manual method (used to preserve the sample in its original, unperturbed state). The method of dispersion was found to have a profound influence on the distribution of blend components. The mechanical dispersion method was found to detach API particles from the lactose carrier in the majority of cases, with only one of the APIs occasionally detected on the carrier surface. Contrarily, smaller particle agglomerates were found to consist only of the other API, thus indicating intrinsically different properties of APIs in a combination blend. The manually dispersed samples contained lactose carrier particles with easily identifiable deposits of both APIs on their surfaces.The results described here suggest that API B has a more adhesive nature, whereas API A appears to be more cohesive. This correlates well with aerosolisation performance results and provides confidence in the technique.
The spatial resolution of the method is not optimized for imaging of API particles ≤ 5 microns – hence the size distributions cannot be produced.
Overall, the Raman global illumination method is identified as a very useful means of DPI blend characterization, especially when combination formulations are concerned. This technique allows for reasonably quick analysis that requires small quantities of materials. A medium to strong Raman signal from both APIs was achieved in all samples, which ensures the reliability of the corresponding chemical images.
References
- A. A. Gowen, C. P. O'Donnell, P. J. Cullen and S. E. J. Bell, Eur. J. Pharm. Biopharm., 2008, 69, 10 CrossRef CAS.
- J. Ling, in ‘Pharmaceutical Applications of Raman Spectroscopy’ S. Sasic ed., Wiley, Hoboken NJ, 2008 Search PubMed.
- H. M. Mansour and A. J. Hickey, AAPS Pharm Sci. Techn., 2007, 8, E1 Search PubMed.
- S. Ward, M. Perkins, J. Zhang, C. J. Roberts, C. E. Madden, S. Y. Luk, N. Patel and S. J. Ebbens, Pharm. Res., 1195, 2005, 22 Search PubMed.
- M. J. Henson and L. Zhang, Appl. Spectrosc., 2006, 60, 1247 CrossRef CAS.
- L. Zhang, M. J. Henson and S. S. Sekulic, Anal. Chim. Acta, 2005, 545, 262 CrossRef CAS.
- S. Šašić, D. A. Clark, J. C. Mitchell and M. J. Snowden, Analyst, 2004, 129, 1001 RSC.
- S. Šašić, Appl. Spectrosc., 2007, 61, 239 CrossRef CAS.
- S. Šašić, Pharm. Res., 2007, 24, 58 CAS.
- S. Šašić, D. A. Clark, J. C. Mitchell and M. J. Snowden, Analyst, 2005, 130, 1530 RSC.
- P. J. Treado and M. P. Nelson, in Handbook of Vibrational Spectroscopy, Vol. 2, ed. Chalmers, J. M; Griffiths, P. R.Wiley, New York 2001 Search PubMed.
- R. L. McCreery, Raman Spectroscopy for Chemical Analysis; Wiley, New York 2000 Search PubMed.
- W. H. Doub, W. P. Adams, J. A. Spencer, L. F. Buhse, M. P. Nelson and P. J. Treado, Pharm. Res., 2007, 24, 934 CrossRef CAS.
- S. Šašić and D. A. Clark, Appl. Spectrosc., 2006, 60, 494 CrossRef CAS.
- S. Šašić, Anal. Chim. Acta, 2008, 611, 73 CrossRef CAS.
- H. W. Frijlink and A. H. De Boer, Expert Opin. Drug Delivery, 2004, 1, 67 Search PubMed.
- R. J. Malcolmson and J. K. Embleton, PSST, 1998, 1, 394 Search PubMed.
- M. J. Telko and A. Hickey, J. Respir Care, 2005, 50, 1209 Search PubMed.
- P. M. Young and H.-K. Chan, et al, J. Pharm. Sci., 2007, 96, 1331 CrossRef CAS.
- A. Theophilus, A. Moore, D. Prime, S. Rossomanno, B. Whitcher and H. Chrystyn, Int. J. Pharm., 2006, 313, 14 CrossRef CAS.
| This journal is © The Royal Society of Chemistry 2010 |
