8-Hydroxyquinoline-5-sulfonic acid as the modifier for the determination of trace elements in cereals by slurry sampling electrothermal vaporization ICP-MS
Shih-Yi
Huang
and
Shiuh-Jen
Jiang
*
Department of Chemistry, National Sun Yat-sen University, Kaohsiung, 80424, Taiwan. E-mail: sjjiang@faculty.nsysu.edu.tw; Fax: +886-7-5253908
First published on 28th July 2010
Abstract
Ultrasonic slurry sampling electrothermal vaporization inductively coupled plasma mass spectrometry (USS-ETV-ICP-MS) has been applied to determine V, Cr, Co, Ni, Cu, Zn, Se, Cd, Hg and Pb in cereal samples. 8-hydroxyquinoline-5-sulfonic acid (8-HQ-5-SA) was used as the modifier to increase the volatility of the elements studied which makes the quantification possible using external calibration. The influences of instrument operating conditions and slurry preparation on the ion signals were studied to get better sensitivity of the elements studied and also similar sensitivity between slurry and aqueous solution. In this study, Cr, Cu, Zn and Se were determined under dynamic reaction cell (DRC) mode, while V, Co, Ni, Cd, Hg and Pb were determined under standard mode separately. The background ions at the masses m/z 52 and 80 were reduced in intensity significantly by using 1.0 mL min−1 CH4 as reaction cell gas in the DRC. This method has been applied to the determination of V, Cr, Co, Ni, Cu, Zn, Se, Cd, Hg and Pb in NIST SRM 1568a Rice Flour and SRM 1567a Wheat Flour reference materials and two cereal samples purchased from the local market. Analysis of the reference material agreed with the certified values. The results for the real world cereal samples were also found to be in good agreement with the pneumatic nebulization ICP-MS results of the sample solutions. The method detection limit was 1.3, 2.1, 3.6, 4.3, 6.8, 16, 1.7, 0.6, 0.8 and 2.6 ng g−1 for V, Cr, Co, Ni, Cu, Zn, Se, Cd, Hg and Pb, respectively, in original cereal samples.
Introduction
Most analyses by ICP-MS are carried out on solutions using a conventional pneumatic nebulizer. However the analytical tasks of ICP-MS can be extended using a number of other sample introduction techniques that are adaptable. Electrothermal vaporization (ETV) is one of the sample introduction techniques, which are currently employed in ICP-MS.1–9 This alternative technique to solution nebulization presents several advantages such as improved sensitivity and small sample size requirements, but perhaps the most notable benefit of ETV-ICP-MS is the possibility to perform solids analysis. Among the solid sampling methods slurry sampling has been utilized successfully in combination with electrothermal atomic absorption spectrometry (ET AAS)10–12 and ETV-ICP-MS.6–9 Though, ETV-ICP-MS has been used for many sample analyses, due to the difference in the sensitivity between slurry solution and aqueous standard solutions, a more tedious quantification method based on standard addition, has been used in many previous applications.13,14 However external calibration using aqueous standards has also been employed for some particular ETV-ICP-MS applications.4,15Rice and wheat are a basic and important food for the people of many different districts because it contains many necessary essential nutrients and micronutrients. However, environmental pollution can cause the cereal to contain toxic elements and then to produce detrimental effects on human health. Thus, the determination of trace elements in cereals in order to measure the concentration of essential elements for nutritional purposes and also the levels of toxic elements is important.
In this study, USS-ETV-ICP-MS is proposed as an alternative method for the determination of V, Cr, Co, Ni, Cu, Zn, Se, Cd, Hg and Pb in cereal samples. The determination of V, Cr, Co, Ni, Cu, Zn, Se and Cd by quadrupole ICP-MS might suffer from the high background problems. All the major isotopes of V, Cr, Co, Ni, Cu, Zn, Se and Cd are interfered by various background ions. Hence the determination of these elements in food stuffs by quadrupole ICP-MS is not an easy task. ETV sample introduction techniques have been employed to eliminate most of the oxide and hydroxide ion interferences in ICP-MS analysis.16,17 The alleviation of the oxide and hydroxide ion interferences could be due to the introduction of much drier aerosol with an ETV sample introduction device. The reaction cell and/or collision cell technique has proved to be an effective method for alleviating spectral interferences in the ICP-MS analysis.16,18–22 Li et al. successfully employed USS-ETV-dynamic reaction cell (DRC)-ICP-MS for the determination of Cr, Cu, Cd, Hg and Pb in rice by using NH3 as the reaction gas.22 CH4 was also used as the DRC reaction gas for the determination of Fe, Co, Ni, Cu and Zn in biological samples by USS-ETV-DRC-ICP-MS.16
In the present work, an USS-ETV-ICP-MS instrument and technique was employed for the determination of V, Cr, Co, Ni, Cu, Zn, Se, Cd, Hg and Pb in cereal samples with aqueous standards. The optimization of the USS-ETV-ICP-MS technique and its analytical figures of merit, as well as its application to the determination of V, Cr, Co, Ni, Cu, Zn, Se, Cd, Hg and Pb in cereal samples, are described in this paper.
Experimental
Apparatus and conditions
A Perkin-Elmer Sciex (Concord, Ontario, Canada) ELAN 6100 DRC II ICP-MS spectrometer equipped with a HGA-600MS electrothermal vaporizer was used. Pyrolytic coated graphite tubes with the same material platforms were used throughout. The transfer line consisted of a 90-cm-long, 6-mm-i.d. PTFE tubing. The sample introduction system included a Model AS-60 autosampler equipped with an USS-100 ultrasonic slurry sampler. Polystyrene autosampler cups were used. The USS-100 was set at 25 W (40% power), and a 5-s mix time was used to mix slurries before injection of 20-μL sample aliquots for the analysis.The ICP and DRC conditions were selected to maximize the ion signal-to-background ratios of the elements studied while a solution containing 1 ng mL−1 of these elements in 1% HNO3 was continuously introduced with the U-5000 AT+ ultrasonic nebulizer (CETAC, Omaha, NB, USA).23 The peak area of the transient signal was used for data handling. The ICP-MS and ETV operating conditions used throughout this work are summarized in Table 1 and Table 2, respectively.
| ICP mass spectrometer | Perkin-Elmer Sciex ELAN 6100 DRCII |
| outer gas flow rate/L min−1 | 15 |
| intermediate gas flow rate/L min−1 | 1.13 |
| carrier gas flow rate/L min−1 | 1.05 |
| RF power/kW | 1.10 |
| Data acquisition | |
| dwell time/ms | 10 |
| scan mode | peak-hopping |
| sweeps per reading | 2 |
| readings per replicate | 110 |
| signal measurement mode | integrated |
| isotopes monitored | 51 V, 52Cr, 53Cr, 59Co, 60Ni, 63Cu, 65Cu, 66Zn, 67Zn, 78Se, 80Se, 111Cd, 113Cd, 201Hg, 202Hg, 206Pb, 208Pb |
| DRC parameters | |
| cell gas | CH4 |
| cell gas flow rate/mL min−1 | 1.0 |
| Rpa | 0 |
| Rpq | DRC mode |
| Cr (0.6), Cu (0.75), Zn (0.8), Se (0.4), Sb (0.4) | |
| standard mode | |
| V, Co, Ni, Cd, Sb, Hg, Pb (0.25) | |
| axial field potential/V | 250 |
Reagents
Trace metal grade HNO3 was obtained from Merck (Darmstadt, Germany). 8-Hydroxyquinoline-5-sulfonic acid (8-HQ-5-SA) and Triton X-100 were procured from Koch-Light Limited (Haverhill, Suffolk, England) and Fluka (Buchs, Switzerland), respectively. Element standard solutions were obtained from Merck and Fisher (Fair Lawn, NJ, USA). Enriched isotope of 65CuO (99.7%) and 111CdO (96.4%) were purchased from the Oak Ridge National Laboratory (Oak Ridge, TN, USA) and 53Cr2O3 (96.9%), 67Zn (94.6%) and 201HgO (82.3%) were obtained from Cambridge Isotope Laboratories (Andover, MA, USA). 206Pb(NO3)2 was obtained from Merck. The concentrations of the spike solutions were verified by reversed spike isotope dilution ICP-MS.24 Owing to the mass discrimination effect, the intensities obtained during isotope ratio determination of each solution were used to calculate the isotopic abundance of each element.Slurry preparation
The applicability of the method to real samples was demonstrated by the analysis of NIST SRM 1568a Rice Flour reference material and 1567a Wheat Flour reference material (National Institute of Standards and Technology, USA) and rice and wheat flour samples purchased from the local market. The rice sample was ground by a Retsch MM2000 mixer mill and sieved by a Retsch VE1000 sieving machine (Retsch, Haan, Germany). The powders with particle size under 100 μm were collected for following experiments. Before weighing for analysis, the samples were dried as described in the Certificate of Analysis of reference materials.Various flour samples were analyzed by external calibration and isotope dilution methods. The slurry was prepared as the following procedure. A 0.1-g portion of the powder material was transferred into a 10 mL flask. Suitable amount of 8-HQ-5-SA and Triton X-100 were added to make the final solution containing 1% m/v cereal flour, 0.5% m/v 8-HQ-5-SA and 2% m/v Triton X-100. 2 ng mL−1 Sb was added to the slurries to work as internal standard. For isotope dilution quantification, the prepared slurries were spiked with suitable amounts of Cr, Cu, Zn, Cd, Hg and Pb enriched isotopes. The slurry was then sonicated for 10 min in an ultrasonic bath, and 1-mL aliquots were removed as needed for the analysis. A blank containing all reagents used for slurry preparation was carried through the procedure, as outlined above, to correct any analyte in the reagents used for sample preparation. The analyte concentration in the sample was then obtained from the calibration curves (5 points, 0.1–4 ng mL−1 for of V, Cr, Co, Ni, Se, Cd, Hg and Pb and 1–40 ng mL−1 for Cu and Zn) or calculated by the equation described in a previous paper.25 For the studies, the effects of ETV conditions and slurry preparations on the ion signals and signal ratios between slurry and aqueous solution, a wheat flour slurry sample was prepared as the procedure described above and spiked with 5 ng mL−1 of V, Cr, Co, Ni, Se, Cd, Hg and Pb and 2 ng mL−1 of Sb; meanwhile an aqueous solution containing the same amounts of elements studied as the slurry was also prepared.
Since there is no reference value for the real-world samples, in order to check the accuracy of the ETV-ICP-MS method, we need to compare the total analyte concentrations in the samples using the present procedure and complete dissolution method. Hence the samples were digested completely using the procedure mentioned below for the determination of the elements studied. The real-world samples (0.5 g) were weighed into closed Teflon PFA vessels and added 3 mL concentrated nitric acid. The mixtures were heated inside a CEM MARS 5 (CEM, Matthews, NC, USA) microwave digester to decompose the sample. The microwave digester was operated at a power 600 W (80%) and a pressure of 60 psi; the ramp time and the hold time were 20 min and 10 min, respectively. And then the solution was heated at 80 psi for another 30 min. The stock solutions were diluted to the appropriate volume followed by introduction into the ICP–MS for trace element determinations.
Results and discussion
Effect of slurry preparation on ion signal
In this study, several organic modifiers, including ammonium pyrrolidine carbodithioate (APDC), EDTA and 8-HQ-5-SA, were tested for best signals of the elements studied with USS-ETV-ICP-MS. From the experiments it was found that the signals of the elements studied increased slightly, furthermore, the sensitivity of the elements studied between the slurry and the aqueous solution was similar (ratio close to 1) when 1% m/v 8-HQ-5-SA was used as the modifier. For the simultaneous determination of these elements using external calibration 8-HQ-5-SA was selected as the modifier in this study. The pyrolysis temperature was set at 150 °C and the vaporization temperature was set at 1900 °C in this experiment. The effect of the amount of 8-HQ-5-SA on the ion signals and the signal ratio between slurry and aqueous solution was studied. From the experiments it was found that the signals of Zn, Cd, Hg decreased with the increase of 8-HQ-5-SA concentration. The signals of other elements increased slightly with the increase of 8-HQ-5-SA concentration. More important, as shown in Fig. 1 the ratios of the signals of elements studied were approaching 1 when 0.5% m/v 8-HQ-5-SA was used as the modifier. After evaluation, 0.5% m/v of 8-HQ-5-SA was selected in the following ETV-ICP-MS analysis. To reduce the background and to get the accurate results, the ICP-MS was operated under DRC mode in all experiments. 1.0 mL min−1 of CH4 was used as the reaction gas.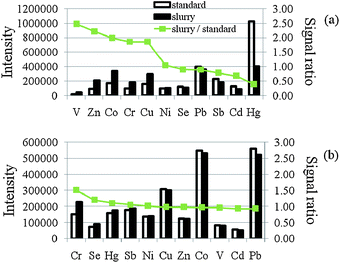 | ||
| Fig. 1 Effect of 8-HQ-5-SA concentration on the ion signals and signal ratio between slurry and aqueous solution; (a) 0% and (b) 0.5% m/v. Slurry solution contained 1% m/v wheat flour, 1% m/v Triton X-100 and spiked with 5 ng mL−1 of V, Cr, Co, Ni, Se, Cd, Hg and Pb and 2 ng mL−1 of Sb. Vaporization temperature was set at 1900 °C. | ||
Effects of other parameters of the slurry preparation on the ion signals were investigated in the following experiments. The effect of the concentration of Triton X-100 in the prepared slurry on the ion signals was studied in the range of 0–2% m/v. As shown in Fig. 2, the signals of most of the elements studied increased with the increase of Triton X-100 concentration. It could be due to the fact that Triton X-100 could also work as the physical carrier in this work. Furthermore as shown the signal ratios of the elements studied were close to unity when 2% Triton X-100 was used. It could be because the vaporization behavior of the elements studied in slurry and aqueous solution was getting similar when more surfactant was used. A solution of 2% m/v Triton X-100 was selected in the following experiments. The effect of the addition of acid and base in the prepared slurry on the ion signals was also studied. From the experiments, it was found that the addition of NH4OH could not improve the signals of the elements studied and the ion signal ratios. The signals of the elements studied decreased when HNO3 was added. It could be due to the decomposition of the metal complex. To simplify the slurry preparation and to minimize the blank signals, in the following experiments, no acid or base was used in slurry preparation. Another important factor in the slurry technique is the slurry concentration. The ion signals were decreased when the dilution factor was increased; on the other hand, the matrix effect was increased when the dilution factor was reduced, which makes the use of the external calibration method not possible. Dilution of the slurry can only be carried out within a limited range. The effect of slurry concentration on the ion signals was also studied. It was found that the sensitivity (counts/mass of sample) of the elements studied decreased with the decrease of dilution factor. In order to balance sample homogeneity, analyte signals, same sensitivity between slurry and aqueous solution and complete vaporization of introduced sample, a dilution factor of 100 (1% m/v) was used in the following experiments.
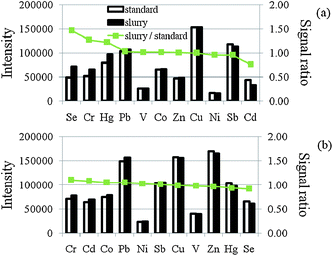 | ||
| Fig. 2 Effect of Triton X-114 concentration on the ion signals and signal ratio between slurry and aqueous solution; (a) 0% and (b) 2% m/v. Slurry solution contained 1% m/v wheat flour, 0.5% m/v 8-HQ-5-SA and spiked with 5 ng mL−1 of V, Cr, Co, Ni, Se, Cd, Hg and Pb and 2 ng mL−1 of Sb. Vaporization temperature was set at 1900 °C. | ||
Selection of vaporization temperatures
Fig. 3 shows the effect of the vaporization temperature on the ion signals of the elements studied. To avoid the vaporization loss of the analytes in the pyrolysis step, a relatively low pyrolysis temperature, 150 °C, was used in this study. From the experiments we found that the signals of V and Cr increased with the increase of vaporization temperature. However, as shown in Fig. 4, due to the vaporization of more matrix elements with the analytes, the signal ratios of Co and Cr were away from unity. In the following experiments, 1900 °C was selected as the vaporization temperature. The summary of the ETV operating conditions is listed in Table 2. As shown, a single firing can be completed in 3 min. Over all six firings (3 for standard mode and 3 for DRC mode) were required for each sample. It took about 18 min for one sample analysis.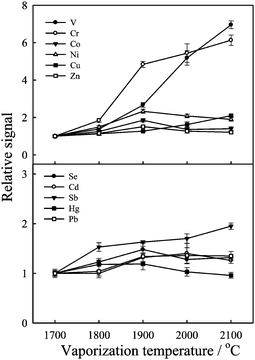 | ||
| Fig. 3 Effect of vaporization temperature on the ion signals. Slurry solution contained 1% m/v wheat flour, 0.5% m/v 8-HQ-5-SA, 2% m/v Triton X-100 and spiked with 5 ng mL−1 of V, Cr, Co, Ni, Se, Cd, Hg and Pb and 2 ng mL−1 of Sb. Ash temperature was set at 150 °C. Each data point represents the mean of five measurements ± standard deviation. All data were relative to the first point. | ||
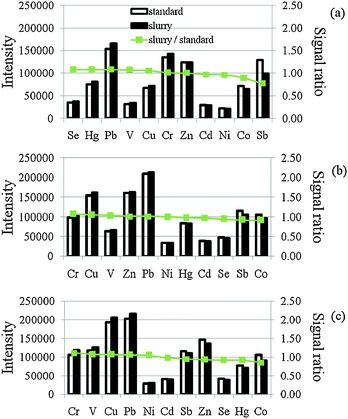 | ||
| Fig. 4 Effect of vaporization temperature on the ion signals and signal ratio; (a) 1800 °C (b) 1900 °C and (c) 2000 °C. Slurry solution contained 1% m/v wheat flour, 0.5% m/v 8-HQ-5-SA, 2% m/v Triton X-100 and spiked with 5 ng mL−1 of V, Cr, Co, Ni, Se, Cd, Hg and Pb and 2 ng mL−1 of Sb. Pyrolysis temperature was set at 150 °C. | ||
Selection of DRC ICP-MS conditions
The determinations of V, Cr, Co, Ni, Cu, Zn, Se and Cd by quadrupole ICP-MS are suffered from various polyatomic ion interferences. This means that the accurate determination of these elements in cereal could be difficult. Since the ETV sample introduction technique was employed in this work, the oxide and hydroxide ion interferences could be alleviated to an insignificant level.16 From the other experiment we found that the oxide and hydroxide ion interference has been alleviated 1–2 orders when ETV was employed as the sample introduction device. Furthermore, due to the difference in the volatility between Co, Ni, Cd and the other matrix elements Ca and Mo, the interference caused by CaO, CaOH and MoO, MoOH on Co, Ni and Cd determinations could be minimized by using a relatively low vaporization temperature. As shown in Fig. 5, most of the Ca and Mo were evaporated at the conditioning step (2500 °C), the interference caused by CaO and MoO on Co, Ni and Cd determinations could be minimized. In contrast, from the experiments, it was found that large backgrounds were observed at m/z 52 (40Ar12C+), 53 (40Ar12CH+), 64 (40Ar12C12C+), 78 (40Ar38Ar+) and 80 (40Ar40Ar+) at the vaporization and condition steps when the ICP-MS instrument was operated under the standard mode. CH4 has been used as the reaction gas for the determination of Cr, Fe, Zn, Co, Ni, Cu and Se by DRC-ICP-MS that reduced the high background.16,26,27 To determine Cr, Cu, Zn and Se simultaneously, CH4 was selected as the DRC reaction gas in this study. Effect of the CH4 flow rate on the background and analyte signal was studied. In order to eliminate the background efficiently and retain the analyte sensitivity of the elements studied, in the following experiments, a CH4 gas flow rate of 1.0 mL min−1 was selected. Other important cell parameters of the DRC system are the rejection parameters q and a. Cell parameters can be controlled to filter out unwanted precursors to eliminate new interferences created in the cell by reaction gas. In our previous study,16 a high q value was employed to minimize the [Ca + 17]+ interferences created in the cell by CH4 reaction gas. Furthermore, due to the high concentration of Cu and Zn in cereal samples analyzed, a relatively high q value was selected for these elements in this study. The value of rejection parameter q (Rpq) has been optimized to 0.6, 0.75, 0.8 and 0.4 for Cr+, Cu+, Zn+ and Se+, respectively. The Rpa value was set at 0 in this study. Although the reaction gas CH4 could alleviate the spectral interferences caused by most of the argide ions effectively, the side reactions caused by the reaction of CH4 with Ca and Mo ions in the reaction cell could produce new polyatomic ions which interfere in the determination of Co, Ni and Cd. To avoid these interferences, in the following experiments, V, Co, Ni, Cd, Hg and Pb were determined under the standard mode. The DRC ICP-MS conditions used in this study are listed in Table 1.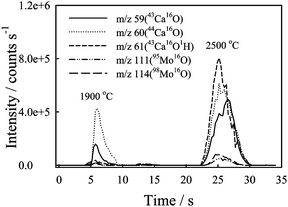 | ||
| Fig. 5 The vaporization behavior of Ca and Mo. The injected solution contained 100 μg mL−1 Ca, 1 μg mL−1 Mo, 0.5% m/v 8-HQ-5-SA and 2% m/v Triton X-100. Pyrolysis and vaporization temperature was set at 150 °C and 1900 °C, respectively. ICP-MS was under standard mode. | ||
Interferences
For ICP-MS analysis, the components of the sample could produce several metal oxide ions, metal hydroxide ions and other polyatomic ions, which interfere with the determination of analytes. In order to evaluate the significance of these interferences, the following experiments were performed to check the interferences caused by Na, Cl, Mg, S, Ca, Ti, Zn and Mo in the cereal samples. A wheat flour slurry was prepared as the method described previously. And then the prepared slurry solution was spiked with 100 μg mL−1 NaCl, 0.1% m/v MgSO4, 20 μg mL−1 Ca, 1 μg mL−1 of Zn and Mo and 2 μg mL−1 Ti. These slurries were injected for the determination of 52Cr/53Cr, 63Cu/65Cu, 66Zn/67Zn, 78Se/80Se and 111Cd/113Cd isotope ratios using ETV-DRC-ICP-MS. The isotope ratio was calculated from the peak areas of each injection peak. The spiked concentrations were much higher than the concentration of matrix elements in the prepared slurry solution. From the experiments we found that the isotope ratios of elements studied were not affected by Na, Cl, Mg, S, Ca, Ti, Zn and Mo at these concentrations in accordance with the Student's t-test for a confidence level of 95%. The alleviation of the interferences could be due to the application of DRC system and the introduction of much more dry aerosol with ETV sample introduction device. These experiments demonstrated that the concentration of V, Cr, Co, Ni, Cu, Zn, Se, Cd, Hg and Pb in the cereal samples can be determined directly by ETV-DRC-ICP-MS without significant interferences.Determination of trace elements in cereal
In order to validate the USS-ETV-ICP-MS method, the concentrations of V, Cr, Co, Ni, Cu, Zn, Se, Cd, Hg and Pb were determined in a rice flour and a wheat flour reference sample and two cereal samples purchased locally. The concentrations of V, Cr, Co, Ni, Cu, Zn, Se, Cd, Hg and Pb in these samples were determined by external calibration method with 2 ng mL−1 Sb as the internal standard to correct the possible signal drifting. Analysis results are shown in Table 3. The determined concentrations in the rice flour and wheat flour reference samples were in good agreement with the certified values. It is interesting to see that the pneumatic nebulization results of V, Co and Ni are higher than the certified values. It could be due to the spectral interferences caused by ClO+, CaO+ and CaOH+. However the ETV-ICP-MS results of the reference samples were agreed with the certified values in accordance with the Student's t-test for a confidence level of 95%. It demonstrated the effectiveness of the ETV system for the alleviation of oxide ion interferences. The Se result of SRM 1568a was lower than the certified value. However ETV-ICP-MS result was agreed with the result obtained by pneumatic nebulization DRC-ICP-MS of the digested sample solutions and LC-ICP-MS results.28 In case of real samples, for which no reference values are available, we digested these samples and analyzed the digested sample solutions by pneumatic nebulization ICP-MS. We found that the results were agreed with the ETV-ICP-MS results using external calibration and isotope dilution quantification methods. This experiment indicated that V, Cr, Co, Ni, Cu, Zn, Se, Cd, Hg and Pb in cereal could be readily quantified by the proposed USS-ETV-ICP-MS method. According to the regulations of Taiwan government, the maximum allowable concentration of Cd, Hg and Pb in rice is 0.5, 0.05 and 0.2 μg g−1 respectively. The concentrations of Cd, Hg and Pb in the analyzed rice samples are below the maximum allowable concentrations.| Sample | Methodb | Concentration/μg g−1 | |||||||||
|---|---|---|---|---|---|---|---|---|---|---|---|
| V | Cr | Co | Ni | Cu | Zn | Se | Cd | Hg | Pb | ||
| a Results are means of three measurements ± standard deviation. b Method 1: ETV-ICP-MS with external calibration. Method 2: ETV-ICP-MS with isotope dilution method. Method 3: determined by pneumatic nebulization DRC ICP-MS after sample dissolution. Certified: NIST certified values. c NA = not available. | |||||||||||
| SRM 1567a | Method 1 | 0.014 ± 0.002 | 0.022 ± 0.001 | 0.0063 ± 0.0005 | 0.044 ± 0.007 | 1.98 ± 0.03 | 11.5 ± 0.5 | 1.12 ± 0.04 | 0.025 ± 0.001 | < LOD | 0.016 ± 0.001 |
| Method 3 | 0.032 ± 0.005 | 0.021 ± 0.004 | 0.0095 ± 0.0018 | 0.077 ± 0.005 | 2.04 ± 0.02 | 11.3 ± 0.1 | 1.11 ± 0.05 | 0.024 ± 0.001 | < LOD | 0.017 ± 0.003 | |
| Certified | 0.011 | NA | 0.006 | NA | 2.1 ± 0.2 | 11.6 ± 0.4 | 1.1 ± 0.2 | 0.026 ± 0.002 | 0.0005 | < 0.020 | |
| SRM 1568a | Method 1 | 0.009 ± 0.001 | 0.027 ± 0.002 | 0.017 ± 0.001 | 0.102 ± 0.006 | 2.45 ± 0.05 | 19.6 ± 0.3 | 0.29 ± 0.01 | 0.023 ± 0.002 | 0.0058 ± 0.0005 | 0.011 ± 0.001 |
| Method 3 | 0.024 ± 0.001 | 0.027 ± 0.006 | 0.020 ± 0.001 | 0.156 ± 0.024 | 2.23 ± 0.09 | 18.6 ± 0.4 | 0.28 ± 0.02 | 0.020 ± 0.001 | 0.0063 ± 0.0003 | 0.009 ± 0.001 | |
| Certified | 0.007 | NA | 0.018 | NA | 2.4 ± 0.3 | 19.4 ± 0.5 | 0.38 ± 0.04 | 0.022 ± 0.002 | 0.0058 ± 0.0005 | <0.010 | |
| Wheat flour | Method 1 | 0.012 ± 0.003 | 0.020 ± 0.002 | 0.009 ± 0.001 | 0.034 ± 0.004 | 1.30 ± 0.04 | 4.07 ± 0.18 | 0.070 ± 0.003 | 0.013 ± 0.001 | 0.0010 ± 0.0004 | 0.018 ± 0.005 |
| Method 2 | NA | 0.018 ± 0.001 | NA | NA | 1.30 ± 0.09 | 4.08 ± 0.06 | NA | 0.013 ± 0.001 | 0.0009 ± 0.0004 | 0.017 ± 0.002 | |
| Method 3 | 0.029 ± 0.002 | 0.020 ± 0.003 | 0.010 ± 0.002 | 0.074 ± 0.003 | 1.28 ± 0.06 | 4.01 ± 0.04 | 0.069 ± 0.001 | 0.013 ± 0.001 | <LOD | 0.017 ± 0.008 | |
| Rice | Method 1 | 0.010 ± 0.001 | 0.020 ± 0.001 | 0.010 ± 0.001 | 0.153 ± 0.006 | 2.60 ± 0.13 | 12.2 ± 0.3 | 0.018 ± 0.001 | 0.027 ± 0.001 | 0.0009 ± 0.0003 | 0.009 ± 0.001 |
| Method 2 | NA | 0.019 ± 0.001 | NA | NA | 2.58 ± 0.16 | 12.1 ± 0.5 | NA | 0.026 ± 0.002 | 0.0010 ± 0.0004 | 0.009 ± 0.001 | |
| Method 3 | 0.022 ± 0.002 | 0.021 ± 0.003 | 0.012 ± 0.001 | 0.269 ± 0.002 | 2.53 ± 0.04 | 12.2 ± 0.2 | 0.016 ± 0.010 | 0.025 ± 0.007 | <LOD | 0.009 ± 0.007 | |
Detection limit estimated from calibration curve was about 0.013, 0.021, 0.036, 0.043, 0.068, 0.16, 0.017, 0.006, 0.008 and 0.026 ng mL−1 for V, Cr, Co, Ni, Cu, Zn, Se, Cd, Hg and Pb, respectively, which corresponding to 1.3, 2.1, 3.6, 4.3, 6.8, 16, 1.7, 0.6, 0.8 and 2.6 ng g−1, respectively, in original cereal samples. It was calculated based on the usual definition as the concentration of the analyte yielding a signal equivalent to three times the standard deviation of the reagent blank signal (n = 7).
Conclusion
The use of electrothermal vaporization dynamic reaction cell ICP-MS provides a simple, rapid and accurate technique to determine V, Cr, Co, Ni, Cu, Zn, Se, Cd, Hg and Pb in cereal samples without complicated sample pretreatment. The effectiveness of ETV sample introduction technique and dynamic reaction cell in alleviating various spectral interferences in ICP-MS analysis has been demonstrated. Compared to traditional sample preparation methods such as acid digestion and dry ashing, slurry sampling offers several benefits including reduced i) sample preparation time ii) sample contamination, and iii) analyte loss before analysis. The quantifications can be carried out using external calibration that alleviates the need for usual standard addition calibration.Acknowledgements
This research was supported by a grant from the National Science Council of the Republic of China under Contract NSC 97-2113-M-110-008-MY3.References
- M. Resano, F. Vanhaecke and M. T. C. de Loos-Vollebregt, J. Anal. At. Spectrom., 2008, 23, 1450–1475 RSC.
- M. Aramendía, M. Resano and Frank Vanhaecke, Anal. Chim. Acta, 2009, 648, 23–44 CrossRef CAS.
- M. Resano, M. Aramendia, W. Devos and F. Vanhaecke, J. Anal. At. Spectrom., 2006, 21, 891–898 RSC.
- M. Aramendia, M. Resano and F. Vanhaecke, J. Anal. At. Spectrom., 2009, 24, 41–50 RSC.
- B. U. Peschel, W. Herdering and J. A. C. Broekaert, Spectrochim. Acta, Part B, 2007, 62, 109–115 CrossRef.
- Y. F. Zhang, Z. C. Jiang, M. He and B. Hu, Environ. Pollut., 2007, 148, 459–467 CrossRef CAS.
- S. M. Maia, D. Pozebon and A. J. Curtius, J. Anal. At. Spectrom., 2003, 18, 330–337 RSC.
- N. J. Miller-Ihli and S. A. Baker, Spectrochim. Acta, Part B, 2001, 56, 1673–1686 CrossRef.
- L. F. Dias, G. R. Miranda, T. D. Saint'Pierre, S. M. Maia, V. L. A. Frescura and A. J. Curtius, Spectrochim. Acta, Part B, 2005, 60, 117–124 CrossRef.
- I. Lopez-Garcia, R. E. Rivas and M. Hernandez-Cordoba, Anal. Bioanal. Chem., 2008, 391, 1469–1474 CrossRef CAS.
- M. L. Munoz and A. J. Aller, J. Anal. At. Spectrom., 2006, 21, 329–337 RSC.
- M. Felipe-Sotelo, M. J. Cal-Prieto, M. P. Gomez-Carracedo, J. M. Andrade, A. Carlosena and D. Prada, Anal. Chim. Acta, 2006, 571, 315–323 CrossRef CAS.
- P.-C. Li and S.-J. Jiang, Anal. Bioanal. Chem., 2006, 385, 1092–1097 CrossRef CAS.
- J.-L. Ni, C.-C. Liu and S.-J. Jiang, Anal. Chim. Acta, 2005, 550, 144–150 CrossRef CAS.
- A. G. Coedo, T. Dorado, I. Padilla, R. Maibusch and H. M. Kuss, Spectrochim. Acta, Part B, 2000, 55, 185–196 CrossRef.
- Y.-J. Tseng, Y.-D. Tsai and S.-J. Jiang, Anal. Bioanal. Chem., 2007, 387, 2849–2855 CrossRef CAS.
- H.-C. Liao and S.-J. Jiang, J. Anal. At. Spectrom., 1999, 14, 1583–1588 RSC.
- S. D. Tanner and V. I. Baranov, At. Spectrosc., 1999, 20, 45–52 CAS.
- K. Neubauer and U. Vollkopf, At. Spectrosc., 1999, 20, 64–68 CAS.
- S. D. Tanner, V. I. Baranov and U. Vollkopf, J. Anal. At. Spectrom., 2000, 15, 1261–1269 RSC.
- Y.-L. Chang and S.-J. Jiang, J. Anal. At. Spectrom., 2001, 16, 858–862 RSC.
- P.-C. Li and S.-J. Jiang, Anal. Chim. Acta, 2003, 495, 143–150 CrossRef CAS.
- C.-Y. Ho and S.-J. Jiang, Spectrochim. Acta, Part B, 2003, 58, 63–70 CrossRef.
- C.-C. Chang and S.-J. Jiang, J. Anal. At. Spectrom., 1997, 12, 75–80 RSC.
- K.-S. Lee, S.-J. Jiang and H.-W. Liu, J. Anal. At. Spectrom., 1998, 13, 1227–1231 RSC.
- K.-L. Chen and S.-J. Jiang, Anal. Chim. Acta, 2002, 470, 223–228 CrossRef CAS.
- Y.-J. Tseng, C.-C. Liu and S.-J. Jiang, Anal. Chim. Acta, 2007, 588, 173–178 CrossRef CAS.
- C.-Y. Tsai and S.-J. Jiang, manuscript in preparation.
| This journal is © The Royal Society of Chemistry 2010 |