Amperometric measurement of gaseous hydrogen sulfide via a Clark-type approach†
Jason J.
Horn
,
Tom
Mccreedy
and
Jay
Wadhawan
*
Department of Physical Sciences (CHEMISTRY), The University of Hull, Cottingham Road, Kingston-upon-Hull, HU6 7RX, United Kingdom. E-mail: j.wadhawan@hull.ac.uk; Web: http://www.hull.ac.uk/chemistry/wadhawan Fax: +44 (0) 1482 466 416; Tel: + 44 (0) 1482 466 354
First published on 10th August 2010
Abstract
The direct oxidation of hydrogen sulfide in the range 2.0–20 parts per million by volume (ppmv) using a Clark-type amperometric gas sensing methodology is investigated via amperometric transients at 298 K. The diluent gas employed is air (20.9% O2 in N2), and it is shown that the observed current transients are limited by transport through the membrane covering, reaching a steady-state value within at least 200 s for one of the manifestations described. The measurement system presented is shown to be operational over a long time (tens of hours), provided certain quantification protocols are employed; the latter are suggested as pragmatic guidelines for the deployment of this detection methodology. Importantly and notably, it is shown that readily-oxidizable gases such as carbon monoxide and molecular hydrogen are observed not to interfere with the measurement quantification.
1. Introduction
Hydrogen sulfide is a toxic compound which exists within the Earth's atmosphere in gaseous form, particularly around fumaroles1a and industrial cities,1b within the hydrosphere in gas and aqueous form, especially in anaerobic environments such as those afforded within the Black Sea (42°–45° N 28°–41° E),1c and the so-called oceanic “black smokers”,1d and within the lithosphere, in, for example, sub-surface hydrocarbon reservoirs.1e Detection of this gas within these extreme environments is important for a whole host of applications.2 At 298 K, gaseous hydrogen sulfide dissolves slowly in water to furnish a solution of maximal concentration ca. 0.1 M, which is weakly acidic (pKa1 = 6.88, pKa2 = 14.15).2 Evolution has, accordingly, enabled human olefaction of this pungent gas at concentrations as low as 0.02 ppmv (830 pM) in air. Given that hydrogen sulfide acts as a cellular poison at concentractions around 5 ppmv, it is desirous to be able to undertake quantitative H2S monitoring in gaseous air samples close to, or below, the 1 ppmv level (corresponding to a concentration of gas in air of up to ca. 42 nM).2Sensing protocols for H2S involve the use of a variety of analytical techniques (such as colorimetric, spectroscopic and electrochemical), predominantly within liquid media.2 For the gas phase, galvanic systems3a,b (with detection in the range 0.1 ≤ p(H2S)/ppmv ≤ 300) or solid state devices involving resistance changes within thin layers have been developed.3c These methods, however, have their own intrinsic limitations as a result of variation in temperature or humidity, as well as in response time.3d Accordingly, there has been much interest in the use of amperometric measurements for H2S monitoring, primarily since the redox catalytic chemistries employed in the galvanic H2S sensors may be directly translated for rapid and online solution-phase detection, employing the classical sigmoidal voltammogram, with temporally-independent plateau current, as the sampled quantitative measurement. Indeed, Lawrence and co-workers4 adapated their EC2xE sulfide sensing redox system5 to afford a Clark-type probe6 for H2S, using a microelectrode working electrode, capitalising on the small diffusion layer of the latter under diffusion steady-state, such that the amperometric response is not rate-limited by membrane diffusion. One drawback of this type of system is that because the reaction chemistry is governed by a bimolecular reaction, it may be unsuitable for very low levels of H2S, since the characteristic measurement potential may shift with analyte concentration.7
Accordingly, we sought to identify other methods for H2S electroanalysis over the range 2.0 ≤ p(H2S)/ppmv ≤ 20, in particular the use of direct methods for hydrogen sulfide sensing,2 such as the employment of a Clark-type system to measure the oxidation of H2S, given that earlier work by Hitchman8a and Mancy8b demonstrated that H2S interferes with the measurement of dissolved oxygen concentration in membrane-covered amperometric oxygen detectors due to “electrode poisoning”,6a with the effect being most significant for silver, less for platinum and least for gold electrodes. Schiavon et al.,9 elegantly exploited this tarnishing of silver electrodes by hydrogen sulfide gas to develop a membrane-free amperometric solid polymer electrolyte system suitable for the fast and sensitive H2S detection with the electrochemical reduction of protons released into a solid polymer electrolyte serving as the counter electrode process, with the sensing signal being as follows.
| Ag(s) + H2S(g) → Ag2S(s) + 2H+(polymer) + 2e− | (1) |
Given that H2S adsorption on silver is dissociative,10 the amperometric oxidation measured is really that corresponding to H-atom oxidation. This means that molecular gases such as dihydrogen (which also undergoes dissociative adsorption) may actually interfere with the analytical measurement, even though these have not been tested.
We chose to adapt this type of approach for the development of a Clark-type detection protocol for gaseous H2S diluted by air, since this represents a more realistic environmental sensing challenge; we are unaware of any similar measurement protocol within the literature. Although our system, which employs electrodes of millimetric dimensions, is limited by transport through the membrane, we demonstrate that our approach can measure hydrogen sulfide comfortably within the mixing ratios required for environmental monitoring purposes,2 and that for certain electrode/membrane combinations, the observed current, on H2S concentration pulsing, is able to reach its limiting value in about 200 s, for one adaptation of the sensing design.
2. Experimental
Chemical reagents
Gases were purchased from BOC Gases, UK and diluted as appropriate before use. All other chemical reagents were purchased from Sigma-Aldrich in the purest commercially-available grade, and used as received. Water, with a resistivity of not less than 18 MΩ cm, was taken from an Elgastat system (Vivendi, Bucks., UK).Instrumentation
Electrochemical measurements were undertaken in a conventional three-electrode mode, using a commercially-available potentiostat (Palmsens, Palm Instruments, The Netherlands) controlled by a computer. The electrochemical cell, constructed from acetal(polyoxymethylene) employed is schematically depicted (with dimensions) in Fig. 1 and was used throughout the experiments reported in this work after placement in an oven thermostatted at 298 K, which had been positioned inside a fume cupboard. The cell itself was held vertically throughout the work reported herein, and was made water-tight via the use of screw-connections, o-rings and polytetrafluoroethylene (PTFE) tape as appropriate. The body of the cell housed the aqueous electrolyte solution employed throughout this work: 0.1 M phosphate buffer containing 0.1 M KCl at pH 6.5, kept so that there would be a large mole fraction of undissociated H2S in solution on its introduction. Note that the large volume of liquid contained therein is gravitationally sufficient to overcome any potential problem of evaporation of solvent within membrane pores (and concomitant formation of potentially blocking salt crystals). The presence of chloride in the electrolyte allowed the silver | silver chloride reference electrode, constructed by oxidising a silver wire in saturated aqueous potassium chloride for ten minutes using a 9.0 V battery, to take a potential of +0.29 V vs. SHE.11 Although this electrode was remade for every experiment, so as ensure reproducibility within the data, by avoiding drifting due to the possible formation of silver sulfides, it will be shown that it is not prone to drift during operational lifetimes of up to ca. 27 h (q.v.Fig. 3). This nuance is due to slow solution diffusion of sulfur species in the bulk electrolyte. A counter electrode (of surface area 24.6 cm2, and thickness 0.2 mm) made from papyex (a form of basal plane graphite – see Figure S1 of the Electronic Supplementary Information for SEM image; EDX microanalysis suggests C:O ratio of 98%:2% with trace sulfur, and was obtained from Le Carbone GB Ltd, East Sussex, UK) was allowed to wrap around the cylindrical interior of the cell, so as to provide a sufficiently large surface area, with the electrochemical connection being made using carbon fibre (made from carbon fibre yarn 200 Tex constructed from filaments of 7 μm diameter, obtained from Advent Research Materials, Oxford, UK).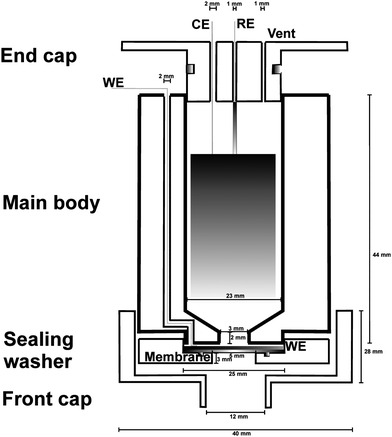 | ||
| Fig. 1 Schematic, and partially exploded, cross-sectional diagram (not to scale) of the cylindrical electrochemical cell employed within this work. The cell consists of four main parts: the front cap shields the membrane and electrochemical cell from convective perturbations in the external environment that would otherwise lead to reduced signal-to-noise ratios; the sealing washer houses the gas-permeable membrane on top of which is placed the working electrode (WE); the main body is a chamber which contains the aqueous electrolyte and the counter (CE) and reference (RE) electrodes; the end cap seals the electrochemical cell and is pierced by holes to make connection to the RE and CE, and a vent to keep the pressure inside the cell in equilibrium with that of the external environment (note that the cell is sufficiently large so that diffusion of H2S from the point of direct entry into the electrolyte solution would not affect the observed amperometry on the timescales of the experiments reported). All four main parts screw into each other, with washers employed to maintain tight connection. Note that the cell is filled with electrolyte solution such that the electrical connections to the CE and RE are not in contact with the solution, and such that a thin layer of electrolyte may exist between WE and membrane; pari passu the sealing washer and main body are tightened to keep solution away from the connection to the WE. | ||
The working electrode was positioned as close to the bottom of the cell as possible so that it was physically close to the gas-permeable membrane, and was constructed so that it could be porous, so that a thin film (size undetermined) of electrolyte could exist between the membrane and the electrode, whilst allowing the possible formation of a three phase junction.12 Unless explicitly mentioned otherwise, the working electrode was cleaned before each experiment using increasingly finer grades of carborundum paper (Presi, France), followed by immersion in either cold aqua regia, or 10% HNO3, so as to ensure that electrode history effects would not obscure the observations reported herein. The size of the working electrode closest to the gas-permeable membrane was a circular disk of 5.0 mm diameter; that exposed to the bulk aqueous electrolyte was a circular disk of 3.0 mm diameter. Note that the larger area exposed towards the membrane was motivated by signal-to-noise ratio considerations. For the flat and planar electrodes employed (vide infra) these are the dimensions of the exposed working electrode – the sizes reported below and in § 3 for this case are the actual dimensions of the electrode disks used, from which it becomes apparent that significant portions of the electrode were not exposed to either gas or aqueous solution. For the spiral electrodes employed (vide infra), the above dimensions represent the windows to gas and aqueous solution. Materials employed as the working electrode were either a 12 mm diameter papyex disc electrode (of 0.2 mm thickness) that had been pierced six times with a 127 μm (diameter) platinum needle so as to enhance the porosity of the soft papyex material, thereby encouraging, and maintaining, the formation of a thin electrolyte layer between the electrode and the membrane, or a 12 mm diameter carbon fibre mesh (of 20 μm thickness, obtained from Hansell Composites, Ltd., Stokesley, UK – see Figure S2 of the Electronic Supplementary Information for an SEM image; EDX microanalysis suggests C:O ratio of 96%:4% with trace sodium) or a 3 mm (outer diameter) spiral of 127 μm diameter platinum wire (obtained from Sigma-Aldrich, UK). The area of the platinum electrode exposed to the electrochemical cell was determined in several voltammetric experiments in which the aqueous electrolyte additionally contained millimolar aqueous ferrocene monocarboxylic acid, via extraction on a Randles-Sevčik plot, using a diffusion coefficient13 of 5.8 × 10⁻⁶ cm2 s−1. This was found to be ca. 0.05 cm2 for the majority of the experiments using this electrode reported herein; changes in the latter were observed to give rise to differences in the currents flowing, as expected. Note that a platinum mesh was not employed, as we wished the electrochemical cell assembly to have minimum financial cost in construction. Electrical connection to the carbonaceous materials was achieved either using a platinum wire pressed onto a piece of papyex not exposed to the electrochemical cell but in contact with either the papyex working electrode or the carbon fibre mesh electrode, and screwed into place, or via a carbon fibre tow, weaved into the mesh in an area not exposed to the electrochemical cell.
Various gas-permeable membranes were employed throughout the work reported herein consisting of a 150 μm thick, 25 mm diameter polypropylene membrane with maximal pore size of 10 μm (supplied by Millipore, UK as 100% polypropylene prefilter AN1H02500, now commercially obsolete, but sufficiently porous to be suitable for pre-filtration of aqueous solutions only when the hydrophobic material is properly wetted with alcohol; this latter part was not undertaken so as to retain the aqueous solution within the electrochemical cell), or a polydimethylsiloxane (silicone; ref. 6a reports that this material allows 6.7 × 10⁻⁸ cm3 of O2 at STP to permeate a 1.0 cm thickness of the membrane per square centimetre per second with a pressure drop of 1.0 cm Hg across the membrane when there is gas on both sides of the membrane, and that this value is 4.0 × 10⁻⁷ cm3 cm cm−2 s−1 (cm Hg)−1 when there is dissolved aqueous O2 on both sides of the membrane) microsheet cut to afford a 24 mm diameter disk of 50 μm thickness (obtained from Speciality Silicone Fabricators, Paso Robles, California, through MER-Europe), or a 24 mm diameter disk cut from a 47 mm diameter disc of a polypropylene-backed PTFE membrane filter (130 μm thickness, 72% porosity, 0.2 μm maximal pore size) manufactured by Whatman, purchased from Camlab, UK (part number WN/7582-004), or a 30 μm thick PTFE membrane supported by a PTFE mesh (q.v. Figure S3 of the Electronic Supplementary Information for SEM image; EDX microanalysis suggests C:F ratio of 15%:85% with trace silicon) with maximal pore size of ca. 10 μm, supplied by Analox Sensor Technology, Ltd., Stokesley, UK.
Gas mixtures were prepared by diluting the relevant gases using a Stec SGD-710C gas divider accurate to within 0.1 ppmv supplied by Stec Inc, Kyoto, Japan, such that the overall gas pressure was kept at 1.0 bar, and were introduced into the oven into which the electrochemical cell had been assembled.
Scanning electron microscopy (SEM) was undertaken using a Zeiss EVO 60 0.2–30 kV scanning electron microscope (with 2 nm resolution) equipped with an Oxford Instruments INCA Energy 350 X-ray spectrometry for energy dispersive X-ray microanalysis (EDX).
3. Results and discussion
Fig. 2 illustrates cyclic voltammograms at a scan rate of 0.01 V s−1 at a polycrystalline platinum spiral electrode, positioned as close to the gas-permeable membrane as possible, and immersed in 0.1 M phosphate buffer containing 0.1 M KCl at pH 6.5, employing a silicone membrane (of diameter 2.4 cm and thickness of 50 μm). The initially polished electrode is first subjected to a sample of air (20.9% O2 in N2) before the voltammogram is undertaken. It is clear that within the potential window employed, there is little signal except that anticipated from the residual pseudocapacitance, with hysteresis between the forward and reverse scan due to uncompensated solution resistance effects giving rise to a characteristic time constant; the data are not corrected for any Ohmic loss. After the introduction of 20 ppmv H2S (with air as the balance gas), the voltammetry retains a similar form, except that the slope for both forward and reverse scans is different compared to the case when the H2S is absent. The linearity in these current–voltage slopes, suggests that the observed impedance changes from between 7–8 MΩ (in the absence of H2S) to 4–5 MΩ (when H2S is present). Whilst H2S adsorption on platinum would be anticipated to partially block the electrode, leading to reduced currents,14 this behaviour is reminiscent of a Faradaic-type process occurring in the presence of H2S, and given the absence of defined voltammetric waves, suggests that this may be a surface-confined Faradaic reaction, as suggested in other work on the behaviour of H2S at platinum electrodes immersed in acidic solution.15 Re-equilibration of the electrochemical cell environment with air only, enables the initial voltammetric profile to be essentially retraced; after subsequent equilibration with 100 ppmv H2S (with air as the balance gas) again affords a similar decrease in the apparent estimated impedance. Inasmuch as the observed voltammograms give rise to small, yet pronounced, changes in the presence of H2S, it is notable that the signals increase with H2S concentration, and that removal of the H2S source allows the re-tracing of the initial voltammogram.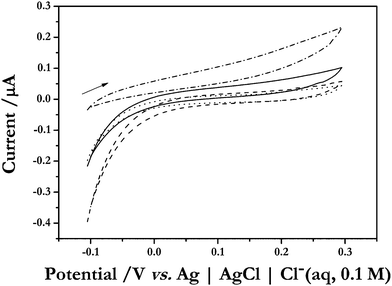 | ||
| Fig. 2 Cyclic voltammograms (scan rate of 0.01 V s−1) observed when a polycrystalline platinum spiral electrode is employed as working electrode placed in the electrochemical cell containing 0.1 M phosphate buffer solution with 0.1 M KCl at pH 6.5, with a 50 μm thick silicone membrane. The electrode was initially cleaned and polished as outlined in § 2. First, air (20.9% O2 in N2) is introduced into the gaseous environment surrounding the cell to afford the dashed-line voltammogram after equilibration, then, without cleaning the electrode, 20 ppmv H2S is introduced, which, after equilibration furnished the solid-line voltammogram. Subsequent equilibration with air yielded the voltammogram drawn with a dotted line; after equilibration with 100 ppmv H2S (again without cleaning the electrode) allowed the voltammogram drawn with a dot-dashed line to be observed. The arrow represents the direction of the initial potential sweep. | ||
In order to examine this further, transient currents were recorded, at constant applied potential, with step changes in the H2S concentration. Fig. 3a illustrates the temporal dependence of the current when a polycrystalline platinum electrode, potentiostated at 0.0 V vs. Ag | AgCl |Cl−(aq, 0.1 M), is employed together with a 150 μm thick polypropylene membrane (24 mm in diameter), with the ambient gaseous environment of the electrochemical cell pulsed between air (20.9% O2 in N2), and 20 ppmv H2S in air. In the absence of H2S, the observed background current, presumably pseudocapacitative, tails to a residual baseline. As the time taken for this to occur varied between experiments, we chose to allow the system to settle to an observed steady-state for typically ca. 0.5 h before experimentation in the presence of H2S. On introduction of 20 ppmv H2S, an oxidation current flows between the platinum electrode and the phosphate-buffer bathed papyex working electrode. This current has the general transient shape of a dramatic increase which subsequently reaches to 90% of a steady-state value, typically within 90 s. The switching of the gas input into the electrochemical cell to H2S-free air, causes a direct reduction in the observed current, which is as dramatic as the oxidation rise, and which tails to 90% the original baseline within 120 s. This behaviour, as in the case of the voltammetry reported above, is reproducible in the presence and absence of hydrogen sulfide over the duration of experimentation, with the waveshape generally retaining and sustaining its square waveform, even after a 16 h exposure to H2S, as depicted in Fig. 3b, and over different experiments (panels a–d in Fig. 3 derive from different experiments), provided the electrode is cleaned and polished as outlined in § 2, before it is employed in the experiments, and also only if air is employed as the balance gas.16
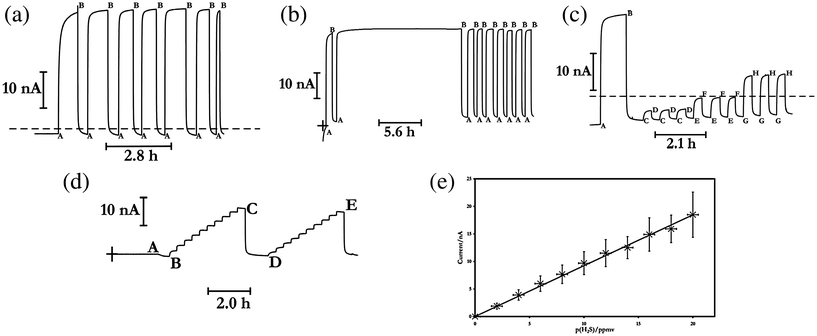 | ||
| Fig. 3 Typical and representative amperometric traces (solid lines, moving from left to right) illustrating the effect of adding hydrogen sulfide to an air gas mix (oxygen and nitrogen – see text for exact ratios) when the electrochemical cell employed a platinum spiral working electrode, and a 150 μm thick polypropylene membrane, with the electrode potentiostatted at 0.0 V vs. Ag | AgCl | Cl−(aq, 0.1 M). The dashed line in panels (a) and (c) marks the 0.0 A current level; this is shown in panel (b) by cross-hairs. In panels (a)-(c), before point A, the system was allowed to stabilise in air, at the points marked as A, 20 ppmv H2S is introduced to the gas stream supplied to the electrochemical cell; at the points marked as B, only the balance gas (no H2S) is supplied. In panel (c), at points C, E and G, 2.0, 4.0 and 8.0 ppmv H2S is contained within the gas stream, respectively; at points D, F and H, air not containing H2S is introduced. Panel (d) illustrates typical and representative baseline-corrected amperometric traces (solid lines, moving from left to right) illustrating the effect of adding hydrogen sulfide to an air gas mix (oxygen and nitrogen – see text for exact ratios) via a series of standard additions. Before point A, the cell was left to stabilise in the atmosphere of the thermostatted oven. At points A, C and E, the air mixture reported in the main text is introduced to the cell. At points B and D, increasing additions of H2S from 2.0–20 ppmv in steps of 2.0 ppmv are admitted into to the gas stream supplied to the electrochemical cell assembly. The cross-hairs mark the zero current level in panel (d). Panel (e) depicts the variation in the observed steady-state current with partial pressure of H2S. Data points plotted are arithmetic mean values from eight separate experiments similar to those depicted in panel (d). Error bars are plotted for ordinate (one standard deviation) and abscissa. Regression analysis of the average data affords the line drawn with sensitivity of 0.9233 nA (ppmv)−1, and with Pearson's product-moment correlation coefficient of 0.9980. Note that except for the second trace illustrated in panel (d), the working electrode was cleaned and polished, and the system allowed to equilibrate for at least 30 min with the air gas mix before data were recorded. | ||
To ascertain whether the observed amperometric oxidation can be used for electroanalytical purposes, experiments were undertaken at variable H2S concentrations (q.v.Fig. 3c). It is clear from these data that first, gas concentrations even at the 2.0 ppmv level are comfortably measured reproducibly, and that the amperometric signal increases in proportion with the change in gas concentration. In order to explore this further, amperometric analysis using the method of standard additions of H2S concentration in the gaseous atmosphere surrounding the electrochemical cell were undertaken, as illustrated in Fig. 3d and 3e (the data presented in panel e are averaged arithmetically over eight separate experiments, with the polycrystalline platinum electrode being polished before each experiment commenced), with a 150 μm thick polypropylene membrane used. There is a linear increase in the apparent steady-state current with H2S concentration, as anticipated based on Henry's Law, demonstrating the versatility of this type of measurement protocol for gas sensing. It is, however, noticeable that in these standard addition plots, the current at the higher H2S concentrations appears to fall with time. This is especially noticeable as well between two concurrent sets of standard addition experiment (such as between points C and D in Fig. 3d) when the electrode has not been rigorously cleaned before experimentation. Since such effects are not seen to any significant degree in the data reported in Fig. 3a–c, it suggests that they most likely represent artefacts resulting from electrode history15,17 – in the standard addition experiment, the gas concentrations keep increasing with time, as opposed to a more tempered exposure via pulsing between H2S absence and presence. Consistent with this is the observation that voltammograms of aqueous ferrocene monocarboxylic acid (not shown) before and after the standard addition experiments of hydrogen sulfide to the electrochemical cell, changed, with the latter furnishing peak oxidation potentials shifted towards more positive values by ca. 50 mV for a scan rate of 0.1 V s−1, indicative of a response of a partially-blocked electrode.14
Although the direct oxidation of hydrogen sulfide to form sulfur, thiosulfate and sulfate by oxygen in aqueous solution has been reported, this is thought to be catalysed by trace metal ions.18 Thus, assuming that such autooxidation processes do not occur within our system, and based on earlier work regarding the oxidation of H2S in acidic aqueous solution,8,15 we suggest that the observed amperometric signal is due to the following global reaction.
| Pt(s) + H2S(g) → PtS(s) + 2H+(aq) + 2e− | (2) |
This reaction affords a standard electrode potential19a of ca. + 0.22 V vs. SHE (based on19b values of −76.1 kJ mol−1 and −33.4 kJ mol−1 for the Gibbs energy of formation of crystalline PtS and gaseous H2S respectively at 298 K). This potential takes on a value of approximately zero for a standard Ag/AgCl reference electrode,19c (or a value close to −0.4 V vs. Hg | Hg2SO4, as used in the previous work on silver electrodes9). Albeit that this type of global analysis will be affected by changing the thermodynamic state of the hydrogen sulfide from gaseous to aqueous, and also by differences in surface versus bulk platinum sulfide, reaction (2) is, nevertheless, a plausible rationalisation of the observed current flowing on introduction of hydrogen sulfide into the system, and allows for the electrode surface to become partially blocked by a sulfur layer which is thought to be “poorly conducting” in highly alkaline electrolytes.17 However, given the voltammograms reported above, and following other literature observations and suggestions,15 we suggest the global reaction occurs via a series of steps involving adsorption of H2S (and HS−) in gas and aqueous forms onto the electrode surface, and the subsequent dissociation and oxidation of these species.15
To examine this global reaction, we chose to change the electrode substrate, as this is one method of changing the applied potential to the electrode, albeit at the cost of altering any chemisorption process. Fig. 4a shows standard additions of H2S when a 12 mm diameter planar piece of cleaned and polished papyex is employed as the working electrode (again potentiostatted at 0.0 V vs. Ag | AgCl |Cl−(aq, 0.1 M)) within the electrochemical cell, and again positioned as close as possible to the gas-permeable membrane as possible, and when a 150 μm thick polypropylene membrane (24 mm in diameter) is used. It is clear from these data that the observed augmentation of the current again occurs, in a linear fashion, in the presence of increasing amounts of H2S, but also that electrode history effects do occur. The former is a remarkable observation, given that papyex is a form of basal plane pyrolytic graphite,20a which is known to have a very low density of states near the Fermi Level.20b Nevertheless, it is important to note that the use of a planar material for the working electrode actually decreases the response time of the electrochemical measurement to the gas present in the cell environment (taking approximately 200 s to yield the steady-state limiting current), as expected if mass transport to the working electrode rate limits the Faradaic process.6 Similar effects were observed when a carbon fibre mesh (of similar dimensions) was employed as working electrode (data not shown), and also when this mesh was threaded intermittently with platinium wire (data not shown). Note that, following an Einstein-Smoluchowski approach, the difference in the response time between the data in Fig. 3 and 4a suggest that the thickness of the electrolyte film between the working electrode and membrane is a crucial and controlling parameter, with the smaller thickness (occurring at the papyex cf. platinum spiral electrodes) leading to faster response times.
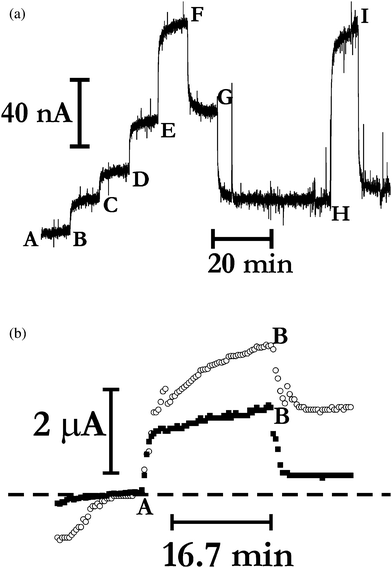 | ||
| Fig. 4 (a) Current transients observed when the electrochemical cell employed a papyex disk working electrode behind a 150 μm thick polypropylene membrane, with the electrode potentiostatted at 0.0 V vs. Ag | AgCl | Cl−(aq, 0.1 M). At points A, G, and I, the gaseous environment surrounding the electrochemical cell consists of tha air gas mix outlined in the text; points B and C are the times at which 2.0 ppmv and 4.0 ppmv H2S are respectively introduced into the gaseous environment; points D and F are when the cell was exposed to 8.0 ppmv H2S, and 16.0 ppmv H2S at points E and H. In all cases the balance gas was air. Note that point A marks the position of zero current. (b) Current transients observed (using the sampling regime outlined in the text) when the electrochemical cell employed a carbon fibre mesh working electrode (connected electrically via a papyex ring and platinum wire) and a 30 μm thick PTFE membrane, with the electrode potentiostatted at 0.0 V vs. Ag | AgCl | Cl−(aq, 0.1 M). The data points at 0.0 V vs. Ag | AgCl | Cl−(aq, 0.1 M) are plotted as open circles; those at 0.5 V vs. Ag | AgCl | Cl−(aq, 0.1 M) take the form of filled squares. Before point A, the electrochemical cell was in equilibrium with the air gas mix outlined in the main text; at point A, 100 ppmv H2S (balance gas is air) is introduced to the cell environment; at point B, the air gas mix is re-introduced to the atmosphere in which the cell is located. The associated waveforms are illustrated for comparison superimposed over each other; the dashed horizontal line marks the position of −61 μA (the baseline for the data at 0.0 V) or +56 μA (the baseline for the data at 0.5 V). | ||
To further the study of applied electrode potential on the amperometric response, a series of experiments were undertaken in which the potential of a cleaned carbon fibre mesh electrode was varied via holding at 0.0 V vs. Ag | AgCl |Cl−(aq, 0.1 M) for two seconds followed by a step up to 0.5 V vs. Ag | AgCl |Cl−(aq, 0.1 M), followed by keeping the cell for 20 s at open circuit. To avoid measuring capacitiative currents, measurements were undertaken immediately before the step up, and before the step down to the open circuit value (typically ca. 0.2 V). Data were recorded with the cell supporting a 30 μm thick PTFE membrane; representative results are exhibited in Fig. 4b. It is evident that in the absence of H2S, there is a small difference in the currents flowing observed at the two potentials, and that the signals both respond temporally in a similar manner when H2S is introduced to the cell environment, taking about 5 min to reach constancy (note the change in the baselines at the beginning and end of the experimentation) with little significant difference in the magnitudes of the currents; the main difference is that the baseline is more stable at the higher potential than at the lower one.
Taken altogether, the above suggests that electrode kinetics do not limit the amperometric response; rather it is likely, as with most Clark-type sensors6 to be dominated by material transport limitations. In general, Clark probes exhibit three extreme types of behaviour: at very short timescales (typically <0.1 s) the diffusion layer at the electrode is within the cell electrolyte, so that diffusion within the electrolytes is observed; at longer timescales (typically ca. <10 s), the diffusion layer has reached the membrane and transport through it becomes rate limiting; finally at even longer timescales transport is controlled by the membrane, with natural convetion processes allowing the current to reach to a plateau. For the case of the experiments employed here, viz. the stepped pulsing in H2S concentration, Hitchman,6a following Crank,21 suggested the following expression to describe the current transient for the case when transport through the membrane is rate-limiting.
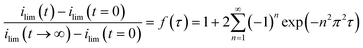 | (3) |
 . For the experiments considered in this work, the long timescales employed ensure that the response is governed by transport through the membrane, allowing for direct proportionality between the observed current and the concentration of H2S in its gaseous environment. Accordingly, using eqn (3),22 estimates of the diffusion coefficients through the membranes were calculated as being ca. 2 × 10⁻⁶ cm2 s−1 for the polypropylene membrane used for the data in Fig. 3 and 4a (independent of the electrode material), and ca. 8 × 10⁻⁸ cm2 s−1 for the silicone membrane used in experiments not reported herein similar to the setup employed for gathering the data in Fig. 5. These values appear to be reasonable,23 given the approximations and assumptions involved in the calculation.
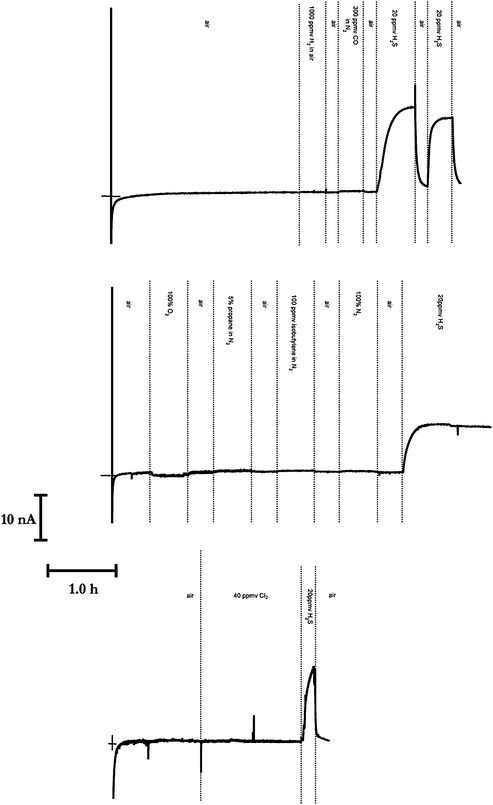 | ||
| Fig. 5 Amperometric transients (solid lines moving from left to right) illustrating interference testing of various gases, when the electrochemical cell employed a platinum spiral electrode and a silicone membrane (50 μm thick),, with the electrode potentiostatted at 0.0 V vs. Ag | AgCl | Cl−(aq, 0.1 M). Note that the platinum electrode was cleaned and polished before each of the three sets of reported experiments were undertaken. “Air” is the oxygen and nitrogen composition detailed in the text. The cross-hairs indicate the zero time and zero current point. All transients are plotted using the same scale. | ||
Inasmuch as the above suggests that H2S can be measured quantitatively, it is instructive to determine whether other gases may interfere with the measurement per se. We are particularly interested in molecular hydrogen since the proposed oxidation may involve the dissociative adsorption of hydrogen sulfide to form adsorbed hydrogen atoms (H●), as in the well-known case for H2 adsorption on polycrystalline platinum. Fig. 5 examines the effect of the following gases H2 in air, CO in N2, O2, propane in N2, isobutylene in N2, N2 and Cl2, for the case when the balance gas in the absence of the investigated gas is air. Note that in each of these three reported experiments, the electrode was cleaned and polished before each experiment, so that H2S is only exposed to the electrode at the end of the experiment. Whilst the exposure of several gases slightly changes the response observed to H2S, this is not sustained. It is clear from these amperometric transients that none of the tested gases interferes with our measurement of hydrogen sulfide, as evidenced by little occurence, if any, amperometric electrochemistry. We suggest that a possible reason for this is due to the initial formation of a chemisorbed oxygen layer,15a with other gases competing for adsorption sites, thence empowering a greater selectivity of the sensing system. This is examined further in the Electronic Supplementary Information.
4. Conclusions
In this work, a Clark-type measurement system for hydrogen sulfide has been developed, with methods explored that allow for improvement in the temporal response of the sensor to as fast as ca. 200 s for one embodiment (via design optimisation, even though membrane transport is rate-limiting) demonstrated to measure hydrogen sulfide gas concentrations rapidly and reproducibly within the range 2.0 ≤ p(H2S)/ppmv ≤ 20.0 at 298 K. This is within that required for most pragmatic environmental measurement systems. It relies on the direct amperometric oxidation of hydrogen sulfide, with the use of air as a balance gas, and has the advantage of preventing other gases (such as dihydrogen) to interfere significantly with the H2S measurement. It is notable that the use of electrolytes into which H2S partitions better than in water (such as room temperature ionic liquids24) may in fact be advantageous for the sensing measurement proposed herein as the local concentration of dissolved gas is likely to be greater than that observed in water, thereby giving rise to lower limits of detection. However, the drawback with this change is that the sampling will then likely have to be undertaken more rapidly, so as to maintain reproducibility, due to electrochemical oxidation product-fouling of the electrode surface. The latter issue may be overcome by undertaking electrochemical cleaning6 of the electrode surface routinely in loco (as sulfur-species may be reductively desorbed from the electrode); a form of automation within the measurement that has not been considered in this work.Acknowledgements
The authors thank Momenta Knowledge Transfer Partnership Scheme (programme number 6589) for funding this work, Messrs. M. Lewis and A. Watson (Analox Sensor Technology, Ltd., Stokesley, UK) for valuable discussions, and Mr. A. Sinclair for undertaking the scanning electron microscopy reported, and Dr K. van Velzen (Palm Instruments) for providing a program to operate the potentiostat to record the potential step transients reported.References and notes
- (a) L. Mioduszewski and V. Kress, J. Volcanol. Geotherm. Res., 2008, 174, 295 CrossRef CAS; (b) K. Kourtidis, A. Kelesis and M. Petrakakis, Atmos. Environ., 2008, 42, 7476 CrossRef CAS; (c) A. Demirbas, Energy Sources, Part A: Recovery, Util. Environ. Eff., 2009, 31, 1866 Search PubMed; (d) A. Y. Lein, V. V. Maslennikov, S. P. Maslennikova, N. V. Ul'yanova, W. Zaikov and B. Spiro, Geochem. Internatl., 2004, 72, 668 Search PubMed; (e) W. L. Orr, J. S. Sinninghe-Damsté, in W. L. Orr, C. M. White (ed.), Geochemistry of sulfur in fossil fuels, ACS Symposium Series 429, American Chemical Society, Washington DC, 1990, p. p.2 Search PubMed.
- N. S. Lawrence, J. Davis and R. G. Compton, Talanta, 2000, 52, 771 CrossRef CAS.
- (a) A. V. Kroll, V. I. Smorchkov and A. Y. Nazarenko, Sens. Actuators, B, 1994, 21, 97 CrossRef; (b) P. Jeroschewski, K. Haase, A. Tromme and P. Gründler, Fresenius J. Anal. Chem., 1993, 346, 930 CrossRef CAS; (c) D. H. Dawson, G. S. Henshaw and D. E. Williams, Sens. Actuators, B, 1995, 26, 76 CrossRef; (d) D. E. Williams, Sens. Actuators, B, 1999, 57, 1 CrossRef.
- N. S. Lawrence, L. Jiang, T. G. J. Jones and R. G. Compton, Anal. Chem., 2003, 75, 2499 CrossRef CAS.
- (a) B. A. Brookes, N. S. Lawrence and R. G. Compton, J. Phys. Chem. B, 2000, 104, 11258 CrossRef CAS; (b) B. A. Brookes, P. C. White, N. S. Lawrence and R. G. Compton, J. Phys. Chem. B, 2001, 105, 6361 CrossRef CAS; (c) N. S. Lawrence, J. Davis, L. Jiang, T. G. J. Jones, S. N. Davies and R. G. Compton, Electroanalysis, 2000, 12, 1453 CrossRef CAS.
- (a) M. L. Hitchman, Measurement of dissolved oxygen, John Wiley, New York, 1978 Search PubMed; (b) C. E. W. Hahn, Analyst, 1998, 123, 57 Search PubMed; (c) Note that Clark probes are usually exposed, in operation, to dissolved dioxygen not gaseous dioxygen, see, for example, ref. 6d and 6e; (d) J. D. Wadhawan, P. J. Welford, E. Maisonhaute, V. Climent, N. S. Lawrence, R. G. Compton, H. B. McPeak and C. E. W. Hahn, J. Phys. Chem. B, 2001, 105, 10659 CrossRef CAS; (e) J. D. Wadhawan, P. J. Welford, H. B. McPeak, C. E. W. Hahn and R. G. Compton, Sens. Actuators, B, 2003, 88, 40 CrossRef.
- This is very well described for simple redox catalytic systems — see, for example J.-M. Savéant, Chem. Rev., 2008, 108, 2348 Search PubMed and references cited therein.
- (a) M. L. Hitchman and S. Kauser, Anal. Chim. Acta, 1982, 143, 131 CrossRef CAS; (b) M. Schmid and K. H. Mancy, Chimia, 1969, 23, 398 CAS.
- G. Schiavon, G. Zotti, R. Toniolo and G. Bontempelli, Anal. Chem., 1995, 67, 318 CrossRef CAS.
- M. P. Sotto and J. C. Boulliard, Surf. Sci., 1985, 162, 285 CrossRef CAS.
- This value has been estimated, assuming activity coefficients (γi) can be approximated for the solution via the Extended Debye–Hückel Limiting Law,
 where z is the formal charge on species i and I is the ionic strength of the electrolyte. It is noteworthy that cyclic voltammetry experiments (at a scan rate of 0.1 V s−1, and also at a temperature of 298 K) employing a platinum spiral working electrode (as described in the main text) and a polypropylene membrane (as described in the main text) of 0.5 mM ferrocenemonocarboxylic acid in 0.1 M aqueous phosphate buffer solution and 0.1 M KCl (pH 6.5) afforded a quasi-reversible one-electron signal with Emid=½(EOxp + ERedp) = +0.24V using the reference electrode constructed (EOxp and ERedp respectively refer to the peak oxidation and reduction potentials) with a peak-to-peak potential separation, ΔEpp = 84 mV. These data are consistent with the estimated and calculated value of the reference electrode.
 - M. C. Simmonds, M. L. Hitchman, H. Kheyrandish, J. S. Colligon, N. J. Cade and P. J. Ireland, Electrochim. Acta, 1998, 43, 3285 CrossRef CAS.
- This was determined using a 3.0 mm diameter glassy carbon electrode (purchased from BASi, UK) in a conventional three electrode electrochemical cell in separate experiments.
- (a) C. Amatore, J.-M. Savéant and D. Tessier, J. Electroanal. Chem., 1983, 147, 39 CrossRef CAS; (b) B. A. Brookes, T. J. Davies, A. C. Fisher, R. G. Evans, S. J. Wilkins, K. Yunus, J. D. Wadhawan and R. G. Compton, J. Phys. Chem. B, 2003, 107, 1616 CrossRef CAS.
- (a) N. Ramasubramanian, J. Electroanal. Chem., 1975, 64, 21 CrossRef CAS; (b) T. Loučka, Collect. Czech. Chem. Commun., 2000, 65, 161 CrossRef CAS; (c) R. J. Koestner, M. Salmeron, E. B. Kollin and J. L. Gland, Surf. Sci., 1986, 172, 668 CrossRef CAS; (d) V. A. Sethuraman, A. L. Wise, S. Balasubramanian and J. W. Weidner, ECS Trans., 2006, 1, 111 Search PubMed.
- The use of nitrogen as the balance gas for the hydrogen sulfide baseline causes the square-like transient to change shape so that introduction of the H2S sample causes a very large current which then decays rapidly (data not shown). Such phenomena were also observed when the aqueous electrolyte was replaced by a room temperature ionic liquid such as 1-butyl-3-methyl-imidazolium hexafluorophosphate (purchased from Sigma-Aldrich, data not shown).
- (a) This has been suggested for the case of platinum electrodes immersed in highly alkaline sulfide solutions, q.v. ref. 17b and 17c; (b) S. Kapusta, A. Viehbeck, S. M. Wilhelm and N. Hackerman, J. Electroanal. Chem., 1983, 153, 157 CrossRef CAS; (c) J. Szynkarczuk, P. G. Komorowski and J. C. Donini, Electrochim. Acta, 1995, 40, 487 CrossRef CAS.
- M. R. Hoffmann and B. C. Lim, Environ. Sci. Technol., 1979, 13, 1406 CrossRef CAS.
- (a) W. Latimer, The oxidation states of the elements and their potential in aqueous solution, 2nd.edn, Prentice-Hall, Inc., New York, 1952 Search PubMed; (b) D. R. Lide (ed.), CRC handbook of chemistry and physics, 76th edn, CRC Press, Boca Raton, 1995 Search PubMed; (c) A. J. Bard, R. Parsons, J. Jordan (ed.), Standard potentials in aqueous solution, Marcel Dekker, Inc., New York, 1985 Search PubMed.
- (a) E. P. Gilbert, P. A. Reynolds and J. W. White, J. Chem. Soc., Faraday Trans., 1998, 94, 1861 RSC; (b) M. E. Hyde, T. J. Davies and R. G. Compton, Angew. Chem., Int. Ed., 2005, 44, 6491 CrossRef.
- (a) See equation (4.16) in J. Crank, The mathematics of diffusion, 2nd edn, Oxford University Press, Oxford, 1975, p.47 Search PubMed; (b) Note that this equation is derived with the assumption that the porosity of the membrane is uniform. This is reasonable for the membranes employed here, since uniformity may be adequately approximated by membranes with fine and closely-spaced pores (viz. the distance between the pores is much smaller than the distance between the membrane and the plane of the electrode); eqn (3) will not be applicable for membranes with fine and widely-spaced pores (by wide, we mean at least about an order of magnitude distance bigger than the characteristic pore size), q.v. ref. 14.
- Calculation of f(τ) was undertaken numerically using n = 106 to ensure numerical convergence. The resulting variation of f(τ) with τ was fitted to the expression:
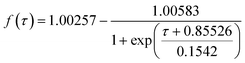 , determined to be accurate to within 1%, to allow experimentally-computed values of f(τ) to generate values of the reduced time variable for experimental times less than ca. 20 s, allowing the membrane diffusion coefficient to be estimated from the gradient of plots of experimental time against computed τ.
 - (a) Comparative data for polydimethylsiloxane can be obtained in ref. 6a and 23b; (b) See, for example T. E. Hannon, S. Chah and R. N. Zare, J. Phys. Chem. B, 2005, 109, 7435 Search PubMed and references cited therein.
- (a) A. M. O'Mahony, E. J. F. Dickinson, L. Aldous, C. Hardacre and R. G. Compton, J. Phys. Chem. C, 2009, 113, 10997 CrossRef CAS; (b) See also note 16.
Footnote |
| † Electronic supplementary information (ESI) available: SEM images of the papyex, carbon fibre mesh and PTFE membrane employed in this work (Fig. S1–3 respectively), as well as an approximate physicochemical model for understanding the measurement system selectivity. See DOI: 10.1039/c0ay00338g |
| This journal is © The Royal Society of Chemistry 2010 |