Determination of cytokinins in plant samples by polymer monolith microextraction coupled with hydrophilic interaction chromatography-tandem mass spectrometry
Zhao
Liu
a,
Fang
Wei
b and
Yu-Qi
Feng
*a
aKey Laboratory of Analytical Chemistry for Biology and Medicine (Ministry of Education), Department of Chemistry, Wuhan University, Wuhan, 430072, China. E-mail: yqfeng@whu.edu.cn; Fax: +86 27 68755595; Tel: +86 27 68755595
bOil Crops Research Institute, Chinese Academy of Agricultural Sciences, Key Laboratory of Oil Crop Biology of Ministry of Agriculture, Wuhan, China
First published on 24th August 2010
Abstract
In this study, a sensitive assay of cytokinins was developed using polymer monolith microextraction/hydrophilic interaction chromatography/electrospray ionization-tandem mass spectrometry (PMME/HILIC/ESI-MS/MS). The extraction was realized on a poly(2-acrylamido-2-methyl-1-propanesulfonic acid-co-ethylene dimethacrylate) (poly(AMPS-co-EDMA)) capillary monolith and the subsequent separation was carried out on a Luna silica column. Several parameters of PMME and HILIC were optimized to obtain the optimum results. After optimizing the extraction conditions, 10 mM ammonium formate of pH 2.5 was chosen as the matrix solution to obtain the highest extraction efficiency. The MS sensitivity for cytokinins investigated could be enhanced 3-fold by the use of hydrophilic interaction chromatography with the mobile phase of 85% acetonitrile with 0.01% (v/v) formic acid and 15% water with 0.01% (v/v) formic acid, when compared to the use of conventional reversed phase liquid chromatography (RPLC). Good linearities were obtained for five cytokinins with correlation coefficients (R2) > 0.9962. The LODs (S/N = 3) for the targets were found to be 0.0028–0.068 ng mL−1. Reproducibility of the method was obtained with intra-day and inter-day relative standard deviations (RSDs) less than 12.7% and the recoveries in plant samples ranged from 70.3% to 113.3%. The method was applied to the determination of cytokinins in Oryza sativa, Arabidopsis thaliana and oil seed rape tissues.
Introduction
Cytokinins (CKs) are a vital group of phytohormones. They act in a wide array of biological processes in plants, such as promotion of cell division, shoot development, bud formation and control of apical dominance, leaf senescence, chloroplast differentiation and induction of photosynthesis gene expression.1,2 Since discovered in 1950s by Strong's group,3 more than 40 cytokinins have been identified. Most naturally occurring cytokinins are N6-substituted adenine derivatives with an isoprenoid or aromatic side chain.4 (Table 1)| R1 | R2 | R3 | Compound | |
|---|---|---|---|---|
| a H, hydrogen; R, β-D-ribofuranosyl; G, β-D-glucopyranosyl. | ||||

|
H | H | isopentenyladenine(ip) | |
| R | H | isopentenyladenine riboside (iPR) | ||
| G | H | isopentenyladenine riboside 9-glucoside (iP9G) | ||

|
H | H | trans-zeatin (tZ) | |
| R | H | trans-zeatin-riboside (tZR) | ||
| G | H | trans-zeatin 9-glucoside (tZ9G) | ||
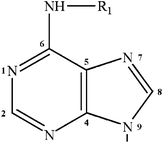
|
||||

|
H | H | dihydrozeatin (DHZ) | |
| R | H | dihydrozeatin riboside (DHZR) | ||

|
H | H | kinetin/K | |
| R | H | kinetin riboside (KR) | ||

|
H | H | N6-benzylaminopurin (BA) | |
| R | H | N6-benzylaminopurin riboside (BAR) | ||
In order to understand the cytokinin system and its function in the regulatory pathways that respond to internal and external signals,5 qualitative and quantitative analyses of cytokinins in plant tissues are required. Since plant tissue extracts represent complicated matrix and cytokinins occur in extremely low concentration levels (less than 50 pmol/g fresh weight (FW)),6 a highly specific sample pretreatment approach and a highly sensitive qualitative and quantification method are required for determination of their endogenous levels in plant tissues.
Recently, immunoassays,7,8 gas chromatography-mass spectrometry (GC-MS) and high performance liquid chromatography-mass spectrometry (HPLC-MS) are common techniques used for quantification of cytokinins. Other methods, such as capillary electrophoresis (CE)-MS,9 ultra performance liquid chromatography (UPLC)-MS10 and electroanalysis are also available for CKs analysis.11,12 Immunoassays show high sensitivity and low cost. However, the cross-reactivity which can lead to compromise of accuracy is inevitable. GC-MS can provide accurate results with low LODs, while the prerequisite derivatization process to convert cytokinins into volatile derivatives brings many drawbacks, such as costliness of the derivatives, hydrolysis of the derivatives, multiple product formation, time consumption and so forth.13 Among several reliable and commercial separation technologies, HPLC has been increasingly used in the fields of cytokinin analysis. HPLC offers a powerful tool with its rapid and high resolution separation of cytokinins from impurity in plant extracts prior to analysis by UV, MS, immunoassay, or bioassay. Nowadays, ESI-MS/MS is a most used detector for the quantification of cytokinins6,14–17 because of its high selectivity and sensitivity.
So far, the HPLC separation of cytokinins is usually carried out on a reversed phase-C18 or C8 column based on their hydrophobic character.6,15 However, some cytokinin nucleotides cannot be well separated by reversed phase liquid chromatography (RPLC) due to their high polarity.18 In addition, low organic content in mobile phase is not conducive to the ionization of analytes when coupled with ESI-MS. Hydrophilic interaction chromatography (HILIC) is a new technique developed for the separation of polar and hydrophilic compounds.19 In HILIC, a hydrophilic stationary phase and an aqueous-organic solvent mobile phase with a high organic-solvent content (60–95%) are used. This mobile phase is compatible with various detectors, especially with ESI-MS because of enhancement of sensitivity.20,21
It should be noted that, whichever instrument is taken for the separation and determination of cytokinins, the procedures used for extracting and enrichment of cytokinins from plant tissues are critically important steps and indispensably needed in the entire analytical process due to the complexity of plant tissues. An appropriate sample pretreatment can effectively clean up the sample and enrich the target analytes.
The most commonly used pretreatment tools are liquid-liquid extraction (LLE),22 immunoextraction (IAE)2,23 and solid-phase extraction (SPE) with hydrophobic columns, ion-exchange columns or mix-mode columns.6,24 However, all these methods require large volume of samples and elution solvent, are time consuming, costly in materials and so forth. To solve these problems, micropurification such as immunoextraction micropurification10 has been reported for extraction of CKs in plant samples. Smaller amounts were used but higher selectivity and throughput were provided compared with previous methods in the procedure.
Polymer monolith microextraction (PMME), as one kind of solid-phase microextraction, was introduced as a simple, solvent free and time-efficient extraction technique, which integrates sampling, extraction and sample introduction into one step and one device, and can be easily coupled off-line or online with HPLC.25–28 The synthesis of PMME materials requires only one-step polymerization and the porous structure and surface properties of the polymer are usually tunable.29,30 Furthermore, an online combination of PMME and HILIC is expected, due to the mobile phase of HILIC, whose volume ratio of organic solvent was really high and can be well matched with the desorption solution of PMME.29,30 In our previous research, PMME based on a capillary monolithic column of poly(2-acrylamido-2-methyl-1-propanesulfonic acid-co-ethylene dimethacrylate) (poly(AMPS-co-EDMA)) was successfully used in the determination of melamine in milk products.31 The monolithic material exhibited satisfactory permeability, high mechanical strength and good stability in aqueous solutions. Due to the sulfonic groups in the hydrophobic bone structure, cytokinins can be captured by the poly(AMPS-co-EDMA) monolith through strong cation exchange and hydrophobic interactions.
In this study, a sensitive PMME/HILIC/ESI-MS/MS assay method for the determination of five cytokinins in plant samples was developed. Our effort comprised a PMME extraction protocol using poly(AMPS-co-EDMA) monolith followed by hydrophilic interaction chromatography separation using silica column and ESI(+)-MS/MS quantification. Furthermore, we successfully applied our analytical method to various samples including Oryza sativa, Arabidopsis thaliana and oil seed rape.
Experimental
Chemicals and reagents
Cytokinins: kinetin (K), N6-benzyladenine (6-BA) and trans-zeatin (t-Z) were gifts from Professor Wuyan (Wuhan University, China), N6-(-isopentenyl)adenine (iP), isopentenyladenine riboside (iPR), isopentenyladenine riboside 9-glucoside (iP9G), trans-zeatin-riboside (t-ZR), trans-zeatin 9-glucoside (t-Z9G), dihydrozeatin (DHZ), dihydrozeatin riboside (DHZR), and stable isotope-labeled standards: [15N4]K, [2H7]6-BA, [2H6]iP, [2H6]iPR, [2H6]iP9G, [2H5]t-Z, [2H5]t-ZR, [2H5]t-Z9G, [2H3]DHZ, [2H3]DHZR were purchased from Olchemim (Olomouc, Czech Republic).2-Acrylamido-2-methyl-1-propanesulfonic acid-co-ethylene dimethacrylate (AMPS, 99% pure), polyethylene glycol 6000 (PEG-6000), N,N-dimethylformamide (DMF) were purchased from Shanghai Chemical Co. Ltd. (Shanghai, China). Ethylene dimethacrylate (EDMA, 98% pure), azobisisobutyronitrile (AIBN), formic acid and ammonia were obtained from Sigma-Aldrich (St. Louis, MO, USA). Acetonitrile (ACN, HPLC grade) was obtained from Tedia Company (Fairfield, OH, USA). Methanol (MeOH, HPLC grade) was obtained from J&K Chemical (Beijing, China). Deionized distilled water was purified with an Aike apparatus (Chengdu, China) and was used for all aqueous solutions.
Biological material
Rice (Oryza sativa L.) plant, Arabidopsis thaliana wild type were grown in a green house at 25 °C in 14 h photo periods. Ten day-old seedlings were harvested.Arabidopsis thaliana transgenic type, which had been grown in an illumination box for 14 days, was a gift from Professor Wuyan (Wuhan University, China).
Leaves of oil seed rape were collected from A suburban district of Wuchang, Wuhan, China in March, 2009.
All the materials were collected, weighted, immediately frozen in liquid nitrogen, and stored until extraction at −80 °C.
Preparation of poly(2-acrylamido-2-methyl-1-propanesulfonic acid-co-ethylene dimethacrylate) (AMPS-co-EDMA) monolith
The pre-polymerization mixture was composed of 10 mg functional monomer AMPS, 70 μL cross-linker EDMA, 220 μL DMF, 110 mg PEG 6000 and 1 mg initiator AIBN. After mixing by vortex and ultrasonication to form a homogeneous solution, the mixture was placed in a fused silica capillary (0.53 mm, i.d.), whose inner face was derivatized with 3-(triethoxysilyl) propyl methacrylate32, and then dried with N2. Finally, the capillary was immediately sealed with silicon rubber and the polymerization took place at 60 °C for 12 h. After polymerization, the capillary was washed with acetonitrile to remove the unreacted monomers and porogens.31Sample pretreatment
Plant tissues (1 g of fresh weight (FW)) were homogenized in liquid nitrogen and dropped in modified Bieleski solvent (methanol/water/formic acid, 15/4/1, v/v/v)) to 5 mL g−1 of fresh weight. At the beginning of extraction, the stable isotopes of 2 ng were added to serve as internal standards for recovery studies and quantification. After overnight extraction at −20 °C, solids were separated by freeze centrifugation (10000 rpm, 20 min) at 0 °C and re-extracted for 1 h in additional 1 mL of modified Bieleski solvent at −20 °C, freeze centrifugation (10000 rpm, 20 min) was performed subsequently. The following experiments were tested at two variants of purification protocols.A syringe infusion pump (TCI-II, Silugao High-Technology Development, Beijing, China) was used to provide the driving force for PMME. The whole PMME process included preconditioning, adsorption, clean-up and desorption, which were all carried out at a velocity of 4.5 mL h−1. Firstly, a 4 cm AMPS monolith capillary was conditioned with 0.3 mL methanol and 0.3 mL ammonium formate buffer of pH 2.5, and then the sample which was dissolved in 0.5 mL pH 2.5 ammonium formate buffer was driven through the monolith. After the monolith was washed with 0.2 mL buffer, the residual buffer in the monolith was driven out by air. Subsequently, 0.15 mL acetone with 5% ammonia (v/v) was used for desorption of cytokinins from the monolith. Finally, the elution solution was collected into a vial, evaporated to dryness and redissolved in 0.05 mL mobile phase for the subsequent analysis (Fig. 1).
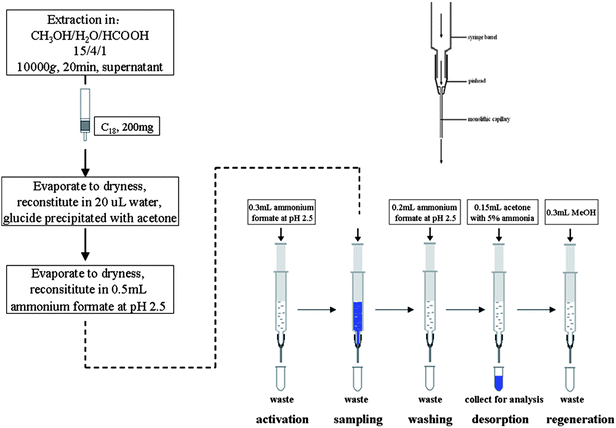 | ||
| Fig. 1 Extraction and purification protocol for cytokinins. | ||
HPLC-ESI(+)-MS instruments and conditions
In this study, optimization of PMME was performed on Shimadzu LCMS-2010EV (Shimadzu, Tokyo, Japan) that consists of two LC-20ADVP pumps, a SIL-HTC autosampler, a CTO-10AVP thermostated column compartment, a DGU-14AM vacuum degasser, which was connected to a Shimadzu LCMS-2010A single quadrupole mass spectrometer. A Shim-pack VP-ODS (150 × 2.0 mm i.d., 5 μm) column from Shimadzu was used here. Mobile phase was 25% MeOH with 0.01% (v/v) FA and 75% water with 0.01% (v/v) FA. Extracts were dissolved in 50 μL mobile phase and 10 μL of each sample was injected in to the ODS column. The column thermostat was set at 35 °C. Positive ion electrospray ionization (ESI) was employed and analytes were quantified by selected ion monitoring (SIM) with monitor ions of m/z 216, 226, 204, 220, 222 for K, 6-BA, iP, Z, DHZ, respectively. Capillary voltage was 4.5 kV. Curved desolvation line (CDL) and heat block temperatures for the analysis were set at 250 and 200 °C, respectively. Nitrogen was set at 0.02 MPa and 1.5 L min−1 for drying and nebulizer gases, respectively. The detector voltage was set at 1.5 KV.Analysis of cytokinins in plants were performed on Aglient 1200 series HPLC system (Agilent Technologies, Palo Alto, CA, USA) that consisted of G1311A Quant pump, a G1329A autosampler, a G1330B thermostated column compartment, and a G1322A degasser, and which was connected to an AB 3200 Q trap MS/MS system (Applied Biosystems, USA). The separation of cytokinins in plants was performed on Luna 5u silica column (250 mm × 2.0 mm, 5 μm) from Phenomenex (Torrance, CA, USA) with a flow rate of 0.2 mL min−1 in HILIC mode. The mobile phase was 85% ACN with 0.01% (v/v) FA and 15% water with 0.01% (v/v) FA. Samples were dissolved in 50 μL of mobile phase and the injection volume was 10 μL. The column thermostat was set at 35 °C. Analytes were quantified by multiple reaction monitoring (MRM) of [M + H]+ and the appropriate product ion. For selective MRM experiments, optimized conditions were as follows: curtain gas 27 psi, ion spray voltage 5400 v, turbo heater temperature (TEM) 540 °C, nebulizing gas (Gas 1) 49 psi, heated gas (Gas 2) 42 psi, entrance potential (EP) 9 V, collision cell exit potential (CXP) 2 V. The declustering potential and collision energies were optimized respectively to maximize sensitivity. (Table 2)
| Analytes | Scan mode | Q1 | CE(Q2)/V | Q3 | DP/V | EP/V | CXP/V |
|---|---|---|---|---|---|---|---|
| K | + | 216.1 | 18 | 148.1 | 44 | 9 | 2 |
| [15N4]K | + | 220.1 | 18 | 152.1 | 44 | 9 | 2 |
| 6-BA | + | 226.2 | 25 | 148.1 | 61 | 9 | 2 |
| [2H7]6-BA | + | 233.2 | 25 | 150.1 | 61 | 9 | 2 |
| iP | + | 204.2 | 22 | 136.1 | 49 | 9 | 2 |
| [2H6]iP | + | 210.1 | 22 | 137.1 | 49 | 9 | 2 |
| iPR | + | 336.4 | 23 | 204.3 | 43 | 5 | 3 |
| [2H6]iPR | + | 342.4 | 23 | 210.3 | 43 | 5 | 3 |
| iP9G | + | 366.0 | 26 | 204.1 | 45 | 9 | 2 |
| [2H6]iP9G | + | 372.0 | 26 | 210.1 | 45 | 9 | 2 |
| Z | + | 220.2 | 26 | 136.1 | 46 | 9 | 2 |
| [2H5]Z | + | 225.1 | 26 | 137.1 | 46 | 9 | 2 |
| ZR | + | 352.0 | 26 | 220.0 | 45 | 9 | 2 |
| [2H5]ZR | + | 357.0 | 26 | 225.1 | 45 | 9 | 2 |
| Z9G | + | 382.3 | 28 | 220.2 | 55 | 9 | 2 |
| [2H5]Z9G | + | 387.4 | 28 | 225.3 | 55 | 9 | 2 |
| DHZ | + | 222.2 | 30 | 136.1 | 53 | 9 | 2 |
| [2H3]DHZ | + | 225.3 | 30 | 136.2 | 53 | 9 | 2 |
| DHZR | + | 354.4 | 28 | 222.3 | 41 | 9 | 3 |
| [2H3]DHZR | + | 357.4 | 28 | 225.3 | 41 | 9 | 3 |
Results and discussion
Optimization of HILIC conditions
HILIC is a new technique developed for the separation of polar and hydrophilic compounds.19 The buffer conditions of higher organic content in HILIC are compatible with ESI-MS because of the improvement of ionization efficiency and enhancement of sensitivity.20,21 What's more, for polar and hydrophilic compounds, HILIC may work better for solutes that are problematic in RPLC.In HILIC mode, acetonitrile-water system is always used as mobile phase, which usually contains between 5% ∼ 40% water for the elution of compounds and to insure the hydrophilic character. The content of water in the mobile phase is probably the factor that influences the retention of analytes. In this study, the effect of water content on the retention of five cytokinins has been investigated by varying the percentage of water from 10–40% in the mobile phase. The typical HILIC behaviors of CKs are shown in Fig. 2. With the increase of acetonitrile content, the polarity of mobile phase decreased, while retention and separation selectivity of five cytokinins increased gradually. Finally, the mobile phase of 85% acetonitrile was chosen in the following experiments. Compared with 25% MeOH for RPLC-MS, the sensitivity improved markedly with higher organic contents. The signal to noise ratios of five cytokinin standards in HILIC-MS and RPLC-MS were: 23/6 (HILIC-MS/RPLC-MS) for K, 82/20 for 6-BA, 118/31 for iP, 65/26 for Z and 56/28 for DHZ, respectively.
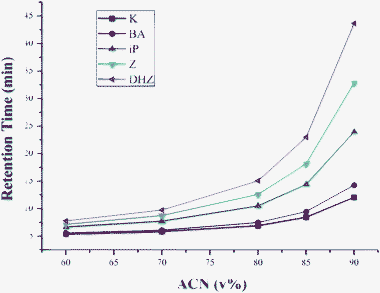 | ||
| Fig. 2 Effect of organic content on the retention of cytokinins. HILIC condition: HILIC column was a Luna 5u silica column (250 mm × 2.0 mm, 5 μm): column oven temperature was 35 °C; flow rate was 0.2 mL min−1; inject volume was 10 μL. | ||
HILIC is a variant of normal phase chromatography (NPC) but utilizes water in a water-miscible organic solvent as the eluent. The elution order in HILIC is more or less the opposite of that seen in RP separations33 which means that HILIC may work best for solutes that are problematic in RPLC.34Fig. 3 shows the chromatograms of five cytokinin standards separated by C18 column and silica column. It can be seen that good separation of two structurally similar components of Z and DHZ can only be achieved by the HILIC column with isocratic elution. When plant extracts were analyzed, impurities could hardly be separated from analytes of interest on C18 column, however, better results were gained on HILIC column with the chosen mobile phase. Cytokinins and impurity in plant samples were completely separated in 21 min with isocratic elution.
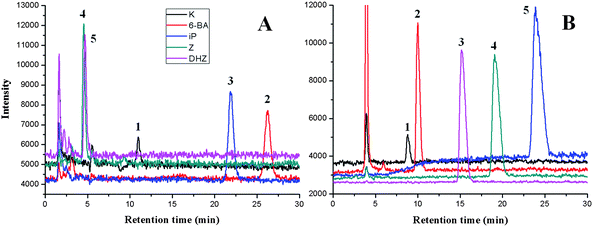 | ||
| Fig. 3 SIM chromatograms of 10 ppb cytokinins separated by ODS (A) and silica gel column (B). The RPLC/MS and HILIC/MS conditions are described in the Experimental section. Peaks: (1) K; (2) 6-BA; (3) iP; (4) Z; (5) DHZ. (m/z 216, 226, 204, 220, 202). | ||
Optimization of PMME conditions
Our objective was to develop a simple, solvent-free and stable PMME method for the analysis of cytokinins in plant samples. In the whole method, plant tissues were extracted in modified Bieleski solvent at −20 °C overnight. Then, after removing lipids and pigments by C18 cartridge and precipitating saccharides by acetone, a poly(AMPs-co EDMA) monolith capillary was used for the PMME method, which consisted of preconditioning, adsorption, clean-up and desorption procedure.In order to maximize the extraction efficiency of PMME, extraction was optimized with ammonium formate solution (10 mmol) spiked with 50 ng mL−1 of five cytokinins. Several parameters affecting the extraction efficiency including pH, organic content, plant matrix were investigated. In order to evaluate the stability of the monolith for CKs, the extraction repeatability of intra- and inter-batch were subsequently tested on the optimal extraction conditions.
The pH of the sample matrix will affect the molecule forms of cytokinins and therefore is expected to result in different extraction efficiency. Optimization was performed using ammonium formate solutions with the pH ranging from 2 to 8 as sample matrix for PMME. As shown in Fig. 4, highest extraction efficiency of cytokinins was obtained at pH 2.5 and an obviously decrease was found when the pH increased to 8.
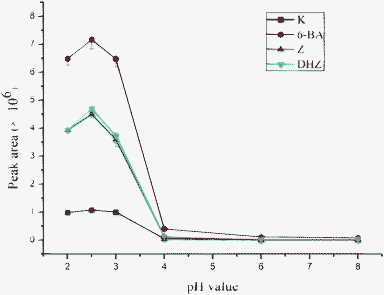 | ||
| Fig. 4 Effect of pH value of the sample matrix on extraction efficiency. Sample solutions of five CKs spiked at 50 ng mL−1 were prepared with 10 mM ammonium formate solution at pH 2.0–8.0. PMME and HPLC/ESI-MS conditions are described in the Experimental section. | ||
In the structure of cytokinins, the exocyclic amino group at the sixth position of purine has pKa 4, giving positive charge of cytokinins at pH <3.24 Under this condition, all cytokinins exist as protonated forms, which could interact with the polymer backbone and its acidic pendant groups via hydrophobic interactions and strong cation interactions. With increasing pH of solution, the ionization degree of analyte molecules decreased, ion exchange interaction disappeared accordingly, which led to the decrease of extraction efficiency. It can be seen that the interaction between the analytes and the monolithic capillary was mainly based on the strong ion exchange interaction. In the following experiment, matrix pH was adjusted to 2.5 with 10 mM ammonium formate solution.
Further investigation was carried out to investigate the effect of organic content of sample matrix on extraction efficiency. Usually, the existence of organic solvent in the sample solution would decrease the extraction efficiency. On the other hand, the addition of acetonitrile may result in polymer monolith swelling, so more hydrophobic interaction sites on the skeleton would be exposed, which would increase the extraction efficiency. Therefore, in our study, optimization was performed by using ammonium formate solutions with the organic content from 0–100% as the sample matrix. As shown in Fig. 5, extraction efficiency decreased as methanol content increased, indicating the existence of hydrophobic interaction between analytes and monolith. So no additional organic solvent was used for the analysis of real samples.
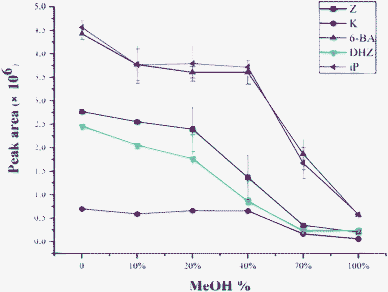 | ||
| Fig. 5 Effect of methanol content in sample solutions on the extraction for five cytokinins. Sample solutions of five CKs spiked at 50 ng mL−1 were prepared with 10 mM ammonium formate solution with different methanol content. PMME and HPLC/ESI-MS conditions are described in the Experimental section. | ||
Preparation and extraction repeatability of intra- and inter-batch monoliths was investigated in this study by calculating the RSDs of the extraction efficiency while performing the extraction of cytokinins from standard samples. All the RSDs of intra-batch were in the range of 3.0–5.3% (n = 5) and inter-batch were 2.0–7.1% (n = 4), which confirmed that the poly(AMPS-co-EDMA) monolithic capillary present good reproducibility. Besides, each monolith showed high stability and could be used repeatedly for at least 40 times without any extraction efficiency decrease.
Effect of plant matrix on extraction efficiency
Usually, matrix effects can strongly influence extraction efficiency during PMME. In the study, the extraction efficiency of samples with and without plant matrices were investigated under optimized conditions.The extraction efficiency of samples without plant matrices (with five standards only in aqueous solution) was calculated by comparing the peak area of the extracted amount of CKs from aqueous solution spiked before PMME with those spiked after PMME (5 ng g−1 spiked concentration).
The extraction efficiency of samples with plant matrices was carried out as following procedure. After removing lipids and pigments by C18 cartridge and precipitating saccharides by acetone, PMME process was carried out. The extraction efficiency was obtained by comparing the extracted amount of CKs from Oryza sativa seedling extracts spiked before PMME with those spiked after PMME (5 ng g−1 spiked concentration).
The extraction efficiency was found to be in the range from 94.6 to 100% for samples without plant matrices, and in the range from 59.1 to 77.1% for the samples with plant matrices, which indicated that the extraction efficiency of PMME can be obviously affected by plant matrix. Therefore, the stable isotopes were added to serve as internal standards to eliminate the error of the whole experimental procedure.
Under optimal conditions, the SIM chromatograms of five cytokinins obtained by direct injection and by PMME enrichment are shown in Fig. 6. It can be seen that great enhancement of the peak height could be achieved by PMME, indicating the remarkable preconcentration ability of the monolithic column.
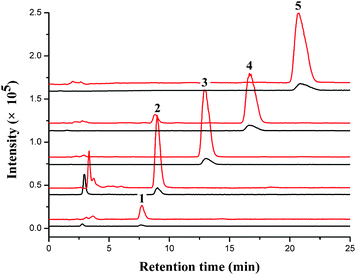 | ||
| Fig. 6 SIM chromatograms of five CKs standard samples obtained by PMME (upper) and directed HILIC/ESI-MS analysis (lower). The concentrations of CKs for PMME and direct HILIC/ESI-MS analysis were 10 ng mL−1. PMME conditions and HILIC/ESI-MS conditions were described in the experiment section. Peaks: (1) K; (2) 6-BA; (3) iP; (4) Z; (5) DHZ. (m/z 216, 226, 204, 220, 202). | ||
Method validation
As listed in Table 3, good linear correlation were obtained for all cytokinins with correlation coefficients (R2) ranging from 0.9962 to 0.9998. Detection and quantification limits were calculated as the signal-to-noise ratios of 3![[thin space (1/6-em)]](https://www.rsc.org/images/entities/char_2009.gif) :
:![[thin space (1/6-em)]](https://www.rsc.org/images/entities/char_2009.gif) 1 and 10
1 and 10![[thin space (1/6-em)]](https://www.rsc.org/images/entities/char_2009.gif) :
:![[thin space (1/6-em)]](https://www.rsc.org/images/entities/char_2009.gif) 1. LODs for all five cytokinins were ranged from 0.0028 to 0.068 ng mL−1. Compared with the LODs of cytokinins previously published in papers, better results were obtained in our study (Table 4)
1. LODs for all five cytokinins were ranged from 0.0028 to 0.068 ng mL−1. Compared with the LODs of cytokinins previously published in papers, better results were obtained in our study (Table 4)
| Compound | Linear dynamic range/ng mL−1 | Regression line | LOD/ng mL−1 | LOQ/ng mL−1 | ||
|---|---|---|---|---|---|---|
| Slope | Intercept | R2 value | ||||
| a Number of data points is 13, with three repetitions per point. | ||||||
| K | 0.2-200 | 0.00559 | 0.00321 | 0.9994 | 0.055(2.56fmol) | 0.18 |
| 6-BA | 0.3-100 | 0.03370 | 0.02570 | 0.9983 | 0.068(3.02fmol) | 0.23 |
| iP | 0.05-200 | 0.02389 | 0.01191 | 0.9998 | 0.0028(0.14fmol) | 0.0093 |
| Z | 0.06-200 | 0.04757 | 0.01925 | 0.9974 | 0.018(0.81fmol) | 0.060 |
| DHZ | 0.05-200 | 0.06590 | −0.02454 | 0.9962 | 0.0075(0.34fmol) | 0025 |
| Compound | Intra-day precision (R.S.D., %; n = 6) | Inter-day precision (R.S.D., %; n = 3) | ||||
|---|---|---|---|---|---|---|
| Low (0.5 ng g−1) | Medium (2.5 ng g−1) | High (10 ng g−1) | Low (0.5 ng g−1) | Medium (2.5 ng g−1) | High (10 ng g−1) | |
| K | 0.2 | 0.1 | 0.1 | 10.2 | 2.9 | 5.9 |
| 6-BA | 4.6 | 3.5 | 5.2 | 9.4 | 2.4 | 7.2 |
| iP | 0.8 | 0.6 | 4.4 | 10.9 | 3.5 | 4.5 |
| Z | 2.5 | 1.6 | 2.9 | 3.4 | 2.2 | 3.6 |
| DHZ | 10.7 | 5.4 | 10.4 | 12.7 | 6.3 | 8.3 |
The relative recoveries were calculated by comparing the peak area ratios of CKs from the spiked Oryza sativa samples to those from the standard solutions. The results were in the range of 70.3% to 113.3% (Table 6).
| Compound | Recovery (%; n = 6) | ||
|---|---|---|---|
| Low (0.5 ng g−1) | Medium (2.5 ng g−1) | High (10 ng g−1) | |
| K | 70.3 | 73.4 | 71.2 |
| 6-BA | 78.5 | 82.4 | 90.8 |
| ip | 78.9 | 105.9 | 102.2 |
| Z | 113.3 | 107.5 | 103.0 |
| DHZ | 108.0 | 95.9 | 96.8 |
Data shown above indicated that the precision and accuracy of the present PMME/HILIC/ESI-MS/MS method are acceptable for routine monitoring purposes.
To evaluate the present method, the amounts of CKs in Oryza sativa samples were determined by these two methods: cytokinins from ten-day-old Oryza sativa seedlings were extracted and divided into two fractions: one was purified by method A and the other was purified by method B. Data in Table 7 showed that the results obtained with method A were comparable with those obtained with method B, and even better that DHZ could be detected because of the improvement of sensitivity. This indicated that more kinds of cytokinins can be identified by using more advanced analytical approaches.
Analysis of cytokinins in plant samples
Since cytokinins are a group of vital hormones and play crucial roles in the control of plant growth and development, analysis of cytokinins in plant tissues is of great importance. However, analysis has an associated number of problems related to the chemical nature of the compounds, the small quantities present in samples and the complexity of plant matrices.10 Therefore, a new and sensitive method was developed in the present study.Under the optimized conditions, PMME combined with the HILIC-MS/MS detection method was applied to analyze cytokinins in several plant samples. Fig. 7 shows the typical MRM chromatograms obtained by PMME/HILIC/ESI-MS/MS of Oryza sativa samples with CKs spiked at 2.5 ng g−1. The interferences of the matrix could be separated from the analytes.
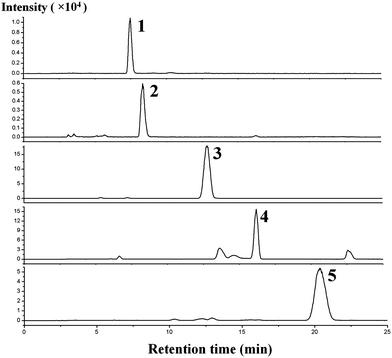 | ||
| Fig. 7 MRM chromatograms for Oryza sativa samples spiked with five CKs. Spiked concentration: 2.5 ng g−1 FW. Peaks: (1) K; 2 (6-BA); (3) iP; (4) Z; (5) DHZ. The pretreatment conditions and HILIC/ESI-MS/MS conditions are described in the Experimental section. | ||
Quantification analysis was carried out on several plant samples. Amounts of cytokinins in Oryza sativa, Arabidopsis thaliana and oil seed rape are shown in Table 8. The MRM chromatograms of detected cytokinins are shown in Fig. 8. K, iP, Z, DHZ were detected and determined from Oryza sativa samples and K, iP, Z from Arabidopsis thaliana and oil seed rape. As a practical method for real sample analysis, ability to separate different cytokinins belonging to the same class is necessary. Therefore, we introduced this method to more cytokinins analysis. Fig. 9 displays the MRM chromatograms of ten cytokinin standards separated by HILIC. By using HILIC, baseline separation of cytokinin bases, ribosides, and 9-glucosides was easily obtained with isocratic elution. The amounts of 8 cytokinins in three different kinds of Oryza sativa are shown in Fig. 10, illustrating the satisfying results obtained. The amounts of endogenous CKs present in Oryza sativa and Arabidopsis thaliana samples are in agreement with those reported previously.10,17
| Oryza sativa (n = 3) | Arabidopsis thaliana (wild type,n = 3) | Arabidopsis thaliana (transgenic type, n = 3) | Oil seed rape (n = 3) | |
|---|---|---|---|---|
| a n.d: Not detected. b Unit: ng g−1 FW. | ||||
| iP | 0.088 ± 0.003 | 0.123 ± 0.050 | 48.2 ± 0.405 | 0.0416 ± 0.006 |
| K | 0.247 ± 0.009 | 2.22 ± 0.051 | 0.573 ± 0.003 | 15.4 ± 0.133 |
| Z | 0.0873 ± 0.014 | 0.0785 ± 0.006 | 0.597 ± 0.009 | 0.0679 ± 0.004 |
| DHZ | 0.0645 ± 0.008 | n.d. | n.d. | n.d. |
| 6-BA | n.d. | n.d. | n.d. | n.d. |
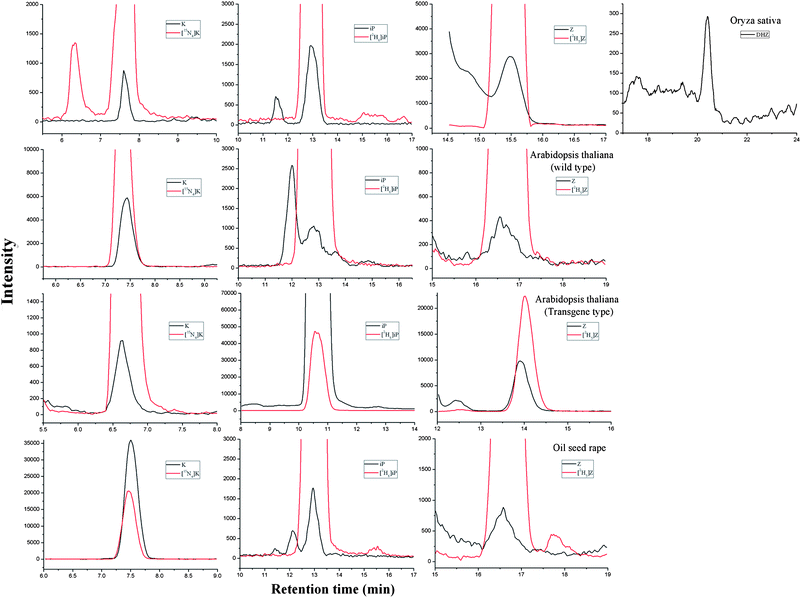 | ||
| Fig. 8 MRM chromatograms of detected cytokinins in Oryza sativa, Arabidopsis thaliana (wild type and transgenic type) and oil seed rape extracts. | ||
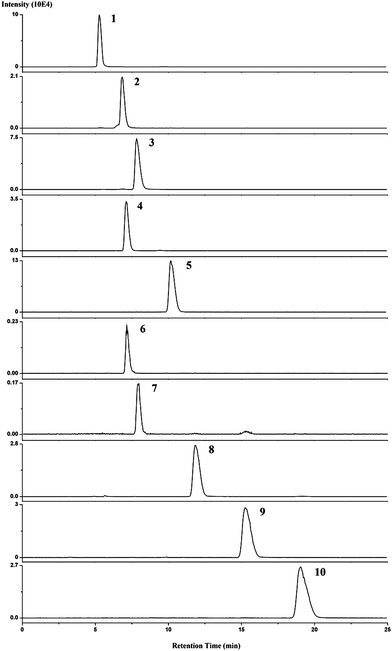 | ||
| Fig. 9 MRM chromatograms of 10 ppb cytokinins separated by HILIC. The HILIC/ESI-MS/MS conditions are described in the Experimental section. Peaks: (1) iPR; (2) t-ZR; (3) DHZR; (4) iP9G; (5) t-Z9G; (6) K; (7) 6-BA; (8) iP; (9) t-Z; (10) DHZ. | ||
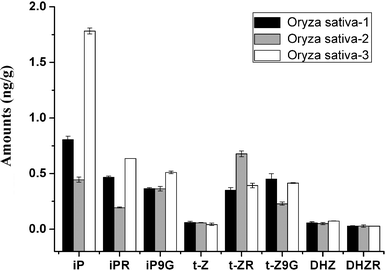 | ||
| Fig. 10 Amounts of detected cytokinins in three kinds of Oryza sativa extracts. | ||
Conclusion
In conclusion, we successfully introduced poly(AMPS-co-EDMA) monolithic capillary column as PMME tools coupled with HILIC/ESI-MS/MS to the enrichment and separation of cytokinins in plant samples. Compared to the previously reported pretreatment method, PMME was an environmentally friendly, inexpensive and convenient sample pretreatment technique. In addition, the selection of HILIC offers higher sensitivity than the traditional RPLC, and better separation of target analytes from impurities was obtained. The combination of PMME and HILIC/ESI-MS/MS provides an alternatively reliable and sensitive tool for future cytokinin studies in plant samples.Acknowledgements
This work was partly supported by the National Science Fund for Distinguished Young Scholars (No.20625516), the National Nature Science Fund (No. 90717101), the Science Fund for Creative Research Groups (No. 20921062), NSFC. The authors would like to thank Wang Yan-Ping, Professor Wu Yan (Wuhan University) and Professor Li Chuan-You (Institute of Genetics and Developmental Biology, Chinese Academy of Sciences) for their gifts of cytokinin standards and plant materials.References
- O. N. Kulaeva, N. N. Karavaiko, S. Y. Selivankina, I. E. Moshkov, G. V. Novikova, Y. V. Zemlyachenko, S. V. Shipilova and E. M. Orudgev, Plant Growth Regul., 1996, 18, 29–37 CrossRef CAS.
- K. Takei, T. Yamaya and H. Sakakibara, J. Plant Res., 2003, 116, 265–269 Search PubMed.
- C. O. Miller, F. Skoog, M. H. V. Saltza and F. M. Strong, J. Am. Chem. Soc., 1955, 77, 1392 CrossRef CAS.
- L. Y. Ge, J. W. H. Yong, S. N. Tan and E. S. Ong, Electrophoresis, 2006, 27, 2171–2181 CrossRef CAS.
- T. Werner and T. Schmülling, Curr. Opin. Plant Biol., 2009, 12, 527–38 CrossRef CAS.
- O. Novák, P. Tarkowski, D. Tarkowská, K. Doležal, R. Lenobel and M. Strnad, Anal. Chim. Acta, 2003, 480, 207–218 CrossRef CAS.
- R. Maldiney, B. Leroux, I. Sabbagh, B. Sotta, L. Sossountzov and E. Miginiac, J. Immunol. Methods, 1986, 90, 151–158 CrossRef CAS.
- A. Grayling and D. E. Hanke, Phytochemistry, 1992, 31, 1863–1868 CrossRef CAS.
- L. Y. Ge, J. W. H. Yong, S. N. Tan, X. H. Yang and E. S. Ong, J. Chromatogr. A, 2004, 1048, 119–126 CrossRef CAS.
- O. Novák,, E. Hauserová, P. Amakorová, K. Doležal and M. Strnad, Phytochemistry, 2008, 69, 2214–2224 CrossRef CAS.
- L. Hernández, P. Hernández, M. Rica and F. Galán, Anal. Chim. Acta, 1995, 315, 33–39 CrossRef CAS.
- P. Hernández, F. Paton, Y. Ballesteros and L. Hernández, Electroanal., 1997, 9, 235–238 CAS.
- E. J. Trione, G. M. Banowetz, B. B. Krygier, J. M. Kathrein and L. Sayavedra-Soto, Anal. Biochem., 1987, 162, 301–308 CAS.
- J. A. Van Rhijn, H. H. Heskamp, E. Davelaar, W. Jordi, M. S. Leloux and U. A. T. Brinkman, J. Chromatogr. A, 2001, 929, 31–42 CrossRef CAS.
- L. Y. Ge, J. W. H. Yong, N. K. Goh, L. S. Chia, S. N. Tan and E. S. Ong, J. Chromatogr. B, 2005, 829, 26–34 CrossRef CAS.
- Y. Izumi, A. Okazawa, T. Bamba, A. Kobayashi and E. Fukusaki, Anal. Chim. Acta., 2009, 648(2), 215–225 CrossRef CAS.
- M. Kojima, T. Kamada-Nobusada, H. Komatsu, K. Takei, T. Kuroha, M. Mizutani, M. Ashikari, M. Ueguchi-Tanaka, M. Matsuoka, K. Suzuki and H. Sakakibara, Plant Cell Physiol., 2009, 50, 1201–1214 CrossRef CAS.
- P. Tarkowski, L. Y. Ge, J. W. H. Yong and S. N. Tan, Trac-trend Anal. Chem., 2009, 28, 323–335 Search PubMed.
- B. Dejaegher, D. Mangelings and Y. V. Heyden, J. Sep. Sci., 2008, 31, 1438–1448 CrossRef CAS.
- N. D. Weng, J. Chromatogr. B, 2003, 796, 209–224 CrossRef CAS.
- Y. Guo and S. Gaiki, J. Chromatogr. A, 2005, 1074, 71–80 CrossRef CAS.
- R. Horgan, in: Isolation of Plant Growth Substances, Society for Experimental Biology, ed. J. R. Hillman, Seminar Series 4, Cambridge, UK, 1978, pp. 97 Search PubMed.
- E. Hauserova, J. Swaczynova, K. Dolezal, R. Lenobel, I. Popa, M. Hajduch, D. Vydra, K. Fuksova and M. Strnad, J. Chromatogr. A, 2005, 1100, 116–125 CrossRef CAS.
- P. I. Dobrev and M. Kamínek, J. Chromatogr. A, 2002, 950, 21–29 CrossRef.
- Y. Wen, Y. Wang, B. S. Zhou, Y. Xu and Y. Q. Feng, Chinese J. Anal. Chem., 2007, 35, 681–684 Search PubMed.
- Y. Wen, Y. Wang and Y. Q. Feng, J. Sep. Sci., 2007, 30, 2874–2880 CrossRef CAS.
- M. M. Zheng, G. D. Ruan and Y. Q. Feng, J. Chromatogr. A, 2009, 1216, 7510–7519 CrossRef CAS.
- H. J. Zhang, J. F. Huang, B. Lin and Y. Q. Feng, J. Chromatogr. A, 2007, 1160, 114–119 CrossRef CAS.
- M. M. Zheng, M. Y. Zhang and Y. Q. Feng, J. Sep. Sci., 2009, 32, 1965–1974 CrossRef CAS.
- M. M. Zheng, M. Y. Zhang, G. Y. Peng and Y. Q. Feng, Anal. Chim. Acta, 2008, 625, 160–172 CrossRef CAS.
- Q. Ma and Y. Q. Feng, Chinese J. Chromatogr., 2009, 27, 731–736 Search PubMed.
- Y. Fan, Y. Q. Feng, S. L. Da and Z. G. Shi, Anal. Chim. Acta, 2004, 523, 251–258 CAS.
- A. J. Alpert, J. Chromatogr. A, 1990, 499, 177–196 CrossRef CAS.
- P. Hemstrom and K. Irgum, J. Sep. Sci., 2006, 29, 1784–1821 CrossRef.
| This journal is © The Royal Society of Chemistry 2010 |
