Near infrared spectroscopy of urine proves useful for estimating ovulation in giant panda (Ailuropoda melanoleuca)
Kodzue
Kinoshita
a,
Hiroyuki
Morita
b,
Mari
Miyazaki
a,
Natsuki
Hama
c,
Hideyasu
Kanemitsu
c,
Hiroshi
Kawakami
c,
Pengyan
Wang
d,
Osamu
Ishikawa
c,
Hiroshi
Kusunoki
a and
Roumiana
Tsenkova
*a
aBiosystem Analysis, Graduate School of Agriculture, Kobe University, Rokkodai 1-1, Nada-ku, Kobe, 657-8501, Japan. E-mail: rtsen@kobe-u.ac.jp; Fax: +81-078-803-5908; Tel: +81-078-803-5908
bGraduate School of Engineering, Kobe University, Kobe, 657-8501
cKobe Municipal Oji Zoo, Kobe, 6570-838, Japan
dChina Research and Conservation Center for the Giant Panda, Sichuan, 623-006, China
First published on 24th September 2010
Abstract
The usefulness of near infrared spectroscopy (NIRS) to monitor urine estrogen concentrations was studied in order to determine optimal timing for breeding captive female giant pandas. NIR spectra of daily urine samples from a female giant panda (Ailuropoda melanoleuca) were acquired in the period between March 1st and 25th, 2007 (n = 53). Estrone-3-glucuronide (E1G) concentrations in the samples were also measured by enzyme immunoassay (EIA). Transmittance spectra of all urine samples were obtained in the wavelength range from 1100 to 2432 nm (excluding the range from 1884 to 2012 nm) with sample thickness of 1 mm. Partial least square regression was applied to the spectra and good correlation was obtained between E1G concentration measured by EIA and predicted values by NIR (R2 = 0.94, SECV = 10.04 ng ml−1). The results of both soft-independent modeling of class analogy (SIMCA) and moving principal component analysis (MPCA) could detect the time changes in E1G concentration as measured by EIA (the Pearson's correlation coefficients between E1G concentration and the interclass distances of SIMCA or the index of MPCA were r = 0.64 and r = 0.81 respectively, P < 0.01). As for MPCA index, the index sharply dropped on March 24th corresponding to the decrease of the E1G concentration indicating ovulation. Finally, artificial insemination was performed for 3 consecutive days including the peak day, March 24th, and the female became pregnant. These results indicated that NIRS and the following MPCA analysis of the respective urine spectral data could detect the changes of urinary hormones during estrous cycle at a nanogram level. The NIRS can find the optimal timing for breeding quicker and easier than EIA, so this technique can be useful for captive breeding of this threatened species.
Introduction
Giant panda (Ailuropoda melanoleuca) has been categorized as “Endangered” in 2009 IUCN Red List of Threatened Species.1 Thus, to maintain the population, captive breeding must be carried out. However, reproductive efficiency is not good because females are monoestrus with spontaneous ovulation during a breeding season.2 Therefore, accurate monitoring of the estrus state to pinpoint the timing of ovulation is critical for successful artificial insemination (AI). Enzyme immunoassay (EIA) or radioimmunoassay (RIA) has ordinarily been used to estimate the optimal ovulation timing by monitoring estrogens in blood, urine or feces of females.3,4 Especially the latter excretions are most appropriate for noninvasive collection.5,6 However, these analyses need long processing with expensive reagents or radioactive isotopes.Recently, near infrared spectroscopy (NIRS) has been demonstrated as a useful tool in various fields for rapid, non-destructive and accurate compositional analysis.7–10 In the area of animal health monitoring, NIRS has been successful in mastitis diagnosis of dairy cows.11 NIRS of the vulva and vestibule has been applied for accurately detecting estrus in cattle.12 However, there have only been a few reports in connection with hormones analyzed by NIRS.13–15 The present investigation aimed to assess whether NIRS could monitor urinary estrogen in female giant pandas.
Materials and methods
Animals and urine sampling
Samples from a female giant panda, born on September 16th 1995, living at the Kobe Municipal Oji Zoo were used in this study. Daily urine samples were collected from March 1st to 25th 2007 (n = 53). Urine excreted during the night was collected the following morning; during the day urine was immediately collected after urination. These samples were centrifuged for 4 min at 650 × g immediately after collection, and the supernatant was stored at −40 °C until EIA assay and spectral analysis were performed.Artificial insemination
During the urine estrogen-sampling period, semen was collected by electroejaculation from a male giant panda living at the zoo. The semen was diluted with TEST-yolk buffer (Irvine Scientific, Santa Ana, CA, USA) and stored at 4 °C until AI. AI was done according to the method described by Hama et al.16Estrogen measurement with EIA
The urinary concentration of Estrone-3-glucuronide (E1G), the major estrogen metabolite excreted in the urine during estrus of giant panda,17 was measured by EIA. EIA was carried out using a double antibody method, as described by Hama et al.18 Briefly, 96-well plates were pre-coated with 4.41 ng ml−1 goat anti-rabbit IgG (H + L) (Catalogue No. 270335, Seikagaku Biobusiness Co., Tokyo, Japan) diluted with coating buffer (0.01 M Na2CO3-10H2O, 0.03 M NaHCO3, pH 9.6). Samples were diluted with EIA buffer (0.15 M NaCl, 0.04 M Na2HPO4-2H2O, 0.1% bovine serum albumin, pH 7.2), and 20 μl of the dilution was added to 96-well plate in duplicate. To obtain a standard curve, 0.015625-2 ng ml−1 E1G (Catalog No. E1752, Sigma-Aldrich Japan, Tokyo, Japan) dilutions with the EIA buffer were dispensed into the wells in duplicate instead of samples. Immediately after the addition of 100 μl of the E1G 1st antibody (dilution: ×50,000,000, Catalog No. FKA224-E, Cosmo Bio Co., Ltd., Tokyo, Japan) and the equal volume of horseradish peroxidase conjugated E1G (dilution: ×500,000, Catalog No. FKA223, Cosmo Bio Co., Ltd.), the plates were incubated for over 2 h at 20 °C in the dark. Free-bound separation was achieved by emptying the plate and washing four times with 0.05% Tween-80 solution. A mixture of 75 μl of substrate-buffer solution A (0.01 M urea-hydrogen peroxide, 0.1 M Na2HPO4, 0.05 M citric acid) and 75 μl of solution B (0.002 M 3,3′, 5,5′, -tetra methyl benzidine, 4% dimethylsulfoxide, 0.05 M citric acid) was added to each well followed by incubation for 40 min at 37 °C in the dark. The reaction was stopped by the addition of 4N H2SO4 (50 μl) and the absorbance was measured using a microplate reader (Model550, BIO-RAD Laboratories Inc.) at 450 nm. E1G values were means of duplicate determinations. The cross-reactivity of the 1st antibody was as follows: 100% for estrone; 170% for E1G; 25% for estrone-3-sulfate; 1% for estradiol; 0.1% for estriol; 1.2% for estradiol-3-glucuronide; 0.1% for estradiol-3-sulfate; 0.05% for testosterone; 0.07% for 4-androstenediol; 0% for progesterone; 0% for cortisol and 0% for 17-α-OH-progesterone. The inter-assay co-efficient of variation was 15.4% (n = 6) and the intra-assay co-efficient of variation was 5.16% (n = 3).Spectra acquisition
NIR transmittance spectra of urine samples from 1100 to 2432 nm with 1 nm (about 8 cm−1) intervals were collected using a spectrophotometer model MPA (Brucker Inc. Billerica, MA) fitted with a quartz cuvette with 1 mm optical path length. Each sample was warmed up to 37 °C in water bath for spectral analysis. The NIR instrument recorded 3 consecutive spectra for each sample in order to obtain more robust models.Chemometrics analysis
All chemometrics analyses were carried out by Pirouette (Version 4.0, Infometrix, Bothell, WA) and Matlab (Version 7.1, MathWorks, Inc., South Natick, MA) software programs. Mean centering was applied for all data analysis. The range from 1884 to 2012 nm was excluded because of the high absorption and saturation. Therefore, in this study the ranges of 1100–1884 nm and 2012–2432 nm were applied for quantitative and qualitative analyses to investigate the spectral changes caused by various concentrations of hormones in the urine samples.To predict the urinary estrogen concentration, a calibration model was developed using partial least square regression (PLSR). PLSR utilized both the spectra and respective reference data for the examined samples to determinate latent variables (PLS factors). The optimum number of PLS factors was defined to be the one that corresponded to the lowest standard error of cross validation (SECV). In cross validation, 1 sample (3 spectra) was temporarily removed from the calibration set and later on, it was used for validation. With the rest of the samples, a PLS model was developed and applied to predict the respective urine component content of the removed sample. The results were compared with the respective reference value. This procedure was repeated several times until a prediction for all samples was obtained. Performance statistics were accumulated for each sample. The average of validation errors was calculated and presented of SECV, which was accepted as a measure of the accuracy of determination.19
To examine the pattern of spectral changes in time series as E1G content increased over the time, interclass distances and soft-independent modeling of class analogy (SIMCA) method were applied. SIMCA classification is based on making a principal components analysis (PCA) model for each class in the training set.20 Spectral interclass distances were calculated for each day in the time series towards the urine spectra collected at the first day of investigation when the female had been in an estrous state. The interclass distance was used as criterion to investigate the spectral change over the time. The interclass distance shows the separation between classes and if it is above 3, it suggests well separated classes.21 As the preprocessing of all spectra, mean centering and normalization by 2-norm of each spectrum (vector) were conducted. Independent variables were divided by the length of the sample vector.
Further on, moving principal component analysis (MPCA)22 was employed to develop models for urine NIR spectral monitoring. A few researchers have studied the use of PCA to monitor dynamic processes based on the analysis of NIR spectra.23,24 MPCA applies the idea that changes in urinary components can be detected by monitoring the principal components (PC) loadings. Time-window was adapted to calculate PC successively. To detect a variation of PC loadings, reference PC loading representing normal operating condition was defined. The reference PC loading was calculated using the spectra of urine collected at the first, second and third day of urine sample collection when the female had been in an estrous state. Further on, the differences between the reference PC loading and moving PC loadings respective to each measurement condition were used as indexes for monitoring. The window size was 9 data points (3 days) acquired from 3 urine samples and the moving step was 3 data points (1 day), 1 sample. The change of Index Ai was in a good agreement with E1G and it was used for detecting the flux of hormones in urine samples.
| Ai = 1 − |wTiw0| |
To evaluate the relationship between E1G concentration and the interclass distances of SIMCA or the index of MPCA, Pearson correlation coefficients (r) were calculated. The Probability (P) value of <0.01 was designated as highly significant. These statistical analyses were performed using the software program SPSS Version 10.0 for Windows (SPSS, Chicago, IL, USA).
Results and discussion
In domestic animals, for example pig (Sus scrofa domesticus) and cattle (Bos taurus), the optimal timing for breeding is assessed by the observation of estrus behavior. However, estrus symptoms can be indistinct in non domestic animals.6 Therefore, EIA or RIA for steroids has been employed to assess the optimal timing for breeding of threatened species.25,26 However, such methods, making use of antigen-antibody reactions, need expensive reagents and are time-consuming. Additionally, it is impossible to measure hormone concentrations by RIA in Zoos and Aquariums, as RIA requires the use of isotopes. In giant pandas the prediction of optimal timing is possibly missed due to their unique characteristic of single estrus per year.2 Thus, NIRS was applied in the study in order to reduce the problems caused by this characteristic.It has been previously reported that NIRS could determine testosterone content in thin-film composites.13 In this study, we evaluate this analytical method for monitoring of urinary steroid hormone.
Endocrinological studies on giant panda have revealed that the concentration of estrogen conjugate (E1G) in plasma and urine increases during the follicular phase and then decreases a few days after ovulation.17 In the female used in this study, E1G concentrations, measured with EIA, ranged from 0.22 to 127.88 ng ml−1 (n = 53). The values showed an increase gradually from the level of 0.80 ng ml−1 on March 13th to a peak of 127.88 ng ml−1 on March 23rd after which a sharp decline was observed. AIs with fresh and liquid-stored semen were performed for 3 days starting from the peak day. The female became pregnant and had a stillbirth on August 12th. It is known that the timing of insemination leading to pregnancy is one or two days following the estrogen peak.27 Therefore, the ovulation in this female was thought to occur around March 24th.
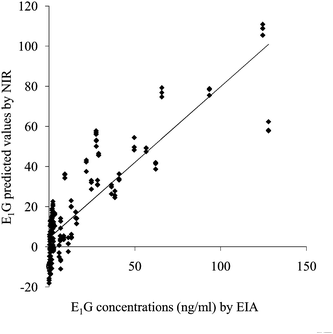
The relationship between urinary E1G concentrations and NIR predicted values is illustrated in Fig. 1. PLSR was used to develop a model for E1G based on urine NIR spectra. Correlation coefficient, R2, based on internal validation was 0.94, and Standard error of cross validation (SECV) was 10.04 ng ml−1 using 7 optimal PLS factor (cumulative percent was 99.995%). High coefficients in the regression vector plot for the total urinary E1G determination model were found at 1427, 1500, 1695, 1728, 2200 and 2295 nm. These results showed a good correspondence of predicted values to actual E1G concentration with EIA. The high number of correlation coefficient meant NIR spectra could detect the E1G concentrations change.
 | ||
| Fig. 1 Relationship between actual measurements by EIA and NIR predicted values for E1G concentration of female giant panda. | ||
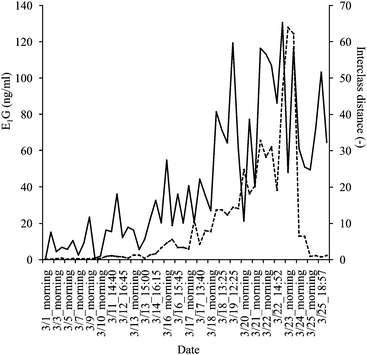
On the SIMCA analysis, the interclass distance calculated from the urine spectra data showed an increasing tendency as the E1G content raised (Fig. 2). The Pearson correlation coefficient (r) was r = 0.64 (P < 0.01) (n = 52). However, the peak of E1G concentration, as measured by EIA, did not agree with the highest interclass distance (Fig. 2). Therefore, it was difficult to evaluate the timing of ovulation with this SIMCA model.
 | ||
Fig. 2 Monitoring results of SIMCA interclass distance values (—) and E1G concentrations as measured by EIA (![[dash dash, graph caption]](https://www.rsc.org/images/entities/char_e091.gif) ) in the same urine samples. ) in the same urine samples. | ||
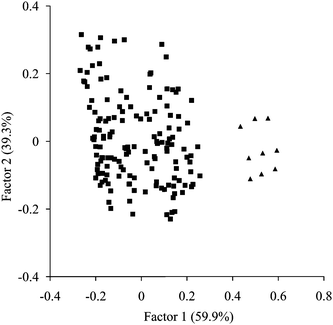
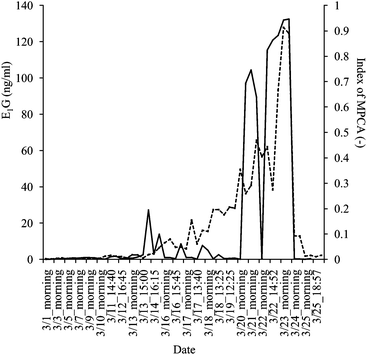
Further on, in the PCA analysis, PC1 explained well the variance between scores of high E1G concentrations obtained from March 21st to 23rd and the others (Fig. 3). Therefore, the index of MPCA was calculated based on PC1. High coefficients in the PC1 loading were found at 1427, 1500, 1695, 1728, 2200 and 2295 nm. These wavelengths corresponded to high coefficients in the regression vector. The change of MPCA index is illustrated in Fig. 4. The Pearson correlation coefficient (r) between the E1G concentration and the index of MPCA was r = 0.81 (P < 0.01) (n = 50). Hence, the accuracy of MPCA was greater than that of SIMCA. Moreover, MPCA index showed an increase on March 14th just before E1G concentration started to increase. Also the index sharply dropped on March 24th corresponding to the decrease of the E1G concentration indicating ovulation, although it also decreased once on March 22nd. Further studies have the possibility to improve the MPCA method to pinpoint the exact timing of ovulation.
 | ||
| Fig. 3 PCA of urine spectral data over the wavelength range from 1100–2432 nm (excluding the range from 1884 to 2012 nm). ▲ are the plots of high E1G concentrations obtained from March 21st to 23rd, ■ are the others. | ||
 | ||
Fig. 4 Monitoring results of MPCA index (—) and E1G concentrations as measured by EIA (![[dash dash, graph caption]](https://www.rsc.org/images/entities/char_e091.gif) ) in the same urine samples. ) in the same urine samples. | ||
Our results show that both SIMCA and MPCA provide good correlation with E1G concentrations, i.e., high correlation coefficients were obtained between spectral and reference data. Specifically, the index of MPCA changed according to the E1G variation. Until this time, it has been thought that it was difficult to measure very small amounts of components by NIRS.28 However, a few reports recently described successful determination of the pg/ml or ng ml−1 order.29–31 Daneshvar et al.31 reported that NIR allowed detection limits of antigen at ng ml−1 order comparable to those of ELISA methods. Our results also suggested that NIRS could detect hormone levels even at ng ml−1 order.
NIRS is a non-destructive and non-polluting method for quality and quantity evaluation and on-line measurement can be performed rapidly and without pretreatment. Application of this method will be very helpful in captive species conservation.
Conclusions
This study considered the possibility of using NIRS for monitoring urinary steroid hormones in a captive female giant panda. Our results show good agreement between E1G values predicted by NIRS, to actual E1G concentration, as determined by EIA, using PLS with 7 PLS factors (R2 = 0.94, SECV = 10.04 ng ml−1). The results of quantitative analysis using SIMCA interclass distance and the MPCA index calculated by using PC1 gave Pearson's correlation coefficient of 0.64 and 0.81 respectively (P < 0.01). It was noteworthy that the MPCA index showed spectra changes on the same day when E1G concentration fluctuated. Our results clearly showed that spectral data was able to provide information on E1G in urine samples. This study suggests that NIR spectra of urine have the potential to estimate the estrus state in female giant pandas. However, further research is required to develop more accurate NIRS models for practical use in terms of prediction, as artificial breeding needs the exact timing of ovulation. Future efforts could improve NIRS to match the accuracy obtained with EIA.Acknowledgements
The authors are grateful to all staff in charge of the giant panda management at the Kobe Municipal Oji Zoo. We also thank collaborators in the field of Biosystem Analysis and the Faunal Diversity Sciences, Graduate School of Agriculture, Kobe University. Finally, we would like to thank Dr Maria Vassileva for helpful comments and suggestions.References
- IUCN, IUCN Red List of Threatened Species. Version 2009.1. http://www.iucnredlist.org, Downloaded on 26 October 2009 Search PubMed.
-
K. J. Steiman, S. L. Monfort, L. MacGeehan, D. C. Kersey, F. Gual-Sil, R. J. Snyder, W. Pengyan, T. Nakao and N. M. Czykala, in Giant pandas: Biology, Veterinary Medicine and Management, ed. E. W. David, Z. Anju, Z. Hemin, L. J. Donald and E. Susie, Cambridge University Press, Cambridge, 2006, pp. 198–230 Search PubMed
.
- J. L. Brown, Theriogenology, 2006, 66, 25–36 CrossRef CAS
.
- S. Larson, C. J. Casson and S. Wasser, Gen. Comp. Endocrinol., 2003, 134, 18–25 CrossRef CAS
.
- N. M. Czekala, S. Gallusser, J. E. Meier and B. L. Lasley, Zoo Biol., 1986, 5, 1–6 CrossRef CAS
.
- K. Kinoshita, S. Inada, Y. Aramaki, K. Seki, M. Ashida, N. Hama, M. Ohazama and H. Kusunoki, Jpn. J. Zoo Wildlife Med., 2009, 14, 59–66 Search PubMed
.
- R. Tsenkova, S. Attanassova, K. Toyoda, Y. Ozaki, K. Itoh and T. Fearn, J. Dairy Sci., 1999, 82, 2344–2351 CrossRef CAS
.
- K. G. Adamopoulos and A. M. Goula, J. Food Eng., 2004, 63, 199–207 CrossRef
.
- W. Li, Y. D. Huang, L. Liu and N. T. Chen, Compos. Sci. Technol., 2005, 65, 1668–1674 CrossRef CAS
.
- R. Tsenkova, J. Near Infrared Spectrosc., 2009, 17, 303–314 CrossRef CAS
.
- H. Meilina, S. Kuroki, B. M. Jinendra, K. Ikuta and R. Tsenkova, Biosyst. Eng., 2009, 104, 243–249 CrossRef
.
- R. A. Kunzler, D. H. Clark and D. P. Marcinkowski, Theriogenology, 1992, 38, 935–44 CrossRef CAS
.
- W. Fountain, K. Dumstorf, A. E. Lowell, R. A. Lodder and R. J. Mumper, J. Pharm. Biomed. Anal., 2003, 33, 181–189 CrossRef CAS
.
- C. Medina-Gutiérrez, J. L. Quintanar, C. Frausto-Reyes and R. Sato-Berrú, Spectrochim. Acta, Part A, 2005, 61, 87–91 CrossRef CAS
.
- M. Xia, S. Yang, J. W. Simpkins and H. Liu, Appl. Opt., 2007, 46, 8315–8321 CrossRef CAS
.
- N. Hama, K. Kanemitsu, M. Tanikawa, M. Shibaya, K. Sakamoto, Y. Oyama, T. J. Acosta, O. Ishikawa, W. Pengyan and K. Okuda, J. Vet. Med. Sci., 2009, 71, 879–884 Search PubMed
.
- L. McGeehan, X. Li, L. Jackintell, S. Huang, A. Wang and N. M. Czekala, Zoo Biol., 2002, 21, 449–466 CrossRef CAS
.
- N. Hama, H. Kanemitsu, K. Sakamoto, Y. Oyama, T. J. Acosta, O. Ishikawa, W. Pengyan and K. Okuda, J. Reprod Dev., 2008, 54, 281–285 CrossRef CAS
.
- R. Tsenkova, S. Atanassova, K. Itoh, Y. Ozaki and K. Toyoda, J Anim. Sci., 2000, 78, 515–522 Search PubMed
.
- C. R. Rodriguez-Saona, L. E. Rodriguez-Saona and C. J. Frost, J. Chem. Ecol., 2009, 35, 163–175 CrossRef CAS
.
-
O. M. Kvalheim and T. V. Karstang, in Multivariate pattern recognition in chemometrics, ed. R. G. Brereton, Elsevier, Amsterdam, 1992 Search PubMed
.
- M. Kano, S. Hasebe, I. Hashimoto and H. Ohno, Comput. Chem. Eng., 2001, 25, 1103–1113 CrossRef CAS
.
- H. Shinzawa, S. Morita, Y. Ozaki and R. Tsenkova, Appl. Spectrosc., 2006, 60, 884–891 CrossRef CAS
.
- M. J. Lee, C. R. Park, A. Y. Kim, B. S. Kwon, K. H. Bang, Y. S. Cho, M. Y. Jeong and G. J. Choi, J. Pharm. Sci., 2010, 99, 325–335 CrossRef CAS
.
- L. H. Graham, K. L. Goodrowe, J. I. Raeside and R. M. Liptrap, Zoo Biol., 1995, 14, 223–237 CrossRef CAS
.
- N. M. Czekala, B. S. Durrant, L. Callison, M. Williams and S. Millard, Zoo Biol., 1994, 13, 119–128 CrossRef CAS
.
- N. M. Czekala, L. McGeehan, K. Steinman, L. Xuebing and F. Gual-Sil, Zoo Biol., 2003, 22, 389–400 CrossRef CAS
.
- F. S. G. Lima, M. A. S. Araújo and L. E. P. Borges, Tribol. Int., 2003, 36, 691–696 CrossRef CAS
.
- A. Sakudo, R. Tsenkova, T. Onozuka, K. Morita, S. Li, J. Warachit, Y. Iwabu, G. Li, T. Onodera and K. Ikuta, Microbiol. Immunol., 2005, 49, 695–701 Search PubMed
.
- X. Zhao and S. A. Shippy, Anal. Chem., 2004, 76, 1871–1876 CrossRef CAS
.
- M. I. Daneshvar, J. M. Peralta, G. A. Casay, N. Narayanan, Lawrence Evans III, G. Patonay and L. Strekowski, J. Immunol. Methods, 1999, 226, 119–128 CrossRef CAS
.
| This journal is © The Royal Society of Chemistry 2010 |
