Separation and determination of structurally related free bile acids by pressurized capillary electrochromatography coupled to laser induced fluorescence detection
Yimin
Wu
a,
Xiaochun
Wang
a,
Qingzheng
Wu
a,
Xiaoping
Wu
*a,
Xucong
Lin
a and
Zenghong
Xie
*ab
aCollege of Chemistry and Chemical Engineering, Fuzhou University, 350108, China. E-mail: wapple@fzu.edu.cn
bXiamen Huaxia Vocational College, Xiamen, 361024, China. E-mail: zhxie@fzu.edu.cn
First published on 15th October 2010
Abstract
A sensitive pressurized capillary electrochromatography-laser induced fluorescence detection (pCEC-LIF) method has been developed for the simultaneous analysis of five structurally related free bile acids including cholic acid (CA) and lithocholic acid (LCA), as well as the stereoisomers of chenodeoxycholic acid (CDCA), deoxycholic acid (DCA) and ursodeoxycholic acid (UDCA). 4-nitro-7-N-piperazino-2,1,3-benzoxadiazole (NBD-PZ) was used for the precolumn derivatization of non-chromogenic free bile acids to form strongly fluorescent adducts. Efficient separation of these derivatization products was performed within 17 min by isocratic elution pCEC on an octadecyl silica (ODS) packed capillary column, using a mobile phase consisting of acetonitrile and 10 mM CAPS buffer (pH 8.0) (60![[thin space (1/6-em)]](https://www.rsc.org/images/entities/char_2009.gif) :
:![[thin space (1/6-em)]](https://www.rsc.org/images/entities/char_2009.gif) 40 v/v), 20 kV of applied voltage and 10.8 MPa of supplementary pressure. The derivatized bile acids could be determined by a LIF detector at an excitation wavelength of 473 nm and an emission wavelength of 530 nm, with detection limits (signal/noise = 3) down to 2 nmol L−1. Applicability of this pCEC-LIF method to the analysis of human serum samples was demonstrated. Accepted recoveries ranging between 94.8% and 109.7% for all analytes in spiked human serum samples were achieved. This method has potential for the trace analysis of physiologically important acidic analogs.
40 v/v), 20 kV of applied voltage and 10.8 MPa of supplementary pressure. The derivatized bile acids could be determined by a LIF detector at an excitation wavelength of 473 nm and an emission wavelength of 530 nm, with detection limits (signal/noise = 3) down to 2 nmol L−1. Applicability of this pCEC-LIF method to the analysis of human serum samples was demonstrated. Accepted recoveries ranging between 94.8% and 109.7% for all analytes in spiked human serum samples were achieved. This method has potential for the trace analysis of physiologically important acidic analogs.
1. Introduction
Bile acids (BAs), one class of physiologically important carboxylic acids, have received renewed attention recently.1 As important metabolites of cholesterol catabolism existing in biological fluids in small quantities, BAs play a vital role in many physiological functions such as cholesterol homeostasis, lipid absorption, and generation of bile flow.2 It has been found that the concentration and profile of BAs in biological fluids can serve as useful indicators that provide information regarding an individual's metabolism and potentially hepatobiliary and intestinal disease states.3,4 There was a close connection between BAs metabolism failure and various hyper- or hypo-cholesterolemia diseases, as well as a number of cancers. Furthermore, the content of certain therapeutic agents including chenodeoxycholic acid (CDCA) and ursodeoxycholic acid (UDCA) in serum could be used as a useful index for monitoring therapy progress.5 Recently, BAs have been recognized as regulatory molecules at the cellular level,6 which regulate a series of metabolisms through the activation of specific nuclear receptors and cell signaling pathways.Accurate measurements of individual BAs eliciting different physiological and pathological responses in vivo are of great importance for clinical and biological research, however, the analysis of BAs in human body fluids is a challenging task. The BAs are usually present in body fluids at micromolar levels and have very poor absorption in UV or visible regions. Moreover, the structural differences between individual BAs based on a steroidal backbone are too small to be separated by conventional separation methods. The major BAs in humans are derivatives of 5β-cholan-24-oic acids. As shown in Fig. 1, the primary BAs cholic acid (CA), CDCA and the secondary BAs deoxycholic acid (DCA), lithocholic acid (LCA) and UDCA only differ in the degree and pattern of hydroxylation, and even contain stereoisomers (diastereomers), i.e. UDCA, DCA, CDCA.7 Chromatographic techniques represent the method of choice for detailed analysis of BAs profiles. Several chromatographic techniques have been employed for BAs determination in biological fluids,7,8 mainly based on thin layer chromatography (TLC),9 gas chromatography (GC),7,10 high performance liquid chromatography (HPLC)8,11–15 and micro column high performance liquid chromatography (μHPLC).16 HPLC is still the most frequently used method for the analysis of BAs due to its outstanding resolving power, even though it usually requires gradient elution and a large volume of sample and solvent. Capillary zone electrophoresis (CZE) and micellar electrokinetic chromatography (MEKC), which combine high efficiency and low sample and solvent consumption, have also been applied for BAs separation in biological fluids.4,7,17 In most cases, cyclodextrins (CD) were needed to improve the resolution of the structurally related BAs, especially for the stereoisomers of UDCA, DCA and CDCA.
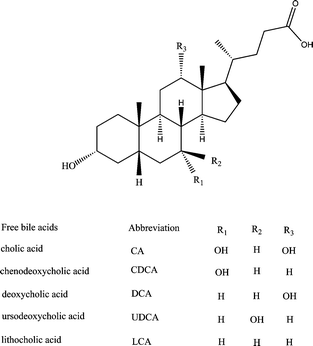 | ||
| Fig. 1 Chemical structure of free bile acids (BAs) included in the study. | ||
Capillary electrochromatography (CEC), a relatively new miniaturized separation technique that combines the advantages of HPLC and CE,18 has proven to be a powerful tool for analogs separation,19–21 including animal BAs.22 Pressurized CEC (pCEC) is a new CEC mode by applying supplementary pressure on the CEC column to overcome bubbles formation and column drying-out problems,23 which always hinder the repeatability and the extensive application of the CEC technique. In such mode, the mobile phase is driven by both electroosmotic flow (EOF) and pressure, which results in adjustable selectivity, faster elution and less bubble formation than pure EOF-driven CEC. Like other capillary techniques, pCEC is very useful in situations when an efficient separation is needed for the analytes presented in samples with very small amounts, but it also suffers from low concentration sensitivity due to a minute sample volume and limited optical path length when coupled with UV detection. Recently, several selective and sensitive detection methods, such as amperometric detection,24 chemiluminescence detection,25 mass spectrometry,23 laser induced fluorescence detection (LIF),26 nuclear magnetic resonance,27 have been successfully coupled with pCEC for fulfilling the demand of detection sensitivity of various real samples. The hyphenation of pCEC to LIF that fuses the merits of high separation selectivity and high detection sensitivity, have already been developed for the analysis of pollutants,28 pharmaceuticals,29 and amino acids.30 Ultra-trace levels (nmol L−1) of detection limits could be achieved for the analogs with the pCEC-LIF method, which provides a potential powerful separation tool for the analysis of endogenous biological constituents in biological and clinical applications. So far, nearly all CEC/pCEC methods coupled with LIF focus on the analysis of native fluorescence substances or the amino compounds. The analysis of acidic compounds was still rarely performed, which was probably due to the difficulty in effective derivatization. pCEC-LIF will provide a new alternative analytical method for physiologically important carboxylic acids, which are usually non-chromogenic and are present from μmol L−1 to nmol L−1 levels in biofluids.
In this work, an isocratic elution pCEC coupled to a laser diode double pumped solid state (LD-DPSS) LIF method has been developed for the rapid analysis of five structurally related free BAs. To enhance the sensitivity and reduce the interference from endogenous compounds in complex biological samples, an amine-type benzofurazan fluorescence reagent with long excitation and emission wavelengths, 4-nitro-7-N-piperazino-2,1,3-benzoxadiazole (NBD-PZ),31 was first introduced for analysis of free BAs with precolumn derivatization. The reaction was quickly carried out under mild conditions, and produced highly fluorescent adducts that could be selectively separated and sensitively determined by pCEC-LIF on an ODS packed CEC column. The experimental parameters affecting the pCEC analysis were evaluated. Application of the proposed method for simultaneous quantification of free BAs from the human serum is also described.
2. Experimental
2.1 Instrumentation
The pCEC-LIF system was set up in our laboratory, which was composed of a pCEC separation system and a LIF detection system. The pCEC separation system modified from TriSep-2010GV CEC system (Unimicro Technologies, Pleasanton, CA, USA) consisted of a high-pressure micro-LC pump (Unimicro Technologies), a 0.8 μL six-port injection valve (Valco Instruments, Houston, TX, USA), a four-port split valve (Upchurch Scientific, Oak Harbour, WA, USA), a 0−±30 kV high voltage power supply (Unimicro Technologies, Pleasanton, CA, USA), and a self-made capillary flow-cell holder. The LD-DPSS LIF detector (10 mW, Dalian Institute of Chemical Physics, Chinese Academy of Sciences), was operated with 473 nm as an excitation wavelength, and the intensity of fluorescence was measured over the integration range above 530 nm, using a high-pass filter. Data collection and processing was performed using a chromatographic workstation system (Qianpu Software Co., Nanjing, China).The commercial packed capillary column (100 μm I.D. × 375 μm O.D.) was obtained from Global Chromatography Ltd. (Su Zhou, China). The total length of the capillary was 45 cm, of which 15 cm was packed with 3 μm octadecyl silica (ODS) particles. A 1∼2 mm detection window was created immediately behind the packed section by removing the polyimide capillary coating with a thermal wire stripper.
2.2 Materials
Cholic acid (CA), deoxycholic acid (DCA), chenodeoxycholic acid (CDCA), ursodeoxycholic acid (UDCA), and lithocholic acid (LCA) were purchased from Sigma-Aldrich (St. Louis, MO, USA) and used as BAs standards. 4-Nitro-7-N-piperazino-2,1,3-benzoxadiazole (NBD-PZ) was from Tokyo Kasci chemicals (Tokyo, Japan). Triphenylphosphine (TPP), 2,2′-dipyridyl disulfide (DPDS), N-cyclohexyl-3-aminopropanesulfonic acid (CAPS), sodium salt (99%), 4-(2-hydroxyethyl)-1-piperazineethanesulfonic acid (HEPES) (99%), 2-(N-morpholino)ethanesulfonic acid (MES) (99%), N,N-dimethylformamide (DMF) were purchased from Alfa Aesar (Ward Hill, MA, USA). Acetonitrile (ACN) and methanol (Chemical Reagent Corporation, Shanghai, China) were of HPLC grade. Sodium phosphate monobasic, sodium phosphate dibasic dodecahydrate, sodium hydroxide, phosphoric acid, and triethylamine (TEA) (Chemical reagent Plant, Shanghai, China) were of analytical grade. All the other chemicals used in this study were of analytical grade. All sample and buffer solutions were prepared with ultrapure water supplied by a Milli-Q purification system (Millipore, Milford, MA, USA).BAs stock solutions were prepared as 5 × 10⁻³ mol L−1 in methanol respectively. The stock solutions were stored in darkness at 4 °C prior to use, and further diluted by ACN as appropriate. 20 mmol L−1 NBD-PZ stock solution was prepared in DMF and diluted to the desired concentration by ACN, then stored in a refrigerator at −20 °C. TPP and DPDS solutions were prepared as 560 mmol L−1 in ACN and also stored in a refrigerator at 4 °C. The CAPS buffer used in this experiment was prepared with CAPS sodium salt and the pH modified with phosphoric acid. The TEAP buffer was prepared with TEA and phosphoric acid, and the phosphate buffer (PBS) was prepared with sodium phosphate monobasic and sodium phosphate dibasic dodecahydrate.
2.3 Sample preparation
Human serum samples were collected from a healthy volunteer (provided by the Department of Clinical Laboratory, Fuzhou General Hospital). A simple sample preparation procedure was adopted with little modification from Tagliacozzi et al.13 For protein precipitation, 200 μL of serum was mixed with 500 μL of ACN in a 5 mL polyethylene centrifuge tube. The sample mixture was vigorously mixed using a vortex mixer for 2 min and then centrifuged at 10000 rpm for 10 min. Then, the supernatant was collected in another 5 mL polyethylene centrifuge tube and the residue was dissolved with 500 μL of ACN, it was then mixed using a vortex mixer for 2 min and centrifuged at 10000 rpm for 15 min. The two collected supernatants were amalgamated and then blown to dryness with nitrogen gas. The residue was dissolved with 200 μL of ACN, then taken for derivatization and analyzed by pCEC.2.4 Derivatization procedure
The derivatization of BAs with NBD-PZ was performed in ACN as solvent in the presence of activation reagent. The following derivatization procedure was applied to both standard solutions and serum samples obtained after the sample preparation step: 10 μL of sample aliquots, 10 μL of 400 mM TPP and 10 μL of 400 mM DPDS in ACN, were reconstituted in a 500 μL polyethylene centrifuge tube, followed by 1 min vortex-mixing. Then 10 μL of 10 mM NBD-PZ and additional ACN was added to keep the initial volume of the mixture at 50 μL. After being vortex-mixed for 1 min again, the resulting mixture was kept at 32 °C for 2 h in the dark. The obtained aliquots were diluted with ACN prior to pCEC injection.2.5 pCEC procedures
In this experiment, an isocratic elution pCEC mode was used. The mobile phases were prepared by mixing organic solvent and various buffer solutions at certain percentages. A negative voltage was applied to the outlet of the column, and the inlet of the column was connected to the split valve and grounded. A supplementary pressure (10.8 MPa) was applied to the column inlet and the flow rate of the pump was 0.05 mL min−1 during the separation. The voltage applied on the outlet vial was 20 kV. The wavelength for LIF detection is λex/λem = 473 nm/530 nm.3. Results and discussion
3.1 Derivatization reaction of BAs
NBD-PZ is a prominent derivatization reagent having a piperazine moiety as a reactive functional group. When CA was used as a model compound for optimizing the derivatization reaction for BAs, it was found that NBD-PZ could equally react with the carboxyl functional group to produce the corresponding fluorescence amide in the presence of activation reagents such as DPDS and TPP, and the reaction could be carried out under mild reaction conditions at 32 °C (see Fig. 2). The maximum excitation was found at 470 nm, and the maximum emission was at 540 nm,31 which is match for the LD-DPSS laser (473 nm) excitation source used in the pCEC-LIF system.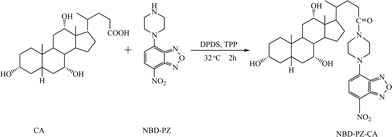 | ||
| Fig. 2 The reaction scheme for the derivatization of cholic acid (CA) with NBD-PZ. | ||
Factors affecting the labelling reaction, such as concentration of activation reagents, reaction time, reaction temperature and the molar ratio between NBD-PZ and BAs, were investigated to optimize the labelling efficiency. As shown in Fig. 3a, by comparison of the relative fluorescent intensity of derivatives at different molar ratios between NBD-PZ and CA (concentrations for derivatization were 0.1 mmol L−1), a 100-fold molar excess of NBD-PZ was found to be adequate for achieving a satisfactory reaction yield and a relatively low background. Higher concentrations of NBD-PZ caused no significant enhancement of labelling efficiency. The effect of concentration of the activation reagents (DPDS and TPP) on the yield of the derivatization reaction was investigated (shown in Fig. 3b), and a maximum of labelling efficiency was obtained at a concentration of DPDS and TPP of 400 mmol L−1 respectively. All derivatization reactions were performed at this concentration.
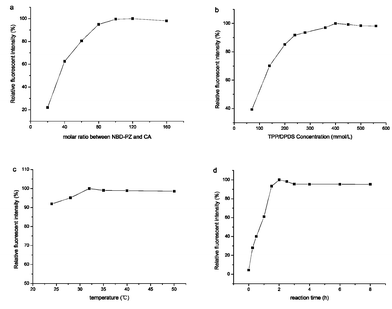 | ||
| Fig. 3 The influence of (a) molar ratio between NBD-PZ and CA; (b) DPDS and TPP concentration; (c) reaction temperature; (d) reaction time, on the derivatization. Experimental conditions: capillary column: 45 cm (packing length 15 cm) × 100 μm I.D., packed with ODS (3.0 μm), mobile phase: 60% ACN–40% TEAP buffer (10 mmol L−1, pH 7.0); applied voltage 15 kV, supplementary pressure 7.2 MPa, pump flow rate 0.1 mL min−1; wavelength for LIF detection: λex/λem = 473 nm/530 nm. The derivatization conditions were as described as section 2.4. | ||
In previous reports, the NBD-PZ derivatization was usually performed at room temperature. We found that the derivatization reaction of BAs could be accelerated by increasing the temperature to 32 °C (shown in Fig. 3c). No significant change of the reaction yield could be found with the reaction temperature further increased to 50 °C. Thus, 32 °C is considered as a suitable reaction temperature. The time required for completion of the reaction between NBD-PZ and BAs was also investigated by comparison of the peak area of the derivatives in various time intervals (as shown in Fig. 3d). The derivatization occurred rapidly in the first 1.5 h of the reaction period. With time increasing, the reaction rate decreased and the reaction yield gradually became stable when the reaction time exceeded 2 h. 2 h was used for all of BAs derivatizations in subsequent experiments. Further experiments indicated that the peak area of the derivatives did not decrease within 24 h, which meant that the BAs derivatives were sufficiently stable for quantitative analysis. In order to ensure the reproducibility of this method, all the derivatives were kept at 4 °C in the dark and analyzed within 6 h after completing the reaction.
3.2 Separation and determination of the derivatized BAs with pCEC-LIF
Five structurally related free BAs containing the stereoisomers of CDCA, DCA and UDCA, which were derivatized by the optimized derivatization reaction, were separated on a 3 μm ODS packed silica CEC column by pCEC. Different pCEC parameters, such as the composition of the mobile phase, the applied voltage and the supplementary pressure, were investigated to optimize the retention and selectivity of the analytes.Five types of buffer solution, PBS, TEAP, CAPS, HEPES and MES, were compared in the same concentration with 60% v/v ACN. It was found that the use of zwitterionic buffers (CAPS, MES, and HEPES) could effectively reduce the analysis time and lower the conductivity. Better peak shape and less interference from the residual NBD-PZ were obtained when using CAPS buffer. Therefore, CAPS buffer was selected as the buffer for the mobile phase in further studies.
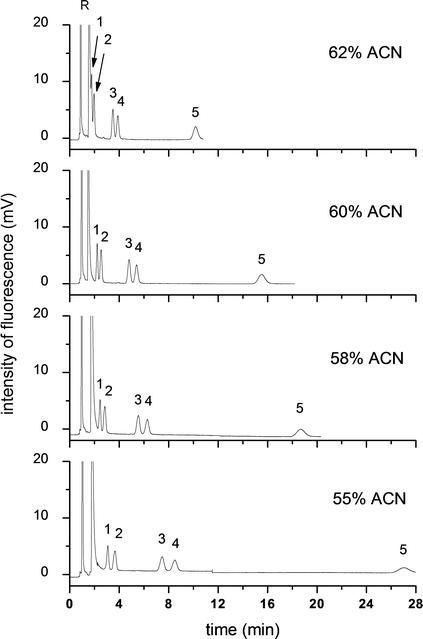 | ||
| Fig. 4 Effect of ACN content on the pCEC separation of five free BAs. Experiment conditions: capillary column: 45 cm (packing length 15 cm) × 100 μm I.D., packed with ODS (3.0 μm), mobile phase: ACN–CAPS buffer (10 mmol L−1, pH 8.0); applied voltage 20 kV, supplementary pressure 10.8 MPa, pump flow rate 0.05 mL min−1, wavelength: λex/λem = 473 nm/530 nm; 4.7 × 10⁻⁷ mol L−1 of each analytes. Analytes: 1: NBD-CA; 2: NBD-UDCA; 3: NBD-CDCA; 4: NBD-DCA; 5: NBD-LCA; R: NBD-PZ. | ||
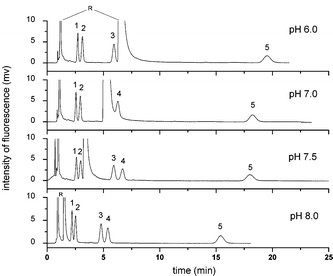 | ||
| Fig. 5 Effect of buffer pH on the pCEC separation of five free BAs. Experiment conditions: mobile phase: 60% (v/v) ACN, 40% (v/v) CAPS buffer (10 mmol L−1). All other conditions were the same as in Fig. 4. Analytes: 1: NBD-CA; 2: NBD-UDCA; 3: NBD-CDCA; 4: NBD-DCA; 5: NBD-LCA; R: NBD-PZ. | ||
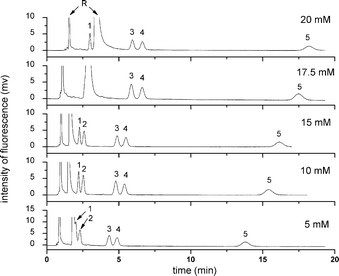 | ||
| Fig. 6 Effect of concentration of CAPS buffer on the pCEC separation of five free BAs. Experiment conditions: mobile phase: 60% (v/v) ACN, 40% (v/v) CAPS buffer (pH 8.0). All other conditions were the same as in Fig. 4. Analytes: 1: NBD-CA; 2: NBD-UDCA; 3: NBD-CDCA; 4: NBD-DCA; 5: NBD-LCA; R: NBD-PZ. | ||
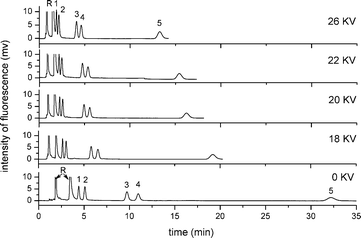 | ||
| Fig. 7 Effect of applied voltage on the pCEC separation of five free BAs. Experiment conditions: mobile phase: 60% (v/v) ACN, 40% (v/v) of CAPS buffer (pH 8.0, 10 mmol L−1). All other conditions were the same as in Fig. 4. Analytes: 1: NBD-CA; 2: NBD-UDCA; 3: NBD-CDCA; 4: NBD-DCA; 5: NBD-LCA; R: NBD-PZ. | ||
In pCEC, the application of supplementary pressure could not only shorten the analysis time, but also assure the reliability and repeatability of the electrochromatographic system, by avoiding the formation of bubbles during the separation. With the pressure increasing from 3.5 to 13.0 MPa by a back-pressure regulator applied to the column inlet, a decrease in retention time of all analytes and a little loss of resolution were observed. A supplementary pressure up to 10.8 MPa could be employed to achieve the compromise between analysis time and resolution.
The optimal pCEC chromatogram of five NBD-PZ labelled free BAs was listed in Fig. 8. All the analytes could be separated within 17 min at the isocratic elution condition, owing to the cooperative action of both pressurized flow and EOF. The separation time of this proposed method could be much shorter than that of the widely used HPLC method (in ca. 1 h).7,8
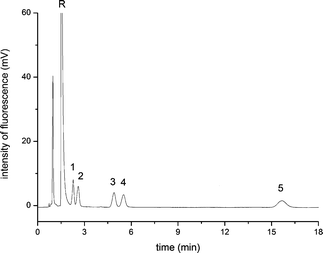 | ||
| Fig. 8 The pCEC chromatogram of five free BAs under the optimum derivatization and separation conditions. Experiment conditions: capillary column: 45 cm (packing length 15 cm) × 100 μm I.D., packed with ODS (3.0 μm), mobile phase: 60% (v/v) ACN, 40% (v/v) CAPS buffer (pH 8.0, 10 mmol L−1); applied voltage 20 kV, flow rate 0.05 mL min−1, supplementary pressure 10.8 MPa, wavelength: λex/λem = 473 nm/530 nm; 4.7 × 10⁻⁷ mol L−1 of each analytes. Analytes: 1: NBD-CA; 2: NBD-UDCA; 3: NBD-CDCA; 4: NBD-DCA; 5: NBD-LCA; R: NBD-PZ. | ||
| Analytes | Regression equationa | r 2 | Calibration range/mol L−1 | LOD/mol L−1 (S/N = 3) | LOQ/mol L−1 (S/N = 10) |
|---|---|---|---|---|---|
| a Y: peak area of BAs derivatives (mV s), X: amount concentration (10−8 mol L−1). | |||||
| CA | Y = 613.4X + 1794.1 | 0.9983 | 4.0 × 10⁻⁸∼5.0 × 10⁻⁶ | 2.0 × 10⁻⁹ | 4.0 × 10⁻⁸ |
| UDCA | Y = 769.8X + 1590.1 | 0.9995 | 5.0 × 10⁻⁸∼5.0 × 10⁻⁶ | 3.0 × 10⁻⁹ | 5.0 × 10⁻⁸ |
| CDCA | Y = 1278.5X + 218.9 | 0.9997 | 5.0 × 10⁻⁸∼3.0 × 10⁻⁶ | 5.0 × 10⁻⁹ | 5.0 × 10⁻⁸ |
| DCA | Y = 538.7X + 146.3 | 0.9992 | 5.0 × 10⁻⁸∼2.0 × 10⁻⁶ | 6.0 × 10⁻⁹ | 5.0 × 10⁻⁸ |
| LCA | Y = 335.0X + 750.6 | 0.9999 | 1.0 × 10⁻⁷∼4.0 × 10⁻⁶ | 9.0 × 10⁻⁹ | 1.0 × 10⁻⁷ |
The detection limits (LOD, defined as the minimum analyte concentration yielding a signal/noise ratio equal to 3) for the derivatized free BAs were obtained in the range of 2∼9 nmol L−1, and the quantification limits (LOQ, defined as the minimum analyte concentration yielding a signal/noise ratio equal to 10) ranged from 4.0 × 10⁻⁸∼1.0 × 10⁻⁷ mol L−1. The detection and quantification limits of the proposed method were much lower than the CE4,17 and HPLC12 methods coupled with an UV detector or indirect detection, and has reached the most sensitive level of the previous reports (about nmol L−1∼sub nmol L−1 for LODs) with HPLC-fluorescence14 and HPLC-MS/MS.8,15 The proposed method meets the demand of clinical and biological studies for free BAs in μmol L−1∼nmol L−1 levels. The inter-day and intra-day repeatabilities were also investigated, which includes the repeatability of the whole analytical procedure (both derivatization and instrumental precision). The inter-day RSD (n = 5) of the retention time and peak area of the five analytes were in the range of 0.9%∼2.7% and 1.9%∼5.6% respectively, and intra-day RSD (n = 5) were 2.6%∼6.8% and 5.3%∼9.4% respectively, which indicated acceptable precision of this method for routine analysis. The RSDs of critical resolution were 6.86% for reagent and peak 1, 3.76% for peak 1 and 2, and 2.12% for peak 3 and 4 (intra-day repeatabilities, n = 9). Though the RSD of resolution for reagent and peak 1 was higher than other “critical pairs”, the relative higher resolution (Rs ≥ 3) made it still acceptable for efficient separation and correct quantification.
3.3 Analytical application
The proposed pCEC-LIF method was applied to determine free BAs contents in a healthy adult human serum sample. The complete extraction and derivatization procedures were carried out according to the established method as described in the experimental section. The examined concentration of endogenous free BAs in healthy human serum (Table 2) is similar to that obtained in previous reports with GC-MS10 and LC-MS/MS.13,15 The reliability of the established pCEC-LIF detection method was estimated by spiking certain standard analytes to serum samples. The total concentrations of the analytes in the spiked sample and the endogenous concentrations in the unspiked sample were determined and used to calculate the recovery. Mean recoveries were between 94.8% and 109.3% with a RSD less than 6.6% (Table 2), which indicated the applicability and satisfactory repeatability of the established method in real sample analysis.| Analytes | Endogenous value (Mean ± SD)/μmol L−1 | Added value/μmol L−1 | Measured value (Mean ± SD)/μmol L−1 | Recovery (%)a | RSD (%) |
|---|---|---|---|---|---|
| a Recovery (%) = (Measured value − Endogenous value)/(Added value)] ×100. | |||||
| CA | 0.180 ± 0.005 | 0.600 | 0.748 ± 0.035 | 94.8 | 4.6 |
| UDCA | 0.102 ± 0.004 | 0.600 | 0.739 ± 0.039 | 106.2 | 5.3 |
| CDCA | 0.135 ± 0.008 | 0.600 | 0.790 ± 0.034 | 109.3 | 4.3 |
| DCA | 0.130 ± 0.007 | 0.600 | 0.762 ± 0.050 | 105.4 | 6.6 |
| LCA | 0.129 ± 0.005 | 0.600 | 0.753 ± 0.028 | 103.9 | 3.7 |
4. Conclusions
In this work, a pCEC-LIF method has been developed for the highly selective separation and sensitive determination of free BAs in human serum. Five structurally related free BAs containing the stereoisomers could be rapidly separated in isocratic elution mode by the combined cooperative action of pressure and electroosmotic flow. Owing to the improved labelling efficiency of the highly fluorescent reagent NBD-PZ, detection limits of nmol L−1 levels could be achieved for BAs in this experiment. The results have demonstrated a potential feasibility of pCEC-LIF for analysis of low content physiologically important carboxylic acids, by fulfilling the analysis requirement of ultra-trace amount of non-chromogenic substances in complex biological samples and minimizing sample consumption. Combining the high selectivity with high sensitivity and low sample and solvent consumption, the pCEC-LIF method could be further developed for the research of BAs for clinical and pharmacological studies.Acknowledgements
This project was financially supported by funding from the National Natural Science Foundation (20907009, 40976071), Program for New Century Excellent Talents in University of China (NECT-06-0572) and of Fujian Province (HX2006-99) and the Key Science & Technology Project of Fujian Province (2008Y2004, 2008Y0020).Notes and references
- W. C. Duane, J. Lipid Res., 2009, 50, 1507–1508 CAS.
- I. F. Duarte, C. L. Quigley, D. A. Parker, J. R. Swann, M. Spraul, U. Braumann, A. M. Gil, E. Holmes, J. K. Nicholson, G. M. Murphy, H. V. Melendez, N. Heaton and J. C. Lindon, Mol. BioSyst., 2009, 5, 180–190 RSC.
- B. Bartling, L. Li and C.-C. Liu, Analyst, 2009, 134, 973–979 RSC.
- G. Castano, S. Lucangioli, S. Sookoian, M. Mesquida, A. Lemberq, M. Di, P. Franchi and C. Carducci, Clin. Sci., 2006, 110, 459–465 Search PubMed.
- F. M. Konikoff, MedGenMed, 2003, 5, 8–14 Search PubMed.
- P. B. Hylemon, H. Zhou, W. M. Pandak, S. Ren, G. Gil and P. Dent, J. Lipid Res., 2009, 50, 1509–1520 CAS.
- A. Roda, F. Piazza and M. Baraldini, J. Chromatogr., B: Biomed. Sci. Appl., 1998, 717, 263–278 CrossRef CAS.
- W. J. Griffiths and J. Sjövall, J. Lipid Res., 2010, 51, 23–41.
- A. Pyka and M. Dolowy, J. Liq. Chromatogr. Relat. Technol., 2005, 28, 1573–1581 CrossRef CAS.
- L. J. Meng, H. Reyes, J. Palma, I. Hernandez, J. Ribalta and J. Sjövall, J. Hepatol., 1997, 27, 346–357 CrossRef CAS.
- R. Gatti, A. Roda, C. Cerre, D. Bonazzi and V. Cavrini, Biomed. Chromatogr., 1997, 11, 11–15 CrossRef CAS.
- S. Chaudhury and M. F. Chaplin, J. Chromatogr., B: Biomed. Sci. Appl., 1999, 726, 71–78 CrossRef CAS.
- D. Tagliacozzi, A. F. Mozzi, B. Casetta, P. Bertucci, S. Bernardini, C. Dillio, A. Urbani and G. Federici, Clin. Chem. Lab. Med., 2003, 41, 1633–1641 CrossRef CAS.
- J. You, Y. Shi, X. Zhao, H. Zhang, Y. Suo, Y. Li, H. Wang and J. Sun, J. Sep. Sci., 2006, 29, 2837–2846 CrossRef CAS.
- X. Xiang, Y. Han, M. Neuvonen, J. Laitila, P. J. Neuvonen and M. Niemi, J. Chromatogr., B: Anal. Technol. Biomed. Life Sci., 2010, 878, 51–60 CrossRef CAS.
- M. Novotny, K. Karlsson, M. Konishi and M. Alasandro, J. Chromatogr., A, 1984, 292, 159–167 CrossRef CAS.
- V. P. Tripodi, S. E. Lucangioli, S. L. Scioscia and C. N. Carducci, J. Chromatogr., B: Anal. Technol. Biomed. Life Sci., 2003, 785, 147–155 CrossRef CAS.
- Y. Deng, J. Zhang, T. Tsuda, P. H. Yu, A. A. Boulton and R. M. Cassidy, Anal. Chem., 1998, 70, 4586–4593 CrossRef CAS.
- I. Mikšík and P. Sedláková, J. Sep. Sci., 2007, 30, 1686–1703 CrossRef CAS.
- Z. Aturki, S. Fanali, G. D'Orazio, A. Rocco and C. Rosati, Electrophoresis, 2008, 29, 1643–1650 CrossRef CAS.
- Y. Huo and W. Th. Kok, Electrophoresis, 2008, 29, 80–93 CrossRef CAS.
- A. H. Que, T. Konse, A. G. Baker and M. V. Novotny, Anal. Chem., 2000, 72, 2703–2710 CrossRef CAS.
- Z. Liang, J. C. Duan, L. H. Zhang, W. B. Zhang, Y. K. Zhang and C. Yan, Anal. Chem., 2004, 76, 6935–6940 CrossRef CAS.
- S. F. Liu, X. P. Wu, Z. H. Xie, X. C. Lin, L. Q. Guo, C. Yan and G. N. Chen, Electrophoresis, 2005, 26, 2342–2350 CrossRef CAS.
- Z. A. Lin, Z. H. Xie, H. X. Lü, X. C. Lin, X. P. Wu and G. N. Chen, Anal. Chem., 2006, 78, 5322–5328 CrossRef CAS.
- C. Yan, R. Dadoo, H. Zhao, R. N. Zare and D. J. Rakestraw, Anal. Chem., 1995, 67, 2026–2029 CrossRef CAS.
- K. Pusecker, J. Schewitz, P. Gfrörer, L. Tseng, K. Albert and E. Bayer, Anal. Chem., 1998, 70, 3280–3285 CrossRef CAS.
- W. Wall, J. Li and Z. El Rassi, J. Sep. Sci., 2002, 25, 1231–1244 CrossRef CAS.
- X. Liu, L. H. Takhashi, W. L. Fitch, G. Roxing, C. Bayle and F. Couderc, J. Chromatogr., A, 2001, 924, 323–329 CrossRef CAS.
- M. Kato, H. Jin, K. Sakai-Kato, T. Toyóoka, M. T. Dulay and R. N. Zare, J. Chromatogr., A, 2003, 1004, 209–215 CrossRef CAS.
- T. Santa, T. Fukushima, T. Ichibangase and K. Imai, Biomed. Chromatogr., 2008, 22, 343–353 CrossRef CAS.
- S. Kitagawa and T. Tsuda, J. Microcolumn Sep., 1995, 7, 59–64 CrossRef CAS.
- L. A. Colón, T. D. Maloney and A. M. Fermier, in: CEC, Z. Deyl and F. Švec, (ed.), J. Chromatogr. Lib., Vol. 62, Elsevier, Amsterdam 2001, pp. 111–159 Search PubMed.
| This journal is © The Royal Society of Chemistry 2010 |
