DOI:
10.1039/C0AY00285B
(Paper)
Anal. Methods, 2010,
2, 1026-1035
Development and optimisation of quantitative analytical method to determine BTEX in environmental water samples using HPLC-DAD
Received
3rd May 2010
, Accepted 25th May 2010
First published on
18th June 2010
Abstract
Petroleum contamination of groundwater and waterways is common throughout the world. Among the fuel components, BTEX compounds are most likely to reach the boreholes and pose a gross risk. The present work describes a simple, reliable analytical technique that fulfils the determination of BTEX (benzene, toluene, ethylbenzene, and xylene isomers) in environmental water samples. The procedure was based on the purge of BTEX (a group of volatile organic compounds (VOCs)) from water samples to a specific volume of acetonitrile prior to making the analysis by high performance liquid chromatography equipped with a photo diode array detector. The developed method was optimised using full factorial design, and the resulting optimum parameters were applied in the experiments of validation which confirm method reliability; recovery was between 94 and 106% with a maximum relative bias of 5.9%, relative standard deviation was less than 7.7% (n = 10), and limit of detection varied from 0.18 to 0.6 μg L−1. Various gas chromatographic methods are available for the analysis of VOCs, but the proposed procedure could be a good alternative choice since many of the conventional methods require time and high cost special techniques coupled with the GC instrument. This analytical method was used successfully to measure the concentrations of BTEX in both laboratory spiked samples and environmental water samples.
1. Introduction
Benzene, toluene, ethylbenzene, ortho-, metha-, and para-xylenes (BTEX) are monoaromatic hydrocarbon compounds which are not strongly adsorbed by soil1,13 and are relatively highly soluble in water when compared to the other hydrocarbons, such as aliphatic hydrocarbons. The low rate of biodegradation of monoaromatic compounds, in addition to their solubility ensure that they are often the first breakthrough products seen when measuring petroleum contamination of water systems. Contamination of water by these compounds is a very serious problem as they are toxic and often classified as carcinogens for humans.1–3 Among the BTEX, benzene is the most dangerous, since it is recognised as a carcinogenic agent.4 The presence of these compounds in both ground and surface water are related to fuel spills, and leaking of underground storage tanks, as well as the release of unburned fuel directly into the atmosphere and surface waters.4–6 The US environmental protection agency (EPA) has included BTEX compounds on the list of national primary drinking water standards and established a maximum contaminant level (MCL) of 5.0 μg L−1 for benzene and values above 0.7–10.0 mg L−1 for the other BTEX.7–9 The European union has also included benzene in the list of 33 priority pollutants in waters, and established an MCL of 1.0 μg L−1 for benzene in drinking water.7,10–12
The low threshold limits of these volatiles in water require accurate and precise measurement of data. Sensitive, accurate analytical methods have been developed to detect the concentration of BTEX pollutants below the maximum permitted levels. According to various EPA methods, the analysis of BTEX in water requires preconcentration/clean-up of the analytes.14 Many methods use gas chromatography (GC) coupled with multiple techniques such as, purge and trap,7,15–17 static headspace (HS),7,17–19 and headspace solid-phase microextraction.7,17–19 In recent years, a number of direct sampling mass spectrometric (MS) methods have been developed for the analysis of environmental samples.7 Solvent free sample preparation methods or those employing less organic solvent are increasingly becoming important and may induce a major change in analytical methodology.20 Solid phase microextraction (SPME), liquid phase microextraction (LPME) and direct aqueous injection (DAI) have been developed as an alternative to traditional methods for sample preparation to eliminate the disadvantages of conventional extraction methods, such as time of operation, large volume of solvent extraction and the use of specialised apparatus too. Since very little solvent is used, there is minimal exposure to toxic organic solvents for the operator.20–23
The aim of this work was to develop and optimise a simple, reliable method which enables the determination of BTEX without using high cost special techniques or large volume of solvents. The apparatus that was used consisted of glass equipment which enabled a stream of pure nitrogen to bubble through the aqueous sample at ambient temperature, transferring the volatile components directly into a specific volume of cooled acetonitrile. A portion of acetonitrile containing the BTEX compounds, was then injected into, and separated through, the HPLC system. HPLC detection was carried out using a photo diode array detector which offers the ability to evaluate peak purity,25 and low detection limits which are comparable with those limits achieved by other conventional analytical methods.24
The experimental parameters: flow rate of nitrogen, purge time, volume of acetonitrile, and sample volume have been analysed, controlled, and optimised using a full factorial model of design of experiments. The design of experiments (DoE) is the methodology of how to conduct and plan experiments in order to obtain the maximum amount of information in the fewest number of runs. Usually, most experiments are done by changing the levels of one factor at a time (COST: Change One Separate factor at a Time) in an unsystematic way in order to try and find the optimum conditions, but, as shown by Fisher,26 COST does not give any information about the position of the optimum parameters where there are interactions among the factors. The most important aspect of DoE is that it provides a strict mathematical framework for changing all pertinent factors simultaneously, in order to achieve this aim using the fewest experimental runs.26 With DoE it is possible to optimise critical factors and identify the best combination of values.27
The proposed analytical technique along with the HPLC analysis method were validated in terms of limits of detection, limits of quantitation, linearity, accuracy and precision. The validated method was then applied to determine BTEX in water samples suspected to be contaminated by petroleum hydrocarbons.
2. Experimental
2.1. Materials and chemicals
Acetonitrile and water were of HPLC grade, purchased from Acros Organics (Geel, Belgium).
A certified standard mixture solution (aromatic hydrocarbons mix 11) which was used in calibration and spiking was purchased from Dr Ehrenstrofer reference materials (Augsburg, Germany). This solution contained 2000 mg L−1 of each substance: benzene, toluene, ethylbenzene and o-, m-, and p-xylene. A primary dilution standard solution was prepared at a concentration of 500 mg L−1 of each substance, by diluting the certified standard mixture solution (1![[thin space (1/6-em)]](https://www.rsc.org/images/entities/char_2009.gif) :
:![[thin space (1/6-em)]](https://www.rsc.org/images/entities/char_2009.gif) 4) in acetonitrile, and stored in an amber glass stoppered bottle (without headspace) at 4 °C. Fresh aqueous working standard solutions were prepared daily by diluting the primary dilution standard solution in water of HPLC grade.
4) in acetonitrile, and stored in an amber glass stoppered bottle (without headspace) at 4 °C. Fresh aqueous working standard solutions were prepared daily by diluting the primary dilution standard solution in water of HPLC grade.
Benzene (>99.5%), toluene (99.5%), ethylbenzene (>99%), o-xylene, m-xylene, p-xylene (>99%) were purchased from Sigma-Aldrich Chemie GmbH (Steinheim, Germany).
A cylinder of pure nitrogen gas >99.999% (Kingdom of Saudi Arabia) regulated with manual pressure and flow controllers was used to provide the purging stream.
2.2. Instruments
HPLC analysis was done using a smartline HPLC system produced by Knauer GmbH (Berlin, Germany) consisting of degasser, gradient pump, manual injector, column oven, and photo diode array detector. Chromatographic separation was performed on a 250 × 4.6 mm, 3 μm, Eurospher C18 column (Knauer GmbH, Berlin, Germany). A PC interfaced to the HPLC using ClarityChrom software (Knauer GmbH) was used for data acquisition and processing.
The measurement of the flow rate of nitrogen gas, which was used to purge BTEX compounds from water samples, was performed using the digital gas flow meter model Intelligent Flow Meter from J&W Scientific (Folsom, CA, USA).
A glass apparatus Scheme 1 was used to carry BTEX compounds from the water sample to the acetonitrile. All its constituent items were with 14/23 joints (inlet tube for nitrogen gas, pear shaped flask 100 mL with angled side neck, stillhead with stopper, receiver adapter, graduated tube). Prior to use, all glass equipment was washed with detergent, rinsed with tap and distilled water, dried at room temperature, placed in a 105 °C oven for one hour, then cooled in an area known to be free of organics.
A general full factorial design FFD, consisting of 4 factors in multiple levels containing 36 runs, was carried out with an aim to investigate the effects of variable factors (nitrogen flow rate NF, purge time PT, sample volume SV and acetonitrile volume AV) on the recovery of the sample preparation procedure in order to obtain their significant effects and screen the important factors. Table 1 illustrates the FFD summary. After having established the significant factors from full factorial design, the optimum sample preparation conditions were attained by using central composite design (CCD) with 22 (2 levels-2 factors) and face centered design (alpha = 1) containing 21 runs. The statistical calculations of factorial design were made using DOE++ software V.1.0.5, ReliaSoft Corp. (USA).
Table 1 Summary of full factorial design with 4 factors in multiple levels
| Factor |
Name |
Units |
Type |
Level |
Level 1 |
Level 2 |
Level 3 |
|
NF: Nitrogen flow rate.
PT: Purge time.
SV: Sample volume.
AV: Acetonitrile volume.
|
| A |
NFa |
mL min−1 |
Qualitative |
3 |
100 |
200 |
300 |
| B |
PT b |
min |
Qualitative |
3 |
10 |
20 |
30 |
| C |
SV c |
mL |
Qualitative |
2 |
50 |
75 |
|
| D |
AV d |
mL |
Qualitative |
2 |
0.5 |
1 |
|
2.5. Analytical procedure
Equal volumes of each laboratory spiked sample or real environmental sample were placed in the designed glassware sample preparation apparatus, mentioned in section 2.3, at room temperature. The optimised sample preparation conditions obtained from full factorial design were applied to allow all purgeable volatile compounds to be thrown out of aqueous media and transferred into a specific volume of acetonitrile placed in a graduated glass tube surrounded by ice and cooled below 4 °C. After having finished the experiments, any loss in the volume of acetonitrile should be replaced.
After that, an aliquot of 50 μL of the acetonitrile was injected into the HPLC system using a flow rate of 1.8 mL min−1 and an isocratic elution with acetonitrile![[thin space (1/6-em)]](https://www.rsc.org/images/entities/char_2009.gif) :
:![[thin space (1/6-em)]](https://www.rsc.org/images/entities/char_2009.gif) water (50
water (50![[thin space (1/6-em)]](https://www.rsc.org/images/entities/char_2009.gif) :
:![[thin space (1/6-em)]](https://www.rsc.org/images/entities/char_2009.gif) 50) as the mobile phase. The separation was accomplished using the mentioned HPLC column at 30 °C for 12 min. The detection was carried out at 201 nm and 245 nm using a photo diode array detector with scanning from 200 to 350 nm.
50) as the mobile phase. The separation was accomplished using the mentioned HPLC column at 30 °C for 12 min. The detection was carried out at 201 nm and 245 nm using a photo diode array detector with scanning from 200 to 350 nm.
2.6. Collection of samples
Two sampling points were chosen in the Deir Azzor area (North East Syria), one of them was a petroleum produced water (Jourzi location, 34°55′26′′ N, 40°35′57′′ E) and the second was surface water next to this petroleum well. Another sampling location was well no. 13 in the Barada well area (33°40′26′′ N, 36°03′14′′ E) where petroleum contamination was expected. Two other sampling points were selected in Damascus (capital of Syria), the first one was from well no. 9 in the Al Kadam well area (33°30′11′′ N, 36°18′42′′ E), and the second was from the rinsing water of a gasoline service station.
Water samples were collected in 100 mL glass containers which were completely filled to the top and stoppered with no headspace. Drops of HCl (1![[thin space (1/6-em)]](https://www.rsc.org/images/entities/char_2009.gif) :
:![[thin space (1/6-em)]](https://www.rsc.org/images/entities/char_2009.gif) 1) were added to each sample at the time of collection to adjust the pH to below 2. All samples were maintained at 4 °C and analysed within 72 h of sampling.
1) were added to each sample at the time of collection to adjust the pH to below 2. All samples were maintained at 4 °C and analysed within 72 h of sampling.
2.7. Method performance and validation
This method was assessed in terms of linearity, detection and quantitation limits, intermediate precision, accuracy, and repeatability data. All statistical data and method performance tests were done with EffiValidation software V.3.0 developed by EffiChem (Czech Republic-EU) and SPSS statistics 17.0 developed by SPSS Inc., and IBM (Chicago, Illinois, USA).
2.7.1. Linearity.
According to EURACHEM guidelines,28 the plot of measurement response against measured concentration was visually examined to identify the approximate linear range, upper and lower limits of the working range. For that, ten different aqueous calibration standard solutions of BTEX prepared in water of HPLC grade at 0.3, 0.5, 1, 10, 50, 200, 500, 800, 1000 and 1500 μg L−1 were analysed using the optimal sample preparation conditions and the chromatographic separation procedure. Then, to calculate linearity, the calibration curves were obtained by analysing six different aqueous calibration standard solutions of BTEX in triplicate within the linear range of each compound.
2.7.2. Specificity.
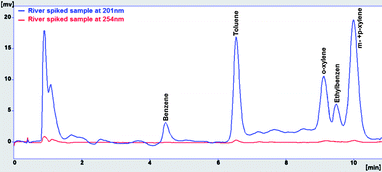
Modern PDA technology is a powerful tool for evaluating specificity. Photo diode array detectors can collect spectra across a range of wavelengths at each data point collected across a peak, and the software compares each of the spectra to determine peak purity distinguishing minute spectral and chromatographic differences not readily observed by simple overlay comparisons.25,29,30 Under described sample preparation and HPLC conditions, the analysis of blank river water spiked with gasoline at a concentration of 1.5 mg L−1 was performed to ensure specificity and to evaluate sample matrix.
2.7.3. Limits of detection (LOD) and of quantitation (LOQ).
Limits of detection (yD) and quantitation (yQ) in mV were estimated according to EURACHEM guidelines,14,28 by analyzing ten independent blank samples using the described method and calculating the mean blank response (xb), and the standard deviation of blank responses (sb) as follows:
The concentration values in μg L−1 of the response limits of detection (LOD) and quantitation (LOQ) for each compound were obtained by projection of the corresponding signals yD and yQ through the calibration curve y = f(x) onto the concentration axis.
To estimate the matrix effect on LOD and LOQ, three different blank samples were analysed: water blank sample of HPLC grade, tap water blank sample and river water blank sample.
2.7.4. Method accuracy and recovery.
According to EURACHEM guidelines,28 method accuracy was studied as two components: “trueness” and “precision”. Trueness was expressed in terms of “bias”, while precision was measured as relative standard deviation.
Trueness, precision and recovery tests were established by analyzing ten replicates of HPLC grade water spiked at three concentrations (0.5, 20 and 1000 μg L−1) on three separate days [day 1 (n = 5), day 2 (n = 3), and day 3 (n = 2)].
To check trueness (bias) at each concentration level, mean recoveries for the ten replicates were determined, and relative bias was measured as a percentage of deviation for the accepted reference value as follows:
| Trueness (bias)% = [(Cm − Cr)/Cr] × 100 |
where
Cm is the mean value for the ten replicate determinations,
Cr is the spiking concentration of reference material.
Method precision was studied as “repeatability” and “intermediate precision” by calculating the percentage relative standard deviation (RSD) of the spiked samples at each concentration level. RSD for the five replicates in day 1 was referred to as the “repeatability”, while RSD within several days for the ten replicates was referred to as the “intermediate precision” as follows:
| Repeatability/Intermediate precision = (SD/Cm) × 100 |
where
SD is the standard deviation of the five/ten replicates respectively, and
Cm is the mean value for the five/ten replicate determinations respectively. Intermediate precision was also evaluated by performing ANOVA on the data acquired over ten days.
Mean recovery was evaluated at each concentration level for the ten replicates as follows:
| Recovery % = (Cm/Cr) × 100 |
3. Results and discussion
3.1. Chromatographic separation
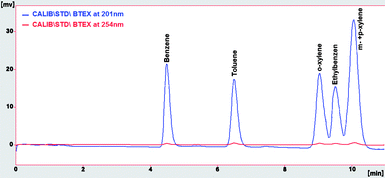
Under described HPLC conditions, the RP-HPLC procedure was performed to analyse direct injection of standard solution at 150 μg L−1 of BTEX in acetonitrile. The chromatogram obtained, illustrated in Fig. 1, has good resolution, and shows that we could have better response to detect low concentration levels of BTEX when the detection is carried out at 201 nm instead of 254 nm, maintaining good resolution and acceptable baseline noise level. Table 2 shows these chromatographic data. As a result, we applied the detection at 201 nm in the following experiments.
 |
| | Fig. 1 Chromatogram of BTEX at 150 μg L−1 in ACN detected at 201 nm (in blue) and 245 nm (in red). | |
Table 2 Comparison between responses obtained from HPLC analysis
The developed method was optimised using water (HPLC grade) spiked at 10 μg L−1. The general full factorial design was employed at first as a screening to evaluate the result and estimate the main effects on the method. Subsequently, the experiments were performed following the above mentioned design and the overall recovery of the BTEX was determined (as the average recoveries of each compound compared with the direct injection of reference BTEX solution in acetonitrile at 10 μg L−1) and is presented in Table 3. Experimental runs were performed in random order according to the developed design to reduce error. The analysis results (analysis of variance ANOVA using partial sum squares and confidence level of 95%) are presented in Table 4 and used to establish a first-order model.
Table 3 Factor levels used in the FFD and the overall BTEX recovery
| Standard order |
Run order |
A: NFa/mL min−1 |
B: PTb/min |
C: SVc/mL |
D: AVd/mL |
Recovery (%) |
|
NF: Nitrogen flow rate.
PT: Purge time.
SV: Sample volume.
AV: Acetonitrile volume.
|
| 29 |
1 |
300 |
20 |
50 |
0.5 |
94.11 |
| 20 |
2 |
200 |
20 |
75 |
1 |
96.71 |
| 32 |
3 |
300 |
20 |
75 |
1 |
93.06 |
| 28 |
4 |
300 |
10 |
75 |
1 |
89.98 |
| 10 |
5 |
100 |
30 |
50 |
1 |
72.01 |
| 27 |
6 |
300 |
10 |
75 |
0.5 |
87.55 |
| 33 |
7 |
300 |
30 |
50 |
0.5 |
85.12 |
| 36 |
8 |
300 |
30 |
75 |
1 |
83.64 |
| 24 |
9 |
200 |
30 |
75 |
1 |
90.28 |
| 34 |
10 |
300 |
30 |
50 |
1 |
84.93 |
| 6 |
11 |
100 |
20 |
50 |
1 |
64.13 |
| 1 |
12 |
100 |
10 |
50 |
0.5 |
58.16 |
| 21 |
13 |
200 |
30 |
50 |
0.5 |
89.89 |
| 16 |
14 |
200 |
10 |
75 |
1 |
78.88 |
| 30 |
15 |
300 |
20 |
50 |
1 |
94.05 |
| 4 |
16 |
100 |
10 |
75 |
1 |
56.94 |
| 35 |
17 |
300 |
30 |
75 |
0.5 |
86.03 |
| 15 |
18 |
200 |
10 |
75 |
0.5 |
79.45 |
| 7 |
19 |
100 |
20 |
75 |
0.5 |
65.19 |
| 26 |
20 |
300 |
10 |
50 |
1 |
87.96 |
| 3 |
21 |
100 |
10 |
75 |
0.5 |
58.01 |
| 11 |
22 |
100 |
30 |
75 |
0.5 |
70.11 |
| 19 |
23 |
200 |
20 |
75 |
0.5 |
95.02 |
| 14 |
24 |
200 |
10 |
50 |
1 |
80.99 |
| 23 |
25 |
200 |
30 |
75 |
0.5 |
90.87 |
| 18 |
26 |
200 |
20 |
50 |
1 |
95.24 |
| 12 |
27 |
100 |
30 |
75 |
1 |
73.33 |
| 25 |
28 |
300 |
10 |
50 |
0.5 |
88.02 |
| 8 |
29 |
100 |
20 |
75 |
1 |
61.24 |
| 22 |
30 |
200 |
30 |
50 |
1 |
89.02 |
| 17 |
31 |
200 |
20 |
50 |
0.5 |
96.15 |
| 31 |
32 |
300 |
20 |
75 |
0.5 |
92.45 |
| 13 |
33 |
200 |
10 |
50 |
0.5 |
76.32 |
| 2 |
34 |
100 |
10 |
50 |
1 |
57.88 |
| 5 |
35 |
100 |
20 |
50 |
0.5 |
62.61 |
| 9 |
36 |
100 |
30 |
50 |
0.5 |
74.97 |
Table 4 Factors and their interaction effects (ANOVA results) in FFD
| Source of variation |
Degrees of freedom |
Sum of squares |
Mean squares |
F ratio |
P value a |
|
α = 0.05, S = 2.5095, R2 = 99.57%, R2(adj) = 96.23%.
|
| Model |
31 |
5825.4186 |
187.9167 |
29.8398 |
0.0023 |
| A: NF |
2 |
4619.6846 |
2309.8423 |
366.7865 |
2.94E-05 |
| B: PT |
2 |
571.1582 |
285.5791 |
45.3479 |
0.0018 |
| C: SV |
1 |
0.2209 |
0.2209 |
0.0351 |
0.8606 |
| D: AV |
1 |
0.0016 |
0.0016 |
0.0003 |
0.988 |
| AB |
4 |
613.7654 |
153.4413 |
24.3654 |
0.0045 |
| AC |
2 |
3.0753 |
1.5376 |
0.2442 |
0.7942 |
| AD |
2 |
2.0153 |
1.0076 |
0.16 |
0.8573 |
| BC |
2 |
0.7689 |
0.3844 |
0.061 |
0.9416 |
| BD |
2 |
3.4745 |
1.7372 |
0.2759 |
0.7723 |
| CD |
1 |
0.0608 |
0.0608 |
0.0097 |
0.9264 |
| ABC |
4 |
3.3247 |
0.8312 |
0.132 |
0.9624 |
| ABD |
4 |
4.4889 |
1.1222 |
0.1782 |
0.9383 |
| ACD |
2 |
0.4806 |
0.2403 |
0.0382 |
0.9629 |
| BCD |
2 |
2.8991 |
1.4495 |
0.2302 |
0.8042 |
| Residual |
4 |
25.19 |
6.2975 |
|
|
| Lack of Fit |
4 |
25.19 |
6.2975 |
|
|
| Total |
35 |
5850.6087 |
|
|
|
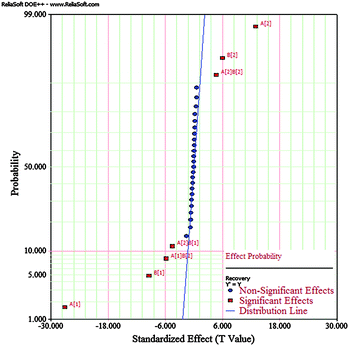
Statistical analysis showed that the nitrogen flow rate, the purge time, and their interactions were significant factors affecting BTEX recovery, which can be seen from the P value below 0.05, while the other two factors (sample volume, acetonitrile volume) and their interactions did not affect the sample preparation method significantly. According to Table 4, the most significant factor was nitrogen flow rate because it had the lowest P value, followed by the purge time as the second most affected factor. The significance of the factors can be confirmed by the normal probability plot displayed in Fig. 2. As can be illustrated, all points nearly on a linear curve on the probability plot are not significant. R2 values of the model were above 0.99 showing excellent variability and good fit of the model to the experimental data points.
 |
| | Fig. 2 Normal probability plot of FFD. | |
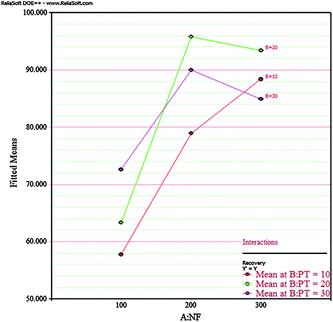
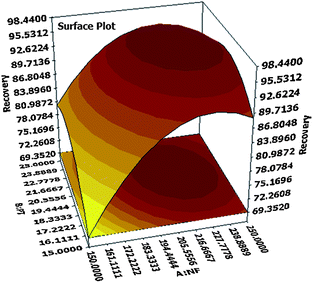
In order to optimise the sample preparation method, the two significant independent factors established by FFD results (nitrogen flow rate and purge time) were further explored, each at three levels. A second order model called the response surface method design based on face centred 22 plus central point design (CCD) was used, since the first order model used for this exploration had lack of fit. The middle values tested in FFD were chosen as central point, as it gave maximum recovery results. This choice could be confirmed according to the NF/PT interaction plot shown in Fig. 3 which has a maximum recovery point at purge time (20 min) and nitrogen flow rate (200 mL min−1). CCD experiments were performed in a random order and in duplicate to ensure reproducibility and reduce error. The other factors were fixed: 75 mL sample and 1 mL acetonitrile volumes. Maximum and minimum levels, central point and results are showed in Table 5.
 |
| | Fig. 3 NF/PT interaction plot of FFD. | |
Table 5 A 22 design plus central point used in CCD
| Standard order |
Run order |
Point type |
A: NFa/mL min−1 |
B: PTb/min |
Recovery (%) |
|
NF: Nitrogen flow rate,
PT: Purge time, Face centered (α = 1).
|
| 3 |
1 |
1 |
150 |
25 |
78.08 |
| 13 |
2 |
−1 |
150 |
20 |
82.42 |
| 8 |
3 |
−1 |
200 |
25 |
93.48 |
| 21 |
4 |
0 |
200 |
20 |
97.91 |
| 6 |
5 |
−1 |
250 |
20 |
92.91 |
| 17 |
6 |
0 |
200 |
20 |
97.01 |
| 20 |
7 |
0 |
200 |
20 |
96.82 |
| 12 |
8 |
1 |
250 |
25 |
91.27 |
| 1 |
9 |
1 |
150 |
15 |
70.53 |
| 14 |
10 |
−1 |
250 |
20 |
93.97 |
| 16 |
11 |
−1 |
200 |
25 |
95.01 |
| 9 |
12 |
1 |
150 |
15 |
67.74 |
| 5 |
13 |
−1 |
150 |
20 |
80.62 |
| 19 |
14 |
0 |
200 |
20 |
97.67 |
| 7 |
15 |
−1 |
200 |
15 |
86.51 |
| 10 |
16 |
1 |
250 |
15 |
89.29 |
| 4 |
17 |
1 |
250 |
25 |
88.63 |
| 18 |
18 |
0 |
200 |
20 |
96.15 |
| 2 |
19 |
1 |
250 |
15 |
90.36 |
| 11 |
20 |
1 |
150 |
25 |
80.59 |
| 15 |
21 |
−1 |
200 |
15 |
88.35 |
ANOVA results of CCD (using partial sum squares and confidence level of 95%) are presented in Table 6 and used to establish a quadratic polynomial (second order) model. We can see from the results presented in Tables 3 and 5 of the FFD and CCD experiments respectively that the overall BTEX recovery decreased while purging time increased above 20 min, probably due to the evaporation of BTEX during longer method run times. Also the overall BTEX recovery decreased while nitrogen flow rate increased above 200 mL min−1 probably because the higher flow rate enhanced the BTEX to leave the acetonitrile phase and evaporate. The ANOVA results obtained from this design showed that the quadratic model did not show lack of fit, the fitted vs. actual values plot for overall BTEX recovery showed a good fit, the correlation coefficient was around 0.98, the residuals vs. fitted values plot showed that there was a random tendency. Thus it can be assumed that the normality, independence and randomness of the residuals were satisfied. As obtained in full factorial design, the nitrogen flow rate was again the most significant factor in CCD. The purge time and the interactions between these two factors also had significant effects. The equation of the quadratic actual value model was the following:
| Recovery = −223.2061 + 1.8120(NF) + 11.8787(PT) − 0.0101(NF)(PT) − 0.0037(NF2) − 0.2323(PT2) |
Table 6 ANOVA results of the CCD experiments
| Source of variation |
Degrees of freedom |
Sum of squares |
Mean squares |
F ratio |
P value a |
|
α = 0.05, S = 1.4168, R2 = 98.03%, R2(adj) = 97.37%.
|
| Model |
5 |
1498.6203 |
299.7241 |
149.3169 |
3.06E-12 |
| A: NF |
1 |
622.8002 |
622.8002 |
310.2673 |
1.97E-11 |
| B: PT |
1 |
97.9265 |
97.9265 |
48.7851 |
4.39E-06 |
| AB |
1 |
50.7528 |
50.7528 |
25.2841 |
0.0001 |
| AA |
1 |
410.6735 |
410.6735 |
204.5897 |
3.79E-10 |
| BB |
1 |
164.9007 |
164.9007 |
82.1504 |
1.79E-07 |
| Residual |
15 |
30.1095 |
2.0073 |
|
|
| Lack of Fit |
3 |
11.9959 |
3.9986 |
2.649 |
0.0965 |
| Pure Error |
12 |
18.1137 |
1.5095 |
|
|
| Total |
20 |
1528.7299 |
|
|
|
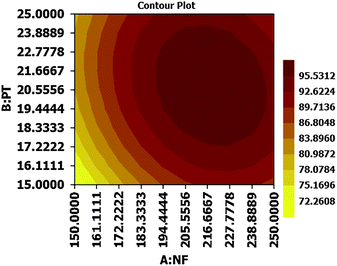
The contour as well as response surface plots elaborated from this equation are shown in Fig. 4 and 5 respectively. From the presented response surfaces and contour plots, it can be seen that maximum efficiency was obtained at about middle levels of nitrogen flow rate and purge time. The software calculated optimal solution as 218.5127 nitrogen flow rate and 20.8282 purge time for maximum recovery of 98.4748. We chose the following as optimal application values for our next experiments: (220 mL min−1) nitrogen flow rate, (20 min) purge time, (1 mL) acetonitrile volume, and (75 mL) sample volume. The predicted overall BTEX recovery for these optimal values was 98.3198.
 |
| | Fig. 4 Contour plot resulting from CCD. | |
 |
| | Fig. 5 Response surface plot resulting from CCD. | |
3.3. Method validation
3.3.1. Calibration curves and linearity.
Six different aqueous calibration standard solutions of BTEX prepared in water of HPLC grade were analysed within the estimated linear range of each analyte. The slope and intercept of each obtained calibration curve were calculated using a linear regression method. Mathematical verification of linearity was performed in terms of correlation coefficient (R2). Also, ANOVA lack of fit using Fisher's t-test was applied. Table 7 summarises the curve equation, linear range and lack of fit test results. As shown, all correlation coefficients were above 0.99, and Fcalc value of each linear range was less than Fcrit (ANOVA with 95% confidence level), insuring linearity and goodness of fit.
Table 7 Linear range, coefficients, and lack of fit test results based on peak areaa
| Compound |
Range/μg L−1 |
Slope mean (b) |
Intercept mean (a) |
R
2 mean |
LOF Fcalc |
|
Calibration fitting: y = a + bx, Fcrit, 95% = 6.57, n = 3.
|
| Benzene |
0.3–1200 |
3.02 |
0.220 |
0.9958 |
3.02 |
| Toluene |
0.4–1500 |
2.68 |
0.180 |
0.9939 |
2.18 |
|
o-xylene |
0.4–1200 |
3.23 |
0.021 |
0.9964 |
1.77 |
| Ethylbenzene |
0.5–1000 |
2.57 |
0.110 |
0.9922 |
3.85 |
|
m- + p-xylene |
0.2–1500 |
5.71 |
0.080 |
0.9981 |
1.96 |
3.3.2. Specificity.
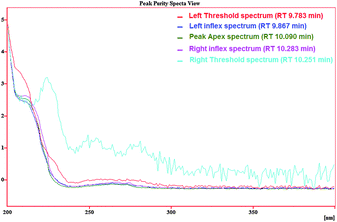
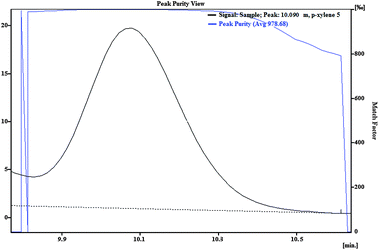
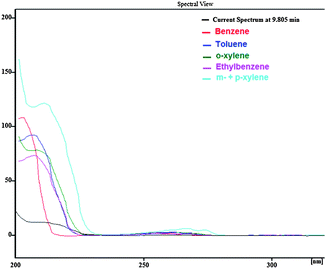
As Fig. 6 shows, the separation of blank river water spiked with gasoline at a concentration of 1.5 mg L−1 was carried out without significant interference of river water matrix. To demonstrate that the BTEX peaks were not overlapped with other interfering peaks, first, a spectral library was made based on the spectrum illustrated in Fig. 7 and the retention times were obtained from direct injection of BTEX standard solution in acetonitrile as the analysis carried out in section 3.1. Then, the test of peak purity for each peak in the spiked river water sample was done by a close examination of the spectral information. Fig. 8 and 9 illustrate peak purity spectral view and peak purity match factor respectively for peak no. 5 (m- + p-xylene peak) in the chromatogram of the river water spiked sample. Peak purity was investigated from Fig. 8 by noticing that both inflex and apex peak spectra did not exceed both threshold spectra.25Table 8 shows peak purity and library matching of river spiked sample.
 |
| | Fig. 6 Chromatogram of river spiked sample with gasoline at 1.5 mg L−1. | |
 |
| | Fig. 7 BTEX Spectral view used to build library, obtained from direct injection of BTEX standard solution in ACN at 150 μg L−1. | |
Table 8 Peak purity and best match values with library
| Compound |
Retention time/min |
Peak purity (‰) |
Best matcha(‰) |
|
Best match based on retention time and spectral information.
|
| Benzene |
4.497 |
994.73 |
973 |
| Toluene |
6.635 |
951.46 |
987 |
|
o-xylene |
9.089 |
985.35 |
964 |
| Ethylbenzene |
9.587 |
982.15 |
961 |
|
m- + p-xylene |
10.090 |
978.68 |
982 |
3.3.3. Limits of detection (LOD) and of quantitation (LOQ).
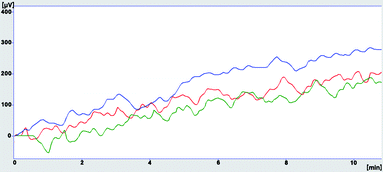
The calculated LOD and LOQ of each compound in the different blank samples are presented in Table 9 which shows that LOD and LOQ estimated for BTEX in the different examined matrices were under the established maximum contaminant level of each contaminant in water established by EPA and EU. Therefore, the method is sufficient to cover the drinking water standards range for all analytes. The investigation of the matrix effect was evaluated by determining the sample blank value and standard deviation of each blank water type. Both mentioned parameters are likely to be dependent on the sample matrix. The limit of detection and quantitation will therefore be matrix dependent. Sample blank values generated in both water of HPLC grade and tap water were close to each other, but the standard deviation acquired from the analysis of blank tap water samples was higher than its value of blank HPLC water grade samples (RSD of 3.5% and 2.8% respectively). A slight increase in baseline and its standard deviation were observed when the blank river water sample was analysed (RSD of 4.5%), clarifying the differences in LOD and LOQ presented in Table 9. Fig. 10 shows overlapped chromatograms obtained from the analysis of the three blank matrices.
Table 9 Limits of detection/quantitation of BTEX in different matrices
| Compound |
Water of HPLC |
Tap water |
River water |
| LOD/μg L−1 |
LOQ/μg L−1 |
LOD/μg L−1 |
LOQ/μg L−1 |
LOD/μg L−1 |
LOQ/μg L−1 |
| Benzene |
0.201 |
0.275 |
0.284 |
0.404 |
0.424 |
0.614 |
| Toluene |
0.332 |
0.409 |
0.419 |
0.545 |
0.565 |
0.766 |
|
o-xylene |
0.321 |
0.391 |
0.400 |
0.512 |
0.530 |
0.708 |
| Ethylbenzene |
0.423 |
0.512 |
0.523 |
0.667 |
0.690 |
0.918 |
|
m- + p-xylene |
0.182 |
0.219 |
0.235 |
0.301 |
0.311 |
0.417 |
3.3.4. Accuracy and precision.
Good results were obtained in terms of accuracy, repeatability and intermediate precision. Table 10 shows the results of method accuracy and precision. Recovery values were found to be between 94 and 106% which are well within the quality control criteria for most of the US EPA methods where acceptable limits for recovery are (80–120%). Repeatability and intermediate precision values were lower than 3% and 5% respectively at the highest concentration level, and lower than 5% and 7% at the lowest one. These results also meet the US EPA quality control criteria with a RSD of <20%. ANOVA showed that mean values were not significantly different (P more than 0.05) at 95% confidence level.
Table 10 Method performance analysis results
| Compound |
Concentration/μg L−1 |
Recoverya(%) |
Relative bias b(%) |
RepeatabilitycRSD (%) |
Intermediate Precisiond RSD (%) |
ANOVAeP |
|
n = 10.
n = 10.
n = 5.
n = 10.
Confidence interval = 95%.
|
| Benzene |
0.5 |
104.2 |
4.200 |
2.647 |
4.764 |
0.421 |
| 20 |
100.2 |
0.233 |
0.526 |
0.997 |
0.266 |
| 1000 |
97.7 |
2.294 |
1.664 |
2.080 |
0.172 |
| Toluene |
0.5 |
104.9 |
4.917 |
3.187 |
5.243 |
0.289 |
| 20 |
99.9 |
0.058 |
0.350 |
1.034 |
0.073 |
| 1000 |
101.9 |
1.999 |
1.199 |
0.623 |
0.095 |
|
o-xylene |
0.5 |
100.0 |
0.017 |
2.165 |
3.170 |
0.479 |
| 20 |
99.9 |
0.038 |
0.364 |
0.929 |
0.662 |
| 1000 |
102.9 |
2.971 |
0.943 |
1.688 |
0.184 |
| Ethylbenzene |
0.5 |
94.9 |
5.017 |
4.523 |
7.697 |
0.096 |
| 20 |
100.0 |
0.025 |
1.315 |
1.298 |
0.202 |
| 1000 |
105.9 |
5.885 |
2.949 |
3.907 |
0.088 |
|
m- + p-xylene |
0.5 |
100.5 |
0.483 |
1.954 |
4.011 |
0.551 |
| 20 |
101.1 |
1.052 |
0.325 |
0.976 |
0.373 |
| 1000 |
99.0 |
1.017 |
0.710 |
1.738 |
0.449 |
3.4. Performance of the proposed method
Various methods for the analysis of VOCs were reported by government bodies (US EPA, ASTM, AWWA, and WEF), and some new techniques were developed by researchers in the literature, the most recent are presented in Table 11.
Table 11 Comparison between the methods which used to analyse BTEX in aqueous media
| Method |
Technique |
Analysis |
Determination time/min |
Approx. recovery (%) |
Approx. RSD (%) |
Approx. LOD/μg L−1 |
Ref. |
|
SPME: Headspace solid phase microextraction.
DSDME: Directly suspended droplet microextraction.
HF-LPME: hollow-fiber liquid phase microextraction.
|
| EPA 502.2 |
Purge and trap |
GC-PID |
45 |
98–99 |
0.9–1.6 |
0.01–0.04 |
39
|
| EPA 5030-C + 8021-B |
Purge and trap |
GC-PID |
45 |
99–103 |
0.8–3.6 |
0.009–0.02 |
39
|
| EPA 524.2 |
Purge and trap |
GC-MS |
30 |
97–104 |
5.7–8.6 |
0.04–0.13 |
39
|
| EPA 524.3 |
Purge and trap |
GC-MS |
28 |
92–98 |
2.7–9.5 |
0.01–0.02 |
39
|
| Std. Method 6200-B |
Purge and trap |
GC-MS |
40 |
106–109 |
No data |
0.03–0.04 |
39
|
| ASTM D-5790 |
Purge and trap |
GC-MS |
35 |
94–107 |
No data |
0.11–0.48 |
39
|
| USGS O-4024-03 |
Purge and trap |
GC-MS |
40 |
71–97 |
4.7–15.5 |
0.007–0.04 |
39
|
| — |
Direct aqueous injection |
GC-FID |
15 |
No data |
No data |
0.61–1.11 |
31
|
| — |
Direct aqueous injection |
GC-MS |
10 |
No data |
10–13 |
11–76 |
36
|
| — |
Headspace |
GC-MS |
30 |
No data |
No data |
0.001–0.05 |
37
|
| — |
SPMEa |
GC-MS |
30 |
76–102 |
1.9–7.1 |
0.0001–0.01 |
37,38
|
| — |
SPMEa |
GC-FID |
15 |
No data |
2.6–8.5 |
0.02–0.11 |
4
|
| — |
DSDMEb |
GC-FID |
30 |
90–99 |
1.8–2.7 |
0.80–7.2 |
32
|
| — |
HF-LPMEc |
GC-FID |
35 |
89–92 |
2.0–4.6 |
4.8–30 |
20
|
| — |
Headspace |
AAS |
No data |
No data |
5.0–30 |
600–1500 |
33
|
| — |
SPME |
Raman |
No data |
No data |
3.2–9.0 |
1000–400 |
34
|
| — |
Fluorescence Polarisation |
Immunoassay |
No data |
No data |
3.4–5.7 |
220–11000 |
35
|
| Proposed method |
Purging to ACN |
HPLC-DAD |
30 |
94–105 |
1.1–7.7 |
0.24–0.69 |
|
Compared to other methods, the analysis of BTEX could be accomplished with reasonable runtime. Recovery obtained with the presented procedure was comparable with those reported by others, and precision was better than that for HS, SPME and some P&T techniques. Our method had lower detection limits than those based on DAI, DSDME and all other non GC methods, but its performance was not as good as the detection limits achieved by GC-MS and GC-PID techniques.
3.5. Analysis of environmental contaminated water samples
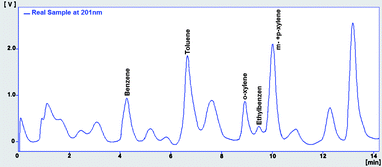
The validated procedure was applied to analyse samples suspected to be contaminated by petroleum products. Each sample was measured in triplicate using the adopted technique prior the HPLC-DAD analysis. Table 12 summarises the results obtained, and Fig. 11 shows a chromatogram of a water contaminated sample. All the identified peaks resulting in the chromatograms of the analysed environmental water samples had match factors values between 955 and 985‰, and peak purity values between 900 and 975, insuring good specificity of the analysis.
Table 12 BTEX analysis results of real contaminated samples
| Sample |
Benzene/μg L−1 |
Toluene/μg L−1 |
o-xylene/μg L−1 |
Ethylbenzene/μg L−1 |
m- + p-xylene/μg L−1 |
| Oil produced water (Al Jourzi - Deir Azzor) |
560 ± 4 |
1255 ± 9 |
623 ± 3 |
204 ± 5 |
1037 ± 6 |
| Surface water (near a petroleum well - Deir Azzor) |
9.72 ± 0.04 |
69.49 ± 0.09 |
18.91 ± 0.04 |
6.89 ± 0.08 |
48.34 ± 0.05 |
| Ground water (Barada well no. 13 - Barad valley) |
N/D |
0.42 ± 0.02 |
N/D |
N/D |
N/D |
| Ground water (Kadam well no. 9 - Damascus) |
N/D |
0.44 ± 0.02 |
N/D |
N/D |
0.24 ± 0.01 |
| Rinsing water (service station - Damascus) |
0.22 ± 0.02 |
0.67 ± 0.01 |
0.394 ± 0.008 |
N/D |
0.39 ± 0.01 |
4. Conclusions
To monitor BTEX in water samples, a simple quantitative analytical HPLC-DAD method, utilising low reagents quantity, has been developed and validated, allowing the determination of all analytes at low μg L−1 levels. By applying a chemometric approach based on the use of experimental design, the optimal sample preparation conditions corresponding to the highest BTEX recovery were calculated by central composite design module. These conditions were: 220 mL min−1 nitrogen flow rate, 20 min purge time, 1 mL acetonitrile volume, and 75 mL sample volume. We highlighted from our experiments that the presented procedure was a reliable and accurate method, and its validation showed very good linearity, trueness, precision as well as repeatability test. The analysis has been done using HPLC which is equipped with a diode array detector, and the separation showed good resolution without remarkable interference. With the optimum experimental settings, the method was successfully applied to analyse contaminated environmental water samples as well as laboratory spiked samples. Considering the high operational cost and availability of other techniques such as GC-MS, this HPLC method with photo diode array detection appears a good solution for BTEX environmental monitoring tasks, especially because it has a comparable performance with several conventional methods.
Notes and references
- M. Farhadian, D. Duchez, C. Vachelard and C. Larroche, Water Res., 2008, 42, 1325 CrossRef CAS.
- V. Reineke, J. Rullkötter, E. L. Smith and S. J. Rowland, Org. Geochem., 2006, 37, 1885 CrossRef CAS.
- H. R. Pohl, N. Roney, S. Hansen and C. T. De Rosa, Chemosphere, 2003, 53, 183 CrossRef CAS.
- I. Arambarri, M. Lasa, R. Garcia and E. Millán, J. Chromatogr., A, 2004, 1033, 193 CrossRef CAS.
- M. Rosell, S. Lacorte, A. Ginebreda and D. Barceló, J. Chromatogr., A, 2003, 995, 171 CrossRef CAS.
- R. C. Borden, D. C. Black and K. V. McBlief, Environ. Pollut., 2002, 118, 141 CrossRef CAS.
- A. Serrano and M. Gallego, J. Chromatogr., A, 2004, 1045, 181 CrossRef CAS.
-
mailto:http://www.epa.gov/safewater/consumer/mcl.pdf, 2004.
-
mailto:http://toxics.usgs.gov/definitions/btex.html, 2004.
- J. Glavany and N. Fontain, Directive 2000/60/EC of the European Parliament and of the Council of 23 October 2000, Off. J. Eur. Commun., 2002, L 327, 1–73 Search PubMed.
- A. Neyts-Uyttebroeck and N. Fontain, Decision 2455/2001/EC of the European Parliament and of the Council of 20 November 2001, Off. J. Eur. Commun., 2001, L 331, 1–5 Search PubMed.
- B. Prammer, Directive 98/83/EC of the Council of 3 November 1998, Off. J. Eur. Commun, 1998, L 330, 32–54 Search PubMed.
- J. H. Langwaldt and J. A. Puhakka, Environ. Pollut., 2000, 107, 187 CrossRef CAS.
- F. Bianchi, M. Careri, E. Marengo and M. Musci, J. Chromatogr., A, 2002, 975, 113 CrossRef CAS.
- E. Martínez, S. Lacorte, I. Llobet, P. Viana and D. Barceló, J. Chromatogr., A, 2002, 959, 181 CrossRef CAS.
- A. D. Nikolaou, S. K. Golfinopoulos, M. N. Kostopoulou, G. A. Kolokythas and T. D. Lekkas, Water Res., 2002, 36, 2883 CrossRef CAS.
- S. Lacorte, L. Olivella, M. Rosell, M. Figueras, A. Ginebreda and D. Barceló, Chromatographia, 2002, 56, 739 CAS.
- Z. Wang, K. Li, M. Fingas, L. Sigouin and L. Ménard, J. Chromatogr., A, 2002, 971, 173 CrossRef CAS.
- A. Alonso, M. A. Fernández-Torroba, M. T. Tena and B. Pons, Chromatographia, 2003, 57, 369 CAS.
- A. Sarafraz-Yazdi, A. H. Amiri and Z. Es'haghi, Chemosphere, 2008, 71, 671 CrossRef CAS.
- E. Baltussen, C. Cramers and P. Sandra, Anal. Bioanal. Chem., 2002, 373, 3 CrossRef CAS.
- S. Muller, M. Moder, S. Schrader and P. Popp, J. Chromatogr., A, 2003, 985, 99 CrossRef.
- G. Ouyang, W. Zhao and J. Pawliszyn, Anal. Chem., 2005, 77, 8122 CrossRef CAS.
-
N. Michael, Application Note, Thermo Electron Corporation, San Jose, CA USA, 2004 Search PubMed.
- M. E. Swartz and I. S. Krull, LCGC North America, 2005, 23, 586 CAS.
- J. Trygg and S. Wold, Homepage of Chemometrics, Editorials August 2002, http://www.acc.umu.se/~tnkjtg/Chemometrics/Editorial.
- T. Adžamić, K. Sertić-Bionda and Z. Zoretić, Nafta, 2009, 60, 485 Search PubMed.
- EURACHEM Guide, The Fitness for Purpose of Analytical Methods: A Laboratory Guide to Method Validation and Related Topics, ed. D. Holcombe, LGC Ltd, 1998, 1st English Edition 1.0, 75 Search PubMed.
- P. M. Young and M. V. Gorenstein, LC–GC, 1994, 12, 832 CAS.
- W. J. Warren, W. A. Stanick, M. V. Gorenstein and P. M. Young, BioTechniques, 1995, 18, 282 CAS.
- R. Kubinec, J. Adamuŝčcin, H. Jurdáková, M. Foltin, I. Ostrovsky, A. Kraus and L. Soják, J. Chromatogr., A, 2005, 1084, 90 CrossRef CAS.
- A. Sarafraz-Yazdi, A. H. Amiri and Z. Es'haghi, Talanta, 2009, 78, 936 CrossRef CAS.
- M. Farajzadeh and A. Mardani, Anal. Sci., 2001, 17, 1059 CAS.
- B. Wittkamp and D. Tilotta, Anal. Chem., 1995, 67, 600 CrossRef CAS.
- S. Eremin, D. Knopp, R. Niessner, J. Youn Hong, S. Park and M. Ja Choi, Environ. Chem., 2005, 2, 227 CrossRef CAS.
- S. Pyle and D. Gurka, Talanta, 1994, 41, 1845 CrossRef CAS.
- V. López-Grimau, J. M. Guadayol, J. A. Griera and M. C. Gutiérrez, Lat. Am. Appl. Res., 2006, 36, 49-55 Search PubMed.
- C. M. M. Almeida and L. V. Boas, J. Environ. Monit., 2004, 6, 80 RSC.
- National environmental methods index, http://www.nemi.gov/.
|
| This journal is © The Royal Society of Chemistry 2010 |
Click here to see how this site uses Cookies. View our privacy policy here. ![[thin space (1/6-em)]](https://www.rsc.org/images/entities/char_2009.gif) :
:![[thin space (1/6-em)]](https://www.rsc.org/images/entities/char_2009.gif) 4) in acetonitrile, and stored in an amber glass stoppered bottle (without headspace) at 4 °C. Fresh aqueous working standard solutions were prepared daily by diluting the primary dilution standard solution in water of HPLC grade.
4) in acetonitrile, and stored in an amber glass stoppered bottle (without headspace) at 4 °C. Fresh aqueous working standard solutions were prepared daily by diluting the primary dilution standard solution in water of HPLC grade.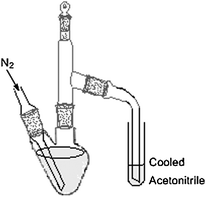
![[thin space (1/6-em)]](https://www.rsc.org/images/entities/char_2009.gif) :
:![[thin space (1/6-em)]](https://www.rsc.org/images/entities/char_2009.gif) water (50
water (50![[thin space (1/6-em)]](https://www.rsc.org/images/entities/char_2009.gif) :
:![[thin space (1/6-em)]](https://www.rsc.org/images/entities/char_2009.gif) 50) as the mobile phase. The separation was accomplished using the mentioned HPLC column at 30 °C for 12 min. The detection was carried out at 201 nm and 245 nm using a photo diode array detector with scanning from 200 to 350 nm.
50) as the mobile phase. The separation was accomplished using the mentioned HPLC column at 30 °C for 12 min. The detection was carried out at 201 nm and 245 nm using a photo diode array detector with scanning from 200 to 350 nm.![[thin space (1/6-em)]](https://www.rsc.org/images/entities/char_2009.gif) :
:![[thin space (1/6-em)]](https://www.rsc.org/images/entities/char_2009.gif) 1) were added to each sample at the time of collection to adjust the pH to below 2. All samples were maintained at 4 °C and analysed within 72 h of sampling.
1) were added to each sample at the time of collection to adjust the pH to below 2. All samples were maintained at 4 °C and analysed within 72 h of sampling.


