Combination of quantum dot fluorescence with enzyme chemiluminescence for multiplexed detection of lung cancer biomarkers
Huan
Li
a,
Zhijuan
Cao
a,
Yuhao
Zhang
b,
Choiwan
Lau
a and
Jianzhong
Lu
*a
aSchool of Pharmacy, Fudan University, 826 Zhangheng Road, Shanghai, 201203, China. E-mail: jzlu@shmu.edu.cn; Fax: +86 21-51980058
bZhongshan Hospital, Fudan University, 138 Yixueyuan Road, Shanghai, 200032, China
First published on 7th July 2010
Abstract
A new concept is proposed in this article to detect multiple cancer markers in a single sample. Quantum dot (QD) fluorescence (FL) labels were successfully combined with enzyme chemiluminescence (CL) labels for simultaneous detection of three cancer markers in human serum using just a common 96-well plate reader and with equal detection limits for the three markers. As a proof-of-concept, herein we coupled one QD FL label with two enzyme CL labels for hybrid multiplexed detection of lung cancer markers as exemplified by neuron-specific enolase (NSE), carcinoembryonic antigen (CEA) and cytokeratin fragment (Cyfra21-1). A homogeneous “sandwich-type” detection strategy was employed herein, where the bead–antibody mixture first reacts with NSE, CEA and Cyfra21-1 to initiate three immunoreactions in a single tube; and then the formed conjugates sandwiches with biotin, digoxin and fluoresceinisothiocyanate (FITC)-modified detection antibodies, and further reacts with a mixture of streptavidin QD, anti-FITC horseradish peroxidase (HRP) and anti-digoxin alkaline phosphatase (ALP) for subsequent CL and FL detection. The results show that NSE, CEA and Cyfra21-1 could be sensitively determined with a common 96-well plate reader and with equal detection limits down to the ng mL−1 level. Furthermore, the proposed method has been successfully applied to the determination of three cancer markers in human samples without cross-reaction. Because it is straightforward to adapt this strategy to detect a spectrum of other proteins by using different antibodies or aptamers, this new CL strategy might create a universal technology for developing simple biosensors in the sensitive and selective detection of multiple targets in a variety of clinical, environmental, and biodefense applications.
Introduction
Recently, multiplex measurement of tumor markers in biological samples has shown promise in the early detection of cancer, differentiating benign from malignant conditions, evaluating the extent of disease, monitoring the response of tumors to therapy, and predicting recurrence. In principle, multianalyte configurations require either the use of a single reporter along with spatial separation of the assays or the successful combination of several labels in a single assay. To sum up, two encoding strategies are generally used in the multianalyte screening methods: (1) positional encoding, in which every potential reaction is preassigned a particular position on a solid-phase support such as a microarray; (2) reaction encoding, where every possible reaction is uniquely tagged with a code that is most often optical or electrochemical based which is best suited for applications requiring ultra-high-density analysis. Reaction encoding has a number of advantages compared to flat surface arrays, regarding, for instance, solution kinetics, ease of assay modification, higher sample throughput, and better quality control by batch synthesis. Detection methods suitable for reaction encoding include fluorescence techniques,1–3 Raman spectroscopy,4,5 electrochemistry,6,7 and laser ablation inductively coupled plasma mass spectrometry (ICPMS),8,9 in which spectral multiplexing (multicolor signaling) is the most common multiplexing method. However, spectral multiplexing with organic dyes is mostly limited to the discrimination of two biomarkers due to their comparatively broad emission bands of slightly structured shape and the narrow wavelength region of optimal excitation of each dye. Semiconductor quantum dots (QDs) have emerged as a promising alternative to organic dyes as fluorescent labels for biological detection and imaging.10–12 QDs have broad, overlapping absorption spectra and very narrow emission spectra, essentially any emission wavelength covering the whole visible region can be obtained with high quantum yield under the same excitation light, depending on the QD composition and size.13,14 Recently, simultaneous detection of four toxins from a single sample probed with a mixture of all four QD-antibody reagents was demonstrated by using a deconvolution scheme.15,16In addition, chemiluminescence (CL) has been exploited for a wide range of applications in various fields owing to its extremely high sensitivity along with its other advantages, such as simple instrumentation, wide calibration ranges and suitability for miniaturization in analytical chemistry. CL methods have been generally employed in the CL flat surface arrays. For example, spatial separation along with a single label was employed in a multianalyte hybridization assay for detection of various pathogens by constructing microtiter plates containing main wells with built-in subwells, each subwell corresponding to a single assay;17 A substrate zone resolved multianalyte immunoassay has been developed for the detection of CA125, CA 153, CA 199 and carcinoembryonic antigen (CEA) by employing horseradish peroxidase (HRP) and alkaline phosphatase (ALP) as labels, respectively.18,19 Recently, a few reaction encoding-based CL methods have also been developed in several groups. A temperature-resolved technique has been proposed in a homogeneous CL immunoassay system by using HRP to label the tracer antibody for the sequential CL detection of two proteins.20 Four kinds of CL labels, i.e. HRP, ALP, aequorin and galactosidase, have also been simultaneously determined for the quadruple-analyte CL hybridization assay.21
It is presumed that the CL labels hyphenated with FL labels could increase significantly the number of targets which can be simultaneously determined. Most importantly, there are many instruments to be designed for CL and FL simultaneous detection, high-performance optical system enables the machine with high detection sensitivity and as a combination instrument, it also covers the full range of FL as well as glow-type and flash-type CL applications. As a proof-of-concept, herein we developed an enzyme CL hyphenated with QD FL technology for hybrid multiplex detection of three tumor markers exemplified by neuron-specific enolase (NSE), CEA and cytokeratin fragment (Cyfra21-1). The optimization and attractive performance characteristics of this new hyphenated CL and FL detection of three model proteins are reported in the following sections. It was found that this new technique was competitive with or even better than previously reported single-analyte or multianalyte detection systems employing other technologies.
Experimental
Apparatus
FL and CL measurement were carried out using a PC-controlled Fluoroskan Ascent FL (Thermo Electron Corporation). Absorbance was determined by a HITACHI U-2900 Spectrophotometer.Reagents
All chemicals were of analytical reagent grade and were used as received. Water was purified using a Millipore Milli-XQ system (Bedford, MA). 1-ethyl-3-(3′-dimethylaminopropyl) carbodiimide (EDC) were purchased from Sigma. Carboxylated polystyrene beads (PS, 0.994 μm, 26 mg mL−1) were purchased from Polysciences, Inc. CEA and NSE monoclonal coating and labeling antibodies were bought from Shanghai Line-Bio Science Co. China. Cyfra21-1(keratin K19) monoclonal coating and detection antibodies and recombinant antigen was bought from Progen Biotechnik GmbH. Digoxin were bought from National Institute for the Control of Pharmaceutical and Biological Products, China. CEA antigen, NSE antigen, fluoresceinisothiocyanate (FITC) and monoclonal anti-digoxin alkaline phosphatase conjugate (anti-digoxin ALP) was bought from Sigma. Anti-FITC horseradish peroxidase (anti-FITC HRP) was bought from Molecular Probes. Streptavidin quantum dot (SA-QD, 605 nm) was bought from Wuhan Jiayuan Quantum Dot Co., China.Antibody immobilization on the PS beads
Typically, PS beads were first transferred into a 1.5 mL centrifuge tube, washed three times with 100 μL of 0.1 M imidazole buffer (pH 6.0) and then activated with 1 mg EDC for 30 min at 37 °C. After activation, the beads were separated at 12![[thin space (1/6-em)]](https://www.rsc.org/images/entities/char_2009.gif) 000 rpm, the supernatant was discarded, and the resultant beads were re-suspended in 100 μL of 0.1 M imidazole buffer (pH 6.0). This washing process was repeated four times, and then NSE, CEA or Cyfra21-1 coating antibody was added and reacted for 1 h at 37 °C. Bead–antibody conjugates were washed with 200 μL of phosphate buffered saline-Tween 20 (PBSTW), and then blocked with 200 μL of 50% fetal bovine serum and 2% bovine serum albumin (BSA) phosphate buffered saline (PBS) at 37 °C for 1 h. Blocked beads were washed with 200 μL of PBSTW and then re-suspended in 50 μL of PBS containing 2% BSA before use.
000 rpm, the supernatant was discarded, and the resultant beads were re-suspended in 100 μL of 0.1 M imidazole buffer (pH 6.0). This washing process was repeated four times, and then NSE, CEA or Cyfra21-1 coating antibody was added and reacted for 1 h at 37 °C. Bead–antibody conjugates were washed with 200 μL of phosphate buffered saline-Tween 20 (PBSTW), and then blocked with 200 μL of 50% fetal bovine serum and 2% bovine serum albumin (BSA) phosphate buffered saline (PBS) at 37 °C for 1 h. Blocked beads were washed with 200 μL of PBSTW and then re-suspended in 50 μL of PBS containing 2% BSA before use.
Preparation of the dioxime active ester
Dioxime active ester was synthesized as described previously with slight modification.22 Briefly, the periodate solution (31 mg in 0.4 mL of distilled water) was slowly added into the digoxin (50 mg) in 1 mL of chloroform–methanol (2![[thin space (1/6-em)]](https://www.rsc.org/images/entities/char_2009.gif) :
:![[thin space (1/6-em)]](https://www.rsc.org/images/entities/char_2009.gif) 1), while the reaction mixture was stirred under nitrogen. The reaction was complete in 15 min after the addition of periodate. The resultant mixture was then evaporated to dryness and the residue dissolved in chloroform and water (10
1), while the reaction mixture was stirred under nitrogen. The reaction was complete in 15 min after the addition of periodate. The resultant mixture was then evaporated to dryness and the residue dissolved in chloroform and water (10![[thin space (1/6-em)]](https://www.rsc.org/images/entities/char_2009.gif) :
:![[thin space (1/6-em)]](https://www.rsc.org/images/entities/char_2009.gif) 1). The cloudy solution was separated into aqueous and organic layers and the aqueous layer was washed three times with chloroform. The organic phases were combined and dried over magnesium sulfate, and the organic solvents were then evaporated to dryness. An oily digoxin dialdehyde was left and was used immediately in the next reaction.
1). The cloudy solution was separated into aqueous and organic layers and the aqueous layer was washed three times with chloroform. The organic phases were combined and dried over magnesium sulfate, and the organic solvents were then evaporated to dryness. An oily digoxin dialdehyde was left and was used immediately in the next reaction.
Carboxymethoxylamine hemihydrochloride (31 mg) and sodium acetate (23 mg) were dissolved in 0.3 mL of water and placed into a two-necked flask. The digoxin dialdehyde, dissolved in 200 μL of methanol, was placed into a pressure-equalized funnel and slowly added to the flask while the reaction mixture was stirred under nitrogen. The reaction was complete within 10 min. The reaction mixture was evaporated to dryness and the residue dissolved in 2 mL of ethyl acetate and 300 μL of water. The organic layer was separated and the aqueous layer was washed three times with ethyl acetate. The organic layers were combined and dried over anhydrous magnesium sulfate. The resultant solution was filtered and evaporated to dryness. The residue, digoxin (bis[O-(carboxymethyl)oxime], was further dried for 30 min under high vacuum (0.1 mmHg) and used immediately for the next step.
Dicyclohexylcarbodiimide (DCC, 28 mg) was dissolved in 600 μL of dry dimethylformamide (DMF) and placed into a two-necked flask. The solution was cooled in an ice bath (4 °C). Digoxin (bis[O-(carboxymethyl)oxime], dissolved in 8 mL of DMF, was slowly added while the reaction mixture was stirred under nitrogen. Then N-hydroxysuccinimide (NHS) solution (15 mg in 600 μL of DMF) was added. The reaction continued at 4 °C under nitrogen for 18 h. The white solid precipitate in the mixture was removed by filtration. The filtrate was then evaporated on a rotary evaporator under vacuum (0.1 mmHg). An oil, dioxime active ester (60 mg), was left and stored in a desiccator before use.
Preparation of digoxin-modified CEA detection antibody
The above-synthesized dioxime active ester (1 mg) was dissolved in 100 μL of DMF. Dioxime active ester DMF solution (20 μL) was mixed with 100 μL of CEA detection antibody in PBS solution at 4 °C for 2.5 h. The reaction solution was then dialyzed overnight against PBS for 12 h. The final concentration of digoxin-modified CEA detection antibody was determined by UV as 2.4 mg mL−1.Preparation of FITC-modified Cyfra21-1 detection antibody
Cyfra21-1 detection antibody (150 μL) was concentrated in 90 μL sodium carbonate solution (pH 9.2, 0.1 M) using a 50000 NMWL MICROCON Centrifugal Filter device, and then 10 μL FITC in 0.1 M sodium carbonate solution (1 mg mL−1) was added. The reaction solution was then dialyzed overnight against sodium carbonate solution and then against PBS for another 12 h. The resultant FITC-modified Cyfra21-1 detection antibody was concentrated in 150 μL PBS and then stored at 4 °C before use. The final concentration of FITC Cyfra21-1 detection antibody was determined by UV as 3.45 mg mL−1.FL and CL detection procedure
50 μl of each bead–antibody conjugate were mixed and then washed with 200 μL PBSTW by centrifugation at 12![[thin space (1/6-em)]](https://www.rsc.org/images/entities/char_2009.gif) 000 rpm. The supernatant was discarded and 100 μL of calibration solution containing CEA, NSE and Cyfra21-1 or human blood serum was added to the resultant bead–antibody conjugates in a 96-well plate filter. The mixture was incubated with continuous shaking at 37 °C for 1 h and then filter-washed with 200 μL PBSTW. One-hundred microlitres each of biotin-modified NSE detection antibody, digoxin-modified CEA detection antibody and FITC-modified Cyfra 21-1 detection antibody were added for another 1 h at 37 °C. The resultant conjugates were filter-washed with 200 μL PBSTW and then 100 μL each of anti-digoxin ALP, anti-FITC HRP and SA-QD were added and reacted for another 1 h at 37 °C. After washing three times with 200 μL PBSTW, the resultant beads were divided into three parts. One part was then directly detected with 100 μL HRP CL substrate for the determination of Cyfra 21-1, one part was detected with 50-μL ALP CL substrate for the analysis of CEA, and for the third part the FL signal was read directly for obtaining NSE concentration.
000 rpm. The supernatant was discarded and 100 μL of calibration solution containing CEA, NSE and Cyfra21-1 or human blood serum was added to the resultant bead–antibody conjugates in a 96-well plate filter. The mixture was incubated with continuous shaking at 37 °C for 1 h and then filter-washed with 200 μL PBSTW. One-hundred microlitres each of biotin-modified NSE detection antibody, digoxin-modified CEA detection antibody and FITC-modified Cyfra 21-1 detection antibody were added for another 1 h at 37 °C. The resultant conjugates were filter-washed with 200 μL PBSTW and then 100 μL each of anti-digoxin ALP, anti-FITC HRP and SA-QD were added and reacted for another 1 h at 37 °C. After washing three times with 200 μL PBSTW, the resultant beads were divided into three parts. One part was then directly detected with 100 μL HRP CL substrate for the determination of Cyfra 21-1, one part was detected with 50-μL ALP CL substrate for the analysis of CEA, and for the third part the FL signal was read directly for obtaining NSE concentration.
Results and discussion
This article reports on a proof-of-concept development of a QD FL hyphenated enzyme CL technology for hybrid multiplex detection of three lung cancer biomarkers, which were in this case NSE, CEA and Cyfra21-1 (Scheme 1).23 This involved the following four steps: (1) bead–antibody conjugates were reacted with NSE, CEA and Cyfra21-1 standard or human serum for 1 h; (2) they were then sandwiched with biotin, digoxin and fluoresceinisothiocyanate (FITC)-modified detection antibodies for another 1 h; (3) and then further reacted with self-assembled streptavidin (SA)-QDs, anti-digoxin ALP and anti-FITC HRP signaling molecules for 1 h; and (4) FL and CL signals on the bead surface were sequentially read out by a common 96-well plate reader.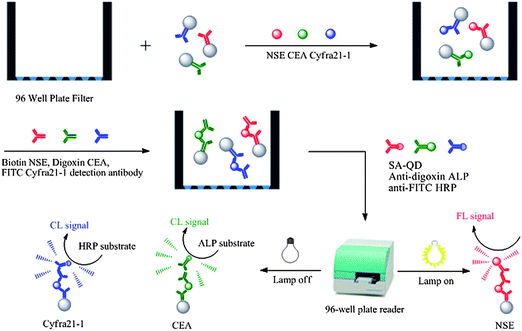 | ||
| Scheme 1 Schematic representation of quantum dot fluorescence labels hyphenated with enzyme chemiluminescence for multiplex detection of lung cancer markers. | ||
The ALP signal was observed to decrease considerably when measured after HRP. This was attributed to ALP inactivation due to exposure of the dimethyl sulfoxide (DMSO) solution of the HRP substrate. A washing step was introduced after each measurement to remove the substrate and possible signal carryover before proceeding to the next step. However, for simplicity, here we divided the resultant sample into three equal parts after the last wash. Each part was then used for direct measurement of one specific label after adding the corresponding substrate. It should be noted that this simple and quick detection procedure decreased the sensitivity three fold but avoided the in-between washing steps and shortened the detection time by more than 30 min.
Optimization of reaction parameters
Several experimental parameters were investigated systematically including the amounts of the three coating antibodies, the three bead–antibody conjugates, the three detection antibodies, and also SA-QD, anti-FITC HRP and anti-digoxin ALP signaling molecules. To assess the optimal coverage for detection, a series of experiments was conducted with varying amounts of each coating antibody. As the amount of each coating antibody increased, FL or CL intensity initially increased and then almost levelled off (Fig. 1), which possibly occurred due to saturation of the binding sites on the polystyrene (PS) beads. As shown in Fig. 1, the optimum coating of antibody was found to be 2.4 μg for NSE, 3.2 μg for CEA, and 0.48 μg for Cyfra21-1. The estimated antibody density on the surface of PS beads was calculated to be 0.031 μg NSE coating antibody μg−1 PS beads, 0.041 μg CEA coating antibody μg−1 PS beads, and 0.0062 μg Cyfra21-1 coating antibody μg−1 PS beads.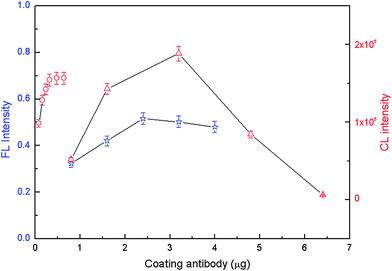 | ||
Fig. 1 FL and CL intensity versus the amount of coating antibody. Experimental conditions: NSE (☆, left Y-axis), CEA (△, right Y-axis), or Cyfra21-1 (○, right Y-axis), 78 μg PS beads was used; antigens were 10 ng mL−1; biotin-modified NSE detection antibody was 2.8 μg well−1, digoxin-modified CEA detection antibody was 1.2 μg well−1 and FITC-modified Cyfra21-1 detection antibody was 3.45 μg well−1; SA-QD was 1![[thin space (1/6-em)]](https://www.rsc.org/images/entities/char_2009.gif) : :![[thin space (1/6-em)]](https://www.rsc.org/images/entities/char_2009.gif) 500, anti-FITC HRP was 1 500, anti-FITC HRP was 1![[thin space (1/6-em)]](https://www.rsc.org/images/entities/char_2009.gif) : :![[thin space (1/6-em)]](https://www.rsc.org/images/entities/char_2009.gif) 1000 and anti-digoxin ALP was also 1 1000 and anti-digoxin ALP was also 1![[thin space (1/6-em)]](https://www.rsc.org/images/entities/char_2009.gif) : :![[thin space (1/6-em)]](https://www.rsc.org/images/entities/char_2009.gif) 1000. The detection procedure was carried out as described in the Experimental Section. 1000. The detection procedure was carried out as described in the Experimental Section. | ||
The amount of the bead–antibody conjugates was then optimized to give the highest FL or CL intensity (Fig. 2). Higher FL or CL intensity was achieved with 107 μg NSE bead–antibody conjugates, 80 μg CEA bead–antibody conjugates, and 187 μg Cyfra21-1 bead–antibody conjugates. These amounts were then selected for further studies. The amount of the detection antibody was also optimized for FL or CL intensity (Fig. 3), and consequently subsequent work employed 2.8 μg well−1 of biotin-modified NSE detection antibody, 1.2 μg well−1 of digoxin-modified CEA detection antibody, and 3.45 μg well−1 of FITC-modified Cyfra21-1 detection antibody. Next the amounts of SA-QDs, anti-digoxin ALP and anti-FITC HRP were optimized for FL or CL intensity. Optimum amounts were found to be 1![[thin space (1/6-em)]](https://www.rsc.org/images/entities/char_2009.gif) :
:![[thin space (1/6-em)]](https://www.rsc.org/images/entities/char_2009.gif) 200 for SA-QD, 1
200 for SA-QD, 1![[thin space (1/6-em)]](https://www.rsc.org/images/entities/char_2009.gif) :
:![[thin space (1/6-em)]](https://www.rsc.org/images/entities/char_2009.gif) 500 for anti-digoxin ALP and 1
500 for anti-digoxin ALP and 1![[thin space (1/6-em)]](https://www.rsc.org/images/entities/char_2009.gif) :
:![[thin space (1/6-em)]](https://www.rsc.org/images/entities/char_2009.gif) 1000 for anti-FITC HRP (Fig. 4).
1000 for anti-FITC HRP (Fig. 4).
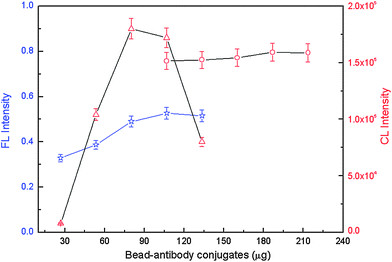 | ||
Fig. 2 FL and CL intensity versus the amount of bead–antibody conjugates. Experimental conditions: NSE (☆, left Y-axis), CEA (△, right Y-axis), or Cyfra21-1 (○, right Y-axis), 0.031 μg NSE coating antibody μg−1 PS beads, 0.041 μg CEA coating antibody μg−1 PS beads, and 0.0062 μg Cyfra21-1 coating antibody μg−1 PS beads were used. Antigens were 10 ng mL−1; biotin-modified NSE detection antibody was 2.8 μg well−1, digoxin-modified CEA detection antibody was 1.2 μg well−1 and FITC-modified Cyfra21-1 detection antibody was 3.45 μg well−1; SA-QD was 1![[thin space (1/6-em)]](https://www.rsc.org/images/entities/char_2009.gif) : :![[thin space (1/6-em)]](https://www.rsc.org/images/entities/char_2009.gif) 500, anti-digoxin ALP was 1 500, anti-digoxin ALP was 1![[thin space (1/6-em)]](https://www.rsc.org/images/entities/char_2009.gif) : :![[thin space (1/6-em)]](https://www.rsc.org/images/entities/char_2009.gif) 1000 and anti-FITC HRP was 1 1000 and anti-FITC HRP was 1![[thin space (1/6-em)]](https://www.rsc.org/images/entities/char_2009.gif) : :![[thin space (1/6-em)]](https://www.rsc.org/images/entities/char_2009.gif) 1000. The detection procedure was carried out as described in the Experimental section. 1000. The detection procedure was carried out as described in the Experimental section. | ||
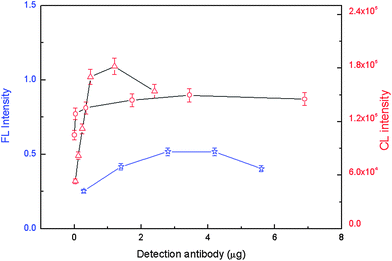 | ||
Fig. 3 FL or CL intensity versus the amount of detection antibody. Experimental conditions: NSE (☆, left Y-axis), CEA (△, right Y-axis), or Cyfra21-1 (○, right Y-axis), 2.4 μg NSE coating antibody, 3.2 μg CEA coating antibody and 0.48 μg Cyfra21-1 coating antibody. 107 μg bead–NSE coating antibody conjugates, 80 μg bead–CEA coating antibody conjugates, 187 μg bead–Cyfra21-1 coating antibody conjugates; antigens were 10 ng mL−1; SA-QD was 1![[thin space (1/6-em)]](https://www.rsc.org/images/entities/char_2009.gif) : :![[thin space (1/6-em)]](https://www.rsc.org/images/entities/char_2009.gif) 500, anti-digoxin ALP was 1 500, anti-digoxin ALP was 1![[thin space (1/6-em)]](https://www.rsc.org/images/entities/char_2009.gif) : :![[thin space (1/6-em)]](https://www.rsc.org/images/entities/char_2009.gif) 1000 and anti-FITC HRP was 1 1000 and anti-FITC HRP was 1![[thin space (1/6-em)]](https://www.rsc.org/images/entities/char_2009.gif) : :![[thin space (1/6-em)]](https://www.rsc.org/images/entities/char_2009.gif) 1000. The detection procedure was carried out as described in the Experimental section. 1000. The detection procedure was carried out as described in the Experimental section. | ||
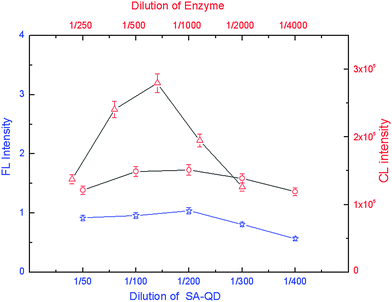 | ||
| Fig. 4 FL and CL intensity versus the amount of signaling molecules. Experimental conditions: NSE (☆, bottom X-axis, left Y-axis), CEA (△, top X-axis, right Y-axis), or Cyfra21-1 (○, top X-axis, right Y-axis), 2.4 μg NSE coating antibody, 3.2 μg CEA coating antibody and 0.48 μg Cyfra21-1 coating antibody. 107 μg bead–NSE coating antibody conjugates, 80 μg bead–CEA coating antibody conjugates, 187 μg bead–Cyfra21-1 coating antibody conjugates; antigens were 10 ng mL−1; biotin-modified NSE detection antibody at 2.8 μg well−1, digoxin-modified CEA detection antibody at 1.2 μg well−1, FITC-modified Cyfra21-1 detection antibody at 3.45 μg well−1; The detection procedure was carried out as described in the Experimental section. | ||
Assay performance
To evaluate the specificity of the antibody and method, we performed cross-reaction studies. These determined whether each coating antibody and detection antibody reacted with the other two antigens in addition to their corresponding antigen. A solution of each antigen at 50 ng mL−1 was analyzed by the FL or CL assay in the absence and in the presence of the other two antigens. Each antigen produced a high signal only when combined with the respective antibody and no cross-reaction signal occurred with the other two antigens (Fig. 5). FL or CL intensities for mixtures of the three antigens (Fig. 5D) as well as individual antigens (Fig. 5A–C) were practically the same, and confirmed that there was no obvious cross-reaction among these three antibody–antigen reactions. Thus, this hyphenated technology can be used for the simultaneous determination of the three lung cancer markers NSE, CEA, and Cyfra21-1 in a single sample.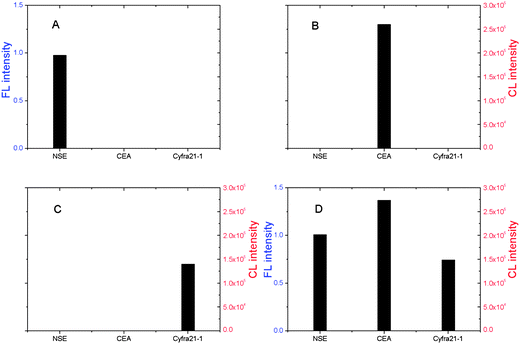 | ||
Fig. 5 Study of the specificity of QD FL labels hyphenated with enzyme CL for the detection of three tumor markers. Experimental conditions: 107 μg bead–NSE coating antibody conjugates, 80 μg bead–CEA coating antibody conjugates, 187 μg bead–Cyfra21-1 coating antibody conjugates; biotin-modified NSE detection antibody at 2.8 μg well−1, digoxin-modified CEA detection antibody at 1.2 μg well−1, FITC-modified Cyfra21-1 detection antibody at 3.45 μg well−1; and SA-QDs at 1![[thin space (1/6-em)]](https://www.rsc.org/images/entities/char_2009.gif) : :![[thin space (1/6-em)]](https://www.rsc.org/images/entities/char_2009.gif) 200, anti-digoxin ALP at 1 200, anti-digoxin ALP at 1![[thin space (1/6-em)]](https://www.rsc.org/images/entities/char_2009.gif) : :![[thin space (1/6-em)]](https://www.rsc.org/images/entities/char_2009.gif) 500, anti-FITC HRP at 1 500, anti-FITC HRP at 1![[thin space (1/6-em)]](https://www.rsc.org/images/entities/char_2009.gif) : :![[thin space (1/6-em)]](https://www.rsc.org/images/entities/char_2009.gif) 1000. Each antigen was at 50 ng ml−1. The detection procedure was carried out as described in the Experimental section. 1000. Each antigen was at 50 ng ml−1. The detection procedure was carried out as described in the Experimental section. | ||
The three antigen mixtures were analyzed in a quantitative fashion to determine the FL or CL response to increasing levels of the three tumor markers in a sample (Fig. 6). CL and FL intensities were proportional to the amount of the corresponding antigen. The calibration graphs in the concentration range of 0.5–50 ng mL−1 showed good linear correlations between the intensity and the concentration of NSE (y = 0.0204x − 0.0231 R2 = 0.9984), CEA (y = 3768x + 11657 R2 = 0.9844), and Cyfra21-1 (y = 2944x + 434, R2 = 0.9987). Our novel hyphenated technique allowed detection of three lung cancer markers down to the ng mL−1 level and was competitive with or even better than other assay formats (Table 1). The recoveries of NSE (10, 25 and 50 ng mL−1) in the presence of 50 ng mL−1 CEA and Cyfra21-1 were 89.8, 104.2 and 110.1%, respectively. Recoveries of CEA (10, 25 and 50 ng mL−1) in the presence of 50 ng mL−1 NSE and Cyfra21-1 were 98.4, 95.6 and 107.7%, respectively. Recoveries of Cyfra21-1 (10, 25 and 50 ng mL−1) with 50 ng mL−1 NSE and CEA were 101, 88.1 and 97.6%, respectively.
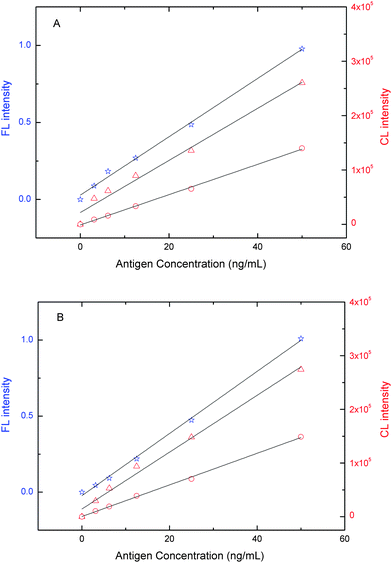 | ||
Fig. 6 FL and CL intensity versus the concentration of tumor marker. (A) A mixture of NSE (☆, left Y-axis), CEA (△, right Y-axis), or Cyfra21-1 (○, right Y-axis), and (B) individual markers. Experimental conditions: 107 μg bead–NSE coating antibody conjugates, 80 μg bead–CEA coating antibody conjugates, 187 μg bead–Cyfra21-1 coating antibody conjugates; biotin-modified NSE detection antibody at 2.8 μg well−1, digoxin-modified CEA detection antibody at 1.2 μg well−1, FITC-modified Cyfra21-1 detection antibody at 3.45 μg well−1; and SA-QD at 1![[thin space (1/6-em)]](https://www.rsc.org/images/entities/char_2009.gif) : :![[thin space (1/6-em)]](https://www.rsc.org/images/entities/char_2009.gif) 200, anti-digoxin ALP at 1 200, anti-digoxin ALP at 1![[thin space (1/6-em)]](https://www.rsc.org/images/entities/char_2009.gif) : :![[thin space (1/6-em)]](https://www.rsc.org/images/entities/char_2009.gif) 500, anti-FITC HRP at 1 500, anti-FITC HRP at 1![[thin space (1/6-em)]](https://www.rsc.org/images/entities/char_2009.gif) : :![[thin space (1/6-em)]](https://www.rsc.org/images/entities/char_2009.gif) 1000. The detection procedure was carried out as described in the Experimental section. 1000. The detection procedure was carried out as described in the Experimental section. | ||
| Label | Number of analytes | Detection method | Sensitivity | Ref. |
|---|---|---|---|---|
| HRP and ALP | 2 | CL | 1 ng mL−1 and 5 U mL−1 | 18 |
| HRP and ALP | 4 | CL | 0.5, 2, 5, U mL−1 1 ng mL−1 | 19 |
| HRP | 2 | CL | 2,1.5 ng mL−1 | 20 |
| ALP | 4 | CL | 0.52 and 0.55 ng mL−1, 0.49 and 0.79 U mL−1 | 25 |
| HRP | 10 | CL | 0.12–32 ng mL−1 | 26 |
| HRP | 3 | CL | 5 ng mL−1, 105 cfu mL−1, 107 pfu mL−1 | 27 |
| Cy5 | 3 | FL | 0.13 μg mL−1 | 28 |
| Cy5 | 3 | FL | 105 cfu mL−1, 107 pfu mL−1, 10 ng mL−1 | 29 |
| QD | 2 | FL | — | 30 |
| QD | 4 | FL | — | 14 |
| QD | 4 | FL | — | 15 |
| CdS | 4 | Electrochemical | 10 ng mL−1 | 31 |
| ALP | 4 | Electrochemical | 1, 2, 1.2 and 1 ng mL−1 | 32 |
| AuNP | 2 | Electrochemical | 1 and 1.5 ng mL−1 | 33 |
| ALP | 4 | Electrochemical | 3 ng mL−1 | 34 |
| Label-free | 4 | Electrochemical | 0.5 ng mL−1 | 35 |
| AuNPs | 2 | SPR | 30 ng mL−1 | 36 |
| HRP | 2 | Colorimetric | 0.02 ng mL−1. | 37 |
| Eu3+, Sm3+ | 2 | ICPMS | 1.2 and 1.7 ng mL−1 | 8 |
| Label-free | 4 | Piezoelectric sensor | 4, 2, 3 and 12 ng mL−1 | 38 |
| HRP | 1 | EIA | 1 ng mL−1 | CanAg kit 420-10 |
| HRP | 1 | EIA | 0.25 ng mL−1 | CanAg kit 401-10 |
| ALP, HRP and QD | 3 | FL/CL | 0.2 ng mL−1 | This work |
In addition to being very reproducible, we have also shown that our system is rapid. Even with 15 min incubations for each step, the total reaction time was within 1 h and the detection limit was almost unchanged. Consequently, our system should be at least as fast as current and commercially available assay formats.
We also challenged our method with 24 human serum samples from normal individuals. With an increase in human serum, the FL intensity decreased,24 which was attributed to interference from the human serum (Fig. 7). Thus 50% normal human serum was always included in the antigen-antibody reaction buffer for serum detection. The average recoveries for 20, 40 and 80 ng mL−1 from 24 normal serum samples were 93.0, 88.7 and 97.1% for NSE, respectively. For CEA the corresponding recoveries were 107.1, 116.4 and 96.2%, and 95.0, 93.9 and 90.8% for Cyfra21-1. Assays on serum from normal individuals clearly indicated that this method would be suitable for routine assay of clinical samples.
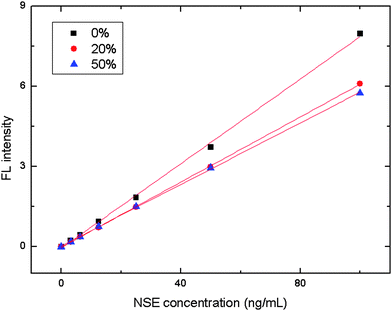 | ||
Fig. 7 FL intensity versus the amount of signaling molecules. Experimental conditions: 2.4 μg NSE coating antibody, 107 μg bead–NSE coating antibody conjugates; biotin-modified NSE detection antibody at 2.8 μg well−1; SA-QD was 1![[thin space (1/6-em)]](https://www.rsc.org/images/entities/char_2009.gif) : :![[thin space (1/6-em)]](https://www.rsc.org/images/entities/char_2009.gif) 200. The detection procedure was carried out as described in the Experimental section. 200. The detection procedure was carried out as described in the Experimental section. | ||
Conclusions
QD with a common 96-well plate reader plus equal detection limits down to the ng mL−1 level, indicating that this novel technique is applicable for cancer marker detection in human serum. As such it requires simple instrumentation and is suitable for miniaturization in analytical chemistry. Second, PS beads as special bimolecular immobilizing carriers can enable homogeneous performance of assays and also provide a means to concentrate the signal-generating samples. This is in contrast to single-label based planar microarrays. Furthermore, there is no cross reaction within the simultaneous detection of the above-mentioned QD and two enzymes. It could also be possible to increase the number of biomarkers in greater multiplexing, which could utilize different optical properties of QDs and employ other CL labels. For example, by employing four different QDs and four different CL labels, it can be simultaneously determine eight proteins together with a common 96-well plate reader. The technique proposed here is universal since the same method can be used for multianalyte quantification of any sample. This technique may have value in a variety of clinical, environmental, and biodefense applications for which the accurate quantitative analysis of multiple targets is desired.Acknowledgements
We acknowledge financial support from National 863 Program (2007AA03Z357), National Natural Science Foundation of China (20975026), Shanghai Key Basic Research Program (08JC1402600) and the Research Fund for the Doctoral Program of Higher Education (200802461096, 20090071110056).Notes and references
- S. R. Nicewarner-Pena, R. G. Freeman, B. D. Reiss, L. He, D. J. Pena, I. D. Walton, R. Cromer, C. D. Keating and M. J. Natan, Science, 2001, 294, 137 CrossRef CAS.
- K. Braeckmans, S. C. De Smedt, C. Roelant, M. Leblans, R. Pauwels and J. Demeester, Nat. Mater., 2003, 2, 169 CrossRef CAS.
- Y. G. Li, Y. T. H. Cu and D. Luo, Nat. Biotechnol., 2005, 23, 885 CrossRef CAS.
- Y. W. C. Cao, R. C. Jin and C. A. Mirkin, Science, 2002, 297, 1536 CrossRef CAS.
- R. J. Stokes, A. Macaskill, P. J. Lundahl, W. E. Smith, K. Faulds and D. Graham, Small, 2007, 3, 1593 CrossRef.
- J. A. Hansen, R. Mukhopadhyay, J. O. Hansen and K. V. Gothelf, J. Am. Chem. Soc., 2006, 128, 3860 CrossRef CAS.
- J. Wang, G. Liu and A. Merkoci, J. Am. Chem. Soc., 2003, 125, 3214 CrossRef CAS.
- S. C. Zhang, C. Zhang, Z. Xing and X. R. Zhang, Clin. Chem., 2004, 50, 1214 CrossRef CAS.
- O. Ornatsky, V. Baranov, D. R. Bandura, S. D. Tanner and J. Dick, J. Immunol. Methods, 2006, 308, 68 CrossRef CAS.
- A. M. Smith, S. Dave, S. M. Nie, L. True and X. H. Gao, Expert Rev. Mol. Diagn., 2006, 6, 231 CrossRef CAS.
- P. Alivisatos, Nat. Biotechnol., 2004, 22, 47 CrossRef.
- I. L. Medintz, H. T. Uyeda, E. R. Goldman and H. Mattoussi, Nat. Mater., 2005, 4, 435 CrossRef CAS.
- M. Bruchez, M. Moronne, P. Gin, S. Weiss and A. P. Alivisatos, Science, 1998, 281, 2013 CrossRef CAS.
- M. Y. Han, X. H. Gao, J. Z. Su and S. Nie, Nat. Biotechnol., 2001, 19, 631 CrossRef CAS.
- E. R. Goldman, A. R. Clapp, G. P. Anderson, H. T. Uyeda, J. M. Mauro, I. L. Medintz and H. Mattoussi, Anal. Chem., 2004, 76, 684 CrossRef CAS.
- A. R. Clapp, I. L. Medintz, H. T. Uyeda, B. R. Fisher, E. R. Goldman, M. G. Bawendi and H. Mattoussi, J. Am. Chem. Soc., 2005, 127, 18212 CrossRef CAS.
- A. Roda, M. Mirasoli, S. Venturoli, M. Cricca, F. Bonvicini, M. Baraldini, P. Pasini, M. Zerbini and M. Musiani, Clin. Chem., 2002, 48, 1654 CAS.
- Z. Fu, H. Liu and H. Ju, Anal. Chem., 2006, 78, 6999 CrossRef CAS.
- Z. Fu, Z. Yang, J. Tang, H. Liu, F. Yan and H. Ju, Anal. Chem., 2007, 79, 7376 CrossRef CAS.
- Y. Zhou, Y. H. Zhang, C. W. Lau and J. Z. Lu, Anal. Chem., 2006, 78, 5920 CrossRef CAS.
- D. S. Elenis, P. C. Ioannou and T. K. Christopoulos, Anal. Chem., 2007, 79, 9433 CrossRef CAS.
- D. R. Hwang, M. E. Scott and E. Hedaya, Bioconjugate Chem., 1990, 1, 309 CrossRef CAS.
- F. Barlesi, C. Gimenez, J. P. Torre, C. Doddoli, J. Mancini, L. Greillier, F. Roux and J. P. Kleisbauer, Respir. Med., 2004, 98, 357 CrossRef.
- M. E. Duncan, S. M. Mcaleese, N. A. Booth, W. T. Melvin and J. E. Fothergill, J. Immunol. Methods, 1992, 151, 227 CrossRef CAS.
- H. Liu, Z. F. Fu, Z. J. Yang, F. Yan and H. X. Ju, Anal. Chem., 2008, 80, 5654 CrossRef CAS.
- B. G. Knecht, A. Strasser, R. Dietrich, E. Martlbauer, R. Niessner and M. G. Weller, Anal. Chem., 2004, 76, 646 CrossRef CAS.
- E. Yacoub-George, L. Meixner, W. Scheithauer, A. Koppi, S. Drost, H. Wolf, C. Danapel and K. A. Feller, Anal. Chim. Acta, 2002, 457, 3 CrossRef CAS.
- M. C. Moreno-Bondi, J. P. Alarie and T. Vo-Dinh, Anal. Bioanal. Chem., 2003, 375, 120 CAS.
- C. A. Rowe, L. M. Tender, M. J. Feldstein, J. P. Golden, S. B. Scruggs, B. D. MacCraith, J. J. Cras and F. S. Ligler, Anal. Chem., 1999, 71, 3846 CrossRef CAS.
- M. Nichkova, D. Dosev, A. E. Davies, S. J. Gee, I. M. Kennedy and B. D. Hammock, Anal. Lett., 2007, 40, 1423 CrossRef CAS.
- G. D. Liu, J. Wang, J. Kim, M. R. Jan and G. E. Collins, Anal. Chem., 2004, 76, 7126 CrossRef CAS.
- M. S. Wilson, Anal. Chem., 2005, 77, 1496 CrossRef CAS.
- X. Mao, M. Baloda, A. S. Gurung, Y. H. Lin and G. D. Liu, Electrochem. Commun., 2008, 10, 1636 CrossRef CAS.
- M. S. Wilson and W. Y. Nie, Anal. Chem., 2006, 78, 2507 CrossRef CAS.
- D. Tang, R. Yuan and Y. Chai, Clin. Chem., 2007, 53, 1323 CrossRef CAS.
- J. Ni, R. J. Lipert, G. B. Dawson and M. D. Porter, Anal. Chem., 1999, 71, 4903 CrossRef CAS.
- J. Wang, Y. Cao, Y. Y. Xu and G. X. Li, Biosens. Bioelectron., 2009, 25, 532 CrossRef CAS.
- Y. Luo, M. Chen, Q. J. Wen, M. Zhao, B. Zhang, X. Y. Li, F. Wang, Q. Huang, C. Y. Yao, T. L. Jiang, G. R. Cai and W. L. Fu, Clin. Chem., 2006, 52, 2273 CrossRef CAS.
| This journal is © The Royal Society of Chemistry 2010 |
