Determination of paraquat and diquat preconcentrated with N doped TiO2 nanotubes solid phase extraction cartridge prior to capillary electrophoresis
Qingxiang
Zhou
*ab,
Jinli
Mao
b,
Junping
Xiao
c and
Guohong
Xie
d
aState Laboratory of Petroeum Resource and Prospecting, College of Geosciences, China University of Petroleum, Beijing Capmus(CUP), Beijing, 102249, China. E-mail: zhouqx@cup.edu.cn; Fax: +86-10-89733422; Tel: +86-10-89733422
bSchool of Chemistry and Environmental Sciences, Henan Normal University, Key Laboratory for Yellow River and Huaihe River Water Environment and Pollution Control, Ministry of Education, Henan Key Laboratory for Environmental Pollution Control, Xinxiang, 453007, PR China
cDepartment of Chemistry, University of Science and Technology Beijing, Beijing, 100083, PR China
dCollege of Resources and Environment, Henan Institute of Science and Technology, Xinxiang, 453003, China
First published on 24th June 2010
Abstract
This paper describes a new method for rapid and sensitive determination of paraquat (PQ) and diquat (DQ) by solid phase extraction with N doped TiO2 nanotubes cartridge prior to capillary electrophoresis. Several factors that would affect the extraction efficiency were optimized and the optimal conditions were as followed: sample volume, 500 mL; sample pH, pH 9.0; eluant, 1 mol L−1 HCl/methanol: 70/30 (v/v); eluant volume, 3 mL; sample flow rate, 2.5 mL min−1. Under the optimal conditions, the linear ranges and detection limits were 2.5–100 μgL−1, 5–50 μg L−1 and 1.95 μg L−1, 2.59 μg L−1 for PQ and DQ, respectively. The proposed method was successfully applied to the analysis of PQ and DQ in several environmental water samples, and the spiked recoveries were over the range of 84.15–95.38%. These results indicated that N doped TiO2 nanotubes had better enrichment ability for PQ and DQ as a novel SPE adsorbent material, and maybe have good application prospect for monitoring other pollutants in the environment.
1. Introduction
More and more herbicides were used in the world for controlling weeds in modern agriculture. However, with great increase of the consumption, some of them entered the environment by all ways. Their presence in the environment would put a threat on the human health and environment. Hence, more and more concerns were put on monitoring their residues in the environment. Among them, quaternary ammonium herbicides are of major economic importance. Quaternary ammonium herbicides are toxic to human beings and have been classified as moderately hazardous compounds by the World Health Organisation1 and some have been included on “priority” lists. As the typical ones of them, paraquat (PQ) and diquat (DQ), have been used as highly effective herbicides.2 For drinking water, the US Environmental Protection Agency has established a maximum contamination level (MCL) of 20 μg L−1 for DQ and a goal of 3 μg L−1 for PQ.3,4 Therefore, to develop highly selective and sensitive determination methods are of great value for monitoring the quality of drinking water.In general, PQ and DQ were present in the waters as cationic forms in environment, and so they were difficult to be accurately determined. However, many efforts have been put on the method development for the determination of PQ and DQ. There have some reports on the analysis of PQ and DQ based on ion-selective electrodes,5,6 gas chromatographic–mass spectrometry (GC-MS),7 ion-pair liquid chromatography–mass spectrometry (IPLC-MS),8,9 high-performance liquid chromatography (HPLC)10 and liquid chromatography–mass spectrometry (LC-MS)11–14etc. Due to the properties of polarity, high solubility in water and low volatility, they could be easily determined by capillary electrophoresis.15–21 In order to improve the sensitivity and selectivity of the analysis, capillary electrophoresis coupled to mass spectrometry (CE-MS) has also been developed.21 However, CE-MS is very expensive and is not available for an ordinary laboratory. Due to the high separation efficiency of CE, it has been widely used for the determination of environmental pollutants and other analysis, although its concentration sensitivity is low. In order to utilize the merits of CE, it could be used in combination with sample preconcentration techniques with high enrichment factors to overcome the shortcomings of low concentration sensitivity. Meanwhile, enrichment processes could reduce some disturbances along with the enrichment step.
Liquid–liquid extraction was the earliest pre-concentration method for the water samples.22,23 However, nowadays it is hardly used because of the large consumption of organic solvents and serious secondary pollution. Recently many sample pretreatment methods have been developed such as single drop microextraction (SDME),24–26 solid phase microextraction (SPME)27–30 and solid phase extraction (SPE),31–35 stir bar adsorptive microextraction,36 and liquid phase microextraction,37–41etc. In contrast, SPE has become an often-used technique in the analysis of environmental pollutants due to its advantages such as high enrichment factor, wide scope, low consumption of organic solvents, less secondary pollution, rapidness, and removal of the potentially interfering matrix.42,43 In the SPE procedure, some parameters such as kind of adsorbent, kind of eluent and its volume, sample pH, sample flow rate etc. would affect the extraction, and among them, the adsorbent would play an important role. In general, many materials could be used as SPE adsorbents; chemically bonded silica, carbon materials, and porous polymeric materials are the most popular.44 However, new materials are also explored for such proposes. For example, molecularly imprinted polymers, multiwalled carbon nanotubes, Oasis HLB and TiO2 nanotubes and so on have been investigated for the applicability of SPE.45–49 They all exhibited good enrichment capacity for target analytes. TiO2 nanotubes have been successfully used for the enrichment of DDT and its metabolites and organophosphorus pesticides etc. However doped TiO2 nanotubes have different properties from TiO2 nanotubes and have no related reports on the enrichment. N doped TiO2 nanotubes have been synthesized for use as photocatalysts, and should have better enrichment ability to some pollutants. The goal of the present paper is to investigate the enrichment ability of N doped TiO2 nanotubes and to establish a sensitive method for the determination of PQ and DQ utilizing the high enrichment performance of N doped TiO2 nanotubes and the high separation efficiency of CE.
2. Experimental
2.1 Materials
Diquat (1,1′-ethylene-2,2′-bipyridyliumion, DQ) and paraquat (1,1′-dimethyl-4,4′-bipyridyliumion, PQ) were purchased from Beihua Hengxin Science and Technology Co. Ltd. (Beijing, China). 1-Butyl-3-methylimidazolium Hexafluorophosphate([bmim][PF6], 97.0%) was purchased from Acros Organics (Geel, Belgium). HPLC grade methanol was purchased from Kermel Chemical Reagent Co. Ltd (Tianjin, China). HPLC-grade acetonitrile was obtained from Jiangsu Guoda Chemical Reagent Co. Ltd. (Huaiyin, China). Ethanol (≥99.7%, A.R.) was purchased from Beijing Chemical Works (Beijing, China). Sodium hydroxide (≥98.0%, G.R.) was purchased from Beihua Refined Chemical Co. Ltd (Beijing, China). Hydrochloric acid (36∼38%, A.R.) was purchased from Haohua Chemical Reagent Co. Ltd (Luoyang, China). And all other reagents were analytical grade and used directly as obtained.The N doped TiO2 nanotubes was obtained from the laboratory of Professor Liu. N doped TiO2 nanotubes were prepared with alkaline hydrothermal method. The N doped anatase titania was synthesized as in the following steps. 20 mL tetrabutyl titanate was slowly added into 80 mL of absolute ethyl alcohol dropwise whilst rapidly stirring, the stirring was continued for 10 min after the tetrabutyl titanate was completely added. Then nitric acid was used to adjust the acidity, and after 10 min the mixture of ultrapure water, ethanol, and triethylamine with a volume ratio of 1![[thin space (1/6-em)]](https://www.rsc.org/images/entities/char_2009.gif) :
:![[thin space (1/6-em)]](https://www.rsc.org/images/entities/char_2009.gif) 5
5![[thin space (1/6-em)]](https://www.rsc.org/images/entities/char_2009.gif) :
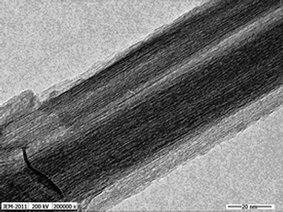
:![[thin space (1/6-em)]](https://www.rsc.org/images/entities/char_2009.gif) 4 was added. The semitransparent sol was matured for 24 h and further dried at 80 °C, and calcined at 400 °C for 2 h after grinding, then cooled and grinded. The N doped anatase titania was obtained. To prepare the titanate nanotubes, 2.0 g of N doped anatase titania was added to 100 mL of 10 mol L−1 NaOH solution in a PTFE-lined autoclave and reacted for 24 h at 140 °C. The obtained titanate nanotubes were washed with ultrapure water until the pH value of the washing solution reached pH 7.0 and then soaked with 0.1 mol L−1 HCl. After that, washed them with ultrapure water. The final were dried in a drying oven and stored for use. Fig. 1 is TEM image of the N doped titanate nanotubes and the accelerating voltage is 200 kV. The specific surface area, mean internal diameter and length of TiO2 nanotubes were 210.41 m2 g−1, 10 nm and 150 nm, respectively.
4 was added. The semitransparent sol was matured for 24 h and further dried at 80 °C, and calcined at 400 °C for 2 h after grinding, then cooled and grinded. The N doped anatase titania was obtained. To prepare the titanate nanotubes, 2.0 g of N doped anatase titania was added to 100 mL of 10 mol L−1 NaOH solution in a PTFE-lined autoclave and reacted for 24 h at 140 °C. The obtained titanate nanotubes were washed with ultrapure water until the pH value of the washing solution reached pH 7.0 and then soaked with 0.1 mol L−1 HCl. After that, washed them with ultrapure water. The final were dried in a drying oven and stored for use. Fig. 1 is TEM image of the N doped titanate nanotubes and the accelerating voltage is 200 kV. The specific surface area, mean internal diameter and length of TiO2 nanotubes were 210.41 m2 g−1, 10 nm and 150 nm, respectively.
N-TiO2 nanotube packed cartridge was prepared by modifying an Agilent ZORBAX SPE C18 cartridge. The C18 packing was evacuated, and 0.1 g N doped TiO2 nanotube was packed in the cartridge. The polypropylene upper frit and lower frit remained at each end of the cartridge to hold the N doped TiO2 nanotube in place. Then the outlet tip of the cartridge was connected to a SHZ-3(III) vacuum pump (Yuhua Instrument Co. Ltd, Zhengzhou, China), and the inlet end of the cartridge was connected to a SPE suction tube whose other end was inserted into sample solutions, and the entire SPE assembly needed to be washed with sufficient methanol and pure water before use.
Stock solutions of PQ and DQ were prepared in water. The separation electrolyte was prepared with [bmim][PF6] and the pH value was adjusted with sodium hydroxide and hydrochloric acid. The separation electrolyte were placed in an ultrasonic bath for 30 min to obtain a clear solution and then stored for use.
2.2 Instrumentation
Separations were performed on an Agilent3DCE Electrophoresis system (Agilent Technologies, USA), equipped with a diode array detector (DAD) at a constant temperature 30 °C. Agilent3D-CE Chemstation was used for the dada analysis and instrument control. The fused-silica capillaries used were 60 cm long with an I.D. of 100 μm and the effective length was 51.5 cm. The ultrapure water was prepared by an auto-doubled pure water distillatory purchased from Yarong Biochemic Apparatus Factory (Shanghai, China). The buffer pH was determined with pH meter, which was obtained from Weiye instrument factory (Shanghai, China). Capillary was conditioned for 30 min at 25 °C with 1 mol L−1 sodium hydroxide solutions. Before use each day, the capillary was rinsed with 0.1 mol L−1 NaOH for 5 min, followed by ultrapure water for 5 min, and running buffer solution for 15 min. Between runs, the capillary was rinsed with buffer solution for 5 min. The operation conditions were as follows: injection pressure, 50 mbar; injection time, 6 s; voltage, 15 kV and detection wavelength, 220 nm for DQ and 254 nm for PQ, respectively. The typical electropherograms were shown in Fig. 2.![The electropherograms of PQ and DQ. Separation conditions: applied voltage, 15 kV; injection pressure, 50 mbar; injection time, 6 s; temperature, 30 °C; detection wavelength, 220 nm for DQ and 254 nm for PQ. Running buffer: [bmim][PF6], 50 mmol L−1; ethanol, 10%; pH 5.0. Peak identification: 1, paraquat; 2, diquat.](/image/article/2010/AY/c0ay00250j/c0ay00250j-f2.gif) | ||
| Fig. 2 The electropherograms of PQ and DQ. Separation conditions: applied voltage, 15 kV; injection pressure, 50 mbar; injection time, 6 s; temperature, 30 °C; detection wavelength, 220 nm for DQ and 254 nm for PQ. Running buffer: [bmim][PF6], 50 mmol L−1; ethanol, 10%; pH 5.0. Peak identification: 1, paraquat; 2, diquat. | ||
2.3 SPE procedure
In the SPE procedure, N doped TiO2 nanotubes SPE cartridge was activated with 2 mL methanol and 2 mL water. The samples were passed through the cartridge with a suitable flow rate, and then the cartridge was dried for about 5 min by negative pressure after the samples were all passed the SPE cartridge. The analytes were eluted using 1 mol L−1 HCl/methanol (70/30, v/v) with an appropriate proportion and the final eluent was blown to dryness with nitrogen stream. The residue was dissolved in 100 μL of buffer for capillary electrophoresis analysis.2.4 Water samples
Two real water samples were used for the validation of the proposed method. Tap water was obtained from our laboratory. Yunmeng Mountain water was obtained from Yunmeng Mountain, Hebi City, Henan Province, China. The water samples were filtered through a 0.45 μm membrane and stored in brown glass containers under low temperature, respectively.3. Results and discussion
CE has high separation efficiency and has many applications in pesticides and other pollutants. Due to no vapor pressure and having high conductivity, ionic liquid was selected for direct separation of PQ and DQ without other buffer solutions. The preliminary experimental results showed that the running buffer consisting of 50 mM [bmim][PF6] and 10% ethanol (pH 5.0) would result in good separation. Because of the low concentrations of the pesticides in environmental waters and the complex matrices, a preconcentration procedure is necessary when a new determination method is to be developed. In this study, N doped TiO2 nanotubes were checked to use as a new adsorbent material for the enrichment of PQ and DQ. As a SPE procedure was concerned, some factors maybe influence the trapping performance such as the pH value of the water samples, the kind and volume of eluent, the sample flow rate and the sample volume. These possible factors were all investigated.3.1 Effect of pH value of the water samples
Sample pH plays an important role in the SPE procedure because pH value determines the existing state of the analytes except for some nonpolar compounds, and then the pH of the sample solution affects the extraction efficiency. In this experiment, a series of experiments were carried out for optimization of the effect of sample pH on the enrichment of PQ and DQ over the range of pH 3.0–11.0. The results were illustrated in Fig. 3, and it was obviously that the extraction recoveries increased with the increase of sample pH, when the sample pH was in the range of pH 3–9, and then decreased when the sample pH increased further. So the satisfactory extraction efficiency of the analytes was obtained at pH 9.0.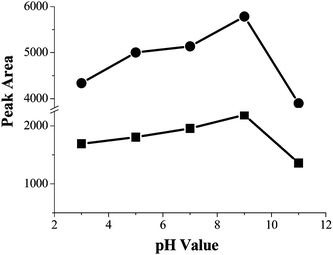 | ||
| Fig. 3 The effect of the sample pH for the extraction efficiency. Spiked concentration, 8.6 μg mL−1 and 6 μg mL−1 for PQ and DQ; sample volume, 50 mL; sample flow rate, 3.5 mL min−1. (■) paraquat (○) diquat. | ||
3.2 Optimization of the percent of HCl in the eluent and the eluent volume
The PQ and DQ are polar compounds and easily soluble in water, so they have much lower solubility in organic solvents. In order to ensure the target compounds be eluted completely from the cartridge, a reasonable eluent should be selected. The preliminary experimental results showed that methanol could achieve good eluting performance. Considering the properties of PQ and DQ, an appropriate amount of HCl added to methanol maybe resulted in better enrichment performance. The amount of 1 mol L−1 HCl added to methanol was investigated in range of 0–100%. The results were shown in Fig. 4. It was found that 1 mol L−1 HCl/methanol (70![[thin space (1/6-em)]](https://www.rsc.org/images/entities/char_2009.gif) :
:![[thin space (1/6-em)]](https://www.rsc.org/images/entities/char_2009.gif) 30, v/v) was the most effective eluent for PQ and DQ.
30, v/v) was the most effective eluent for PQ and DQ.
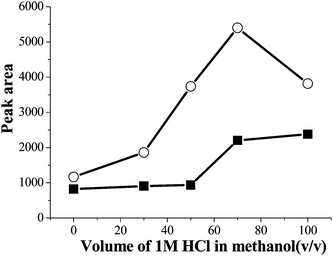 | ||
| Fig. 4 The effect of the amount of 1 mol L−1 HCl in the eluent on the extraction efficiency. Spiked concentration, 8.6 μg mL−1 and 6 μg mL−1 for PQ and DQ; sample volume, 50 mL; sample pH, pH 9.0; sample flow rate, 3.5 mL min−1. (■) paraquat (○) diquat. | ||
The volume of 1 mol L−1 HCl/methanol (70![[thin space (1/6-em)]](https://www.rsc.org/images/entities/char_2009.gif) :
:![[thin space (1/6-em)]](https://www.rsc.org/images/entities/char_2009.gif) 30, v/v) also has an important effect on the eluting performance. The volume was optimized in the range of 1–5 mL, the results were demonstrated in Fig. 5. From Fig. 5, it was found that the peak area of PQ and DQ increased significantly when the volume of 1 mol L−1 HCl/methanol (70
30, v/v) also has an important effect on the eluting performance. The volume was optimized in the range of 1–5 mL, the results were demonstrated in Fig. 5. From Fig. 5, it was found that the peak area of PQ and DQ increased significantly when the volume of 1 mol L−1 HCl/methanol (70![[thin space (1/6-em)]](https://www.rsc.org/images/entities/char_2009.gif) :
:![[thin space (1/6-em)]](https://www.rsc.org/images/entities/char_2009.gif) 30, v/v) was over the range of 1–3 mL, and the peak areas reached the maximum when 3 mL 1 mol L−1HCl/methanol (70
30, v/v) was over the range of 1–3 mL, and the peak areas reached the maximum when 3 mL 1 mol L−1HCl/methanol (70![[thin space (1/6-em)]](https://www.rsc.org/images/entities/char_2009.gif) :
:![[thin space (1/6-em)]](https://www.rsc.org/images/entities/char_2009.gif) 30, v/v) was used. When the volume of 1 mol L−1 HCl/methanol (70
30, v/v) was used. When the volume of 1 mol L−1 HCl/methanol (70![[thin space (1/6-em)]](https://www.rsc.org/images/entities/char_2009.gif) :
:![[thin space (1/6-em)]](https://www.rsc.org/images/entities/char_2009.gif) 30, v/v) increased further, the peak areas of PQ and DQ decreased slightly. In order to obtain a better enrichment performance, 3 mL of 1 mol L−1 HCl/methanol (70
30, v/v) increased further, the peak areas of PQ and DQ decreased slightly. In order to obtain a better enrichment performance, 3 mL of 1 mol L−1 HCl/methanol (70![[thin space (1/6-em)]](https://www.rsc.org/images/entities/char_2009.gif) :
:![[thin space (1/6-em)]](https://www.rsc.org/images/entities/char_2009.gif) 30, v/v) was adopted as the eluent throughout the experiments.
30, v/v) was adopted as the eluent throughout the experiments.
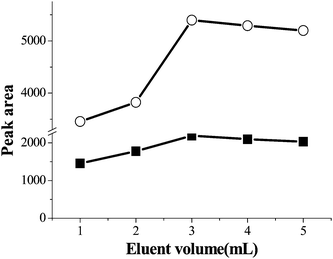 | ||
| Fig. 5 The effect of eluent volume on the extraction efficiency. Spiked sample concentration, 8.6 μg mL−1 and 6 μg mL−1 for PQ and DQ; sample volume, 50 mL; sample pH, pH 9.0; eluant, 1 mol L−1 HCl/methanol: 70/30, v/v; sample flow rate, 3.5 mL min−1. (■) paraquat (○) diquat. | ||
3.3 Effect of the sample flow rate
In a conventional SPE procedure, sample flow rate is an important factor that influences the enrichment efficiency. In theory, the smaller the sample flow rate, the higher the enrichment performance. In this experiment, the sample flow rate was optimized in the range of 0.8–3.5 mL min−1. The results indicated that the flow rate had no obvious influence on the extraction performance in the range of 0.8∼2.5 mL min−1. But when the flow rate was larger than 2.5 mL min−1, enrichment efficiency of the analytes reduced slightly, and the extraction efficiency decreased markedly. The reason was that PQ and DQ were easily soluble in water, and they had very few time to adsorb onto the SPE cartridge when the flow rate was larger, which resulted in bad extraction performance. Therefore, 2.5 mL min−1 was selected as the optimal flow rate in the following experiment.3.4 Effect of the sample volume
To obtain reliable and reproducible results and a high concentration factor, sample volume is of great value in the SPE process. Usually increase of sample volume is a main way to obtain a higher concentration factor. A series of experiments were designed for investigating the effect of sample volume on the enrichment performance of PQ and DQ over the range of 25–750 mL. The samples were spiked at 8.6 μg mL−1 for PQ and 6 μg mL−1 for DQ. The experimental results were exhibited in Fig. 6. From the Fig. 6, as can be seen that the peak areas increased with the increase of sample volume in the range of 25–750 mL, and the increase of peak areas were very small when the sample volume was over 500 mL. Based on these results, 500 mL was used in the subsequent experiments.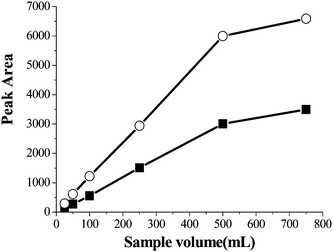 | ||
| Fig. 6 The effect of sample volume on extraction efficiency. Spiked concentration, 8 μg mL−1 and 6 μg mL−1 for PQ and DQ; sample pH, pH 9.0; eluant, 1 mol L−1 HCl/methanol: 70/30, v/v; eluant volume, 3 mL; sample flow rate, 2.5 mL min−1. (■) paraquat (○) diquat. | ||
3.5 Analytical performance of the proposed method
As a new method was developed, the linear ranges, detection limits and precisions were important parameters. In this experiment, these parameters were investigated in detail under the optimal conditions. The results (see Table 1) showed that excellent linear relationships were obtained between the concentration and peak area in the concentration range of 2.5 μg L−1∼100 μg L−1 and 5 μg L−1∼50 μg L−1 with correlation coefficients of 0.994 and 0.997 for PQ and DQ, respectively. At the same time, on the basis of signal-to-noise ratio (S/N = 3), the limits of detection (LOD) were 1.95 μg L−1 and 2.59 μg L−1 for PQ and DQ, respectively. The precisions of this method obtained from six duplicates spiked with the same concentration were 2.86 and 2.12% for PQ and DQ. TiO2 nanotubes without doping were used for the enrichment of trace copper in water samples and achieved a LOD of 0.94 μgL−1.50 This result was due to the fact that the TiO2 nanotubes without doping had larger specific surface area (223.56 m2 g−1) and FAAS with a higher sensitivity was used. PQ and DQ were also determined by SPE with silica and porous graphitic carbon prior to CE51 and the LODs for PQ and DQ were 2.0 μgL−1 or larger in tap and river water samples. M.T. Galceran52 and coworkers reported the LODs of PQ and DQ were in the range of 0.2–2.2 μgL−1 by combining SPE and on-column sample stacking. Proposed method achieved a similar results with that of Ref. 51 and slightly lower than that of Ref. 52.3.6 Real water samples analysis
Two real water samples were used to validate the proposed method. The water samples were enriched under the optimal conditions with N doped TiO2 nanotubes SPE cartridge. No PQ and DQ were found in the blank water samples. In order to validate the applicability of the established method, the spiked recoveries were investigated. The water samples were spiked at a concentration of 6 μg L−1 for DQ and 17 μg L−1 for PQ, and three duplicates of every spiked water sample were enriched with N doped TiO2 nanotubes SPE cartridge prior to analysis. The experimental results demonstrated in Table 2. The average spiked recoveries of the analytes were in the range of 84.15∼95.38%. The spiked and blank electropherograms of Yunmenshan water was shown in Fig. 7. All these results demonstrated that the proposed method were very helpful and of great value for the determination of PQ and DQ in water samples.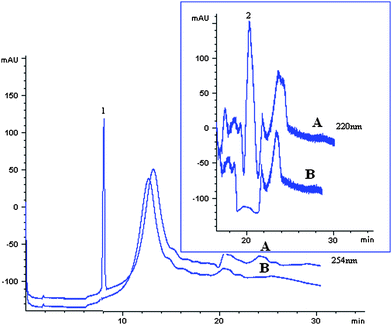 | ||
| Fig. 7 The electrophorograms of PQ and DQ from Yunmenshan water sample. Spiked concentration, 17 μg L−1 for PQ and 6 μg L−1 for DQ; sample pH, pH 9.0; eluant, 1 mol L−1 HCl/methanol: 70/30, v/v; eluant volume, 3 mL; sample flow rate, 2.5 mL min−1; sample volume, 500 mL. A, spiked; B, Blank. Peak identification, 1, PQ; 2, DQ. | ||
4. Conclusions
In the present study, a new, rapid and sensitive determination method was developed for the monitoring PQ and DQ in combination of the high separation efficiency of capillary electrophoresis and high enrichment factor of N doped TiO2 nanotubes SPE cartridge. The proposed method had good linear ranges and satisfactory LODs as 1.95 μgL−1 and 2.59 μgL−1 for PQ and DQ, respectively. The proposed method was also validated with real water samples and satisfactory spiked recoveries were obtained. These data demonstrated that N doped TiO2 nanotubes exhibited much better enrichment ability for PQ and DQ and the proposed method was instructive and would be competitive in the routine analysis of PQ and DQ in environment in the future.Acknowledgements
This work was supported by the National Hi-Tech Development Plan of 863 (2006AA06Z424), the Personal Innovation Foundation of Universities in Henan Province ([2005]126), the Natural Science Foundation of Henan Province (072300460010), and the funds from the Henan Key Laboratory for environmental pollution control.References
- The WHO Recommended Classification of Pesticides By Hazard and Guidelines To Classification 1996–1997, WHO, Geneva, 1996 Search PubMed.
- The Pesticide Manual: A World Compendium Incorporating the Agrochemichal Handbook, 10th ed, The British Crop Protection Council and the Royal Society of Chemistry, Bath, UK, 1994 Search PubMed.
- Drinking Water Health Advisory: Pesticides, US Environmental Protection Agency, Lewis, Chelsea, MI, 1989 Search PubMed.
- Code of Federal Regulations. Title 40, Part 141, US Government Printing Office, Washington, DC, July 1, 1997, Revised Search PubMed.
- B. Pierre and A. Nadia, Electroanalysis, 1997, 9, 602 CAS.
- M. Pecorari and B. Pierre, Electroanalysis, 1998, 10, 181 CrossRef.
- M. A. Rafael and Y. Mauricio, J. Chromatogr., B: Anal. Technol. Biomed. Life Sci., 2007, 853, 260 CrossRef.
- K.-C. Wang, S.-M. Chen, J.-F. Hsu, S.-G. Cheng and C.-K. Lee, J. Chromatogr., B: Anal. Technol. Biomed. Life Sci., 2008, 876, 211 CrossRef CAS.
- A. A. Marıa, V. Borau, L. Fernando, M. Alberto, J. M. Marinas, J. M. Moreno, M. P. Juan and J. U. Francisco, Food Chem., 2006, 97, 181 CrossRef CAS.
- C. K. Fuke, T. Arao, Y. Morinaga, T. Hajime, K. S. Ameno and M. Tetsuji, Leg. Med., 2002, 4, 156 Search PubMed.
- Y. T. Vince, W. D. J. Steve, W. C. Patrick and D. T. Wang, J. Am. Soc. Mass Spectrom., 1998, 9, 830 CrossRef CAS.
- R. Castro, E. Moyano and M. T. Galceran, J. Chromatogr., A, 2001, 914, 111 CrossRef CAS.
- M. A. Marinah and A. A. Robert, J. Chromatogr., B: Anal. Technol. Biomed. Life Sci., 2006, 842, 91 CrossRef CAS.
- K. Marina, L. D. A. Maria and B. Damià, J. Chromatogr., A, 2009, 1216, 520 CrossRef CAS.
- M. C. Carneiro, L. Puignou and M. T. Galceran, Anal. Chim. Acta, 2000, 408, 263 CrossRef CAS.
- O. Nunez, E. Moyano, L. Puignou and M. T. Galceran, J. Chromatogr., A, 2001, 912, 353 CrossRef CAS.
- M. L. Pacheco, E. M. Pena-Mendez and J. Havel, Chemosphere, 2003, 51, 95 CrossRef CAS.
- O. Nuneza, J.-B. Kim, M. Encarnacion, T. G. Maria and S. Terabe, J. Chromatogr., A, 2002, 961, 65 CrossRef CAS.
- A.-V. Marıa-Isabel, G.-D. Teresa, M.-D. Nielene and S.-R. Antonio, Anal. Chim. Acta, 2004, 519, 65 CrossRef CAS.
- O. Nunez, E. Moyano and M. T. Galceran, J. Chromatogr., A, 2002, 946, 275 CrossRef CAS.
- O. Nunez, M. Encarnacion and T. G. Maria, J. Chromatogr., A, 2002, 974, 243 CrossRef CAS.
- G. Min, S. Wang, H. Zhu, G. Fang and Y. Zhang, Sci. Total Environ., 2008, 396, 79 CrossRef CAS.
- J. M. Lee, J. W. Park, G. C. Jang and K. J. Hwang, J. Chromatogr., A, 2008, 1187, 25 CrossRef CAS.
- P. M. Patrícia, R. Susanne and G. R. R. Felix, Food Chem., 2008, 109, 212 CrossRef CAS.
- A. de Souza Pinheiro and J. B. de Andrade, Talanta, 2009, 79, 1354 CrossRef.
- E. G. Amvrazi and N. G. Tsiropoulos, J. Chromatogr., A, 2009, 1216, 2789 CrossRef CAS.
- E. Aguilera-Herrador, R. Lucena, S. Cárdenas and M. Valeárcel, J. Chromatogr., A, 2009, 1216, 5580 CrossRef CAS.
- L. C. Mmualefe, N. Torto, P. Huntsman-Mapila and B. Mbongwe, Microchem. J., 2009, 91, 239 CrossRef CAS.
- G. Ouyang, S. Cui, Z. Qin and J. Pawliszyn, Anal. Chem., 2009, 81, 5629 CrossRef CAS.
- E. Cudjoe, D. Vuckovic, D. Hein and J. Pawliszyn, Anal. Chem., 2009, 81, 4226 CrossRef CAS.
- H. L. Xu, Y. Li, D. Q. Jiang and X. P. Yan, Anal. Chem., 2009, 81, 4971 CrossRef CAS.
- S. C. Nanita, A. M. Pentz and F. Q. Bramble, Anal. Chem., 2009, 81, 3134 CrossRef CAS.
- D. G. Hayward and J. W. Wong, Anal. Chem., 2009, 81, 5716 CrossRef CAS.
- J. Qu, Y. Qu and R. M. Straubinger, Anal. Chem., 2007, 79, 3786 CrossRef CAS.
- R. Tuytten, F. Lemière, W. V. Dongen, E. Witters, E. L. Esmans, R. P. Newton and E. Dudley, Anal. Chem., 2008, 80, 1263 CrossRef CAS.
- P. Sandra, B. Tienpont, J. Vercammen, A. Tredoux, T. Sandra and F. David, J. Chromatogr., A, 2001, 928, 117 CrossRef CAS.
- A. Fromberg, T. Nilsson, B. R. Larsen, L. Montanarella, S. Facchetti and J. O. Madsen, J. Chromatogr., A, 1996, 746, 71 CrossRef CAS.
- R. S. Zhao, C. P. Diao, X. Wang, T. Jiang and J. P. Yuan, Anal. Bioanal. Chem., 2008, 391, 2915 CrossRef CAS.
- Q. X. Zhou, H. H. Bai, G. H. Xie and J. P. Xiao, J. Chromatogr., A, 2008, 1177, 43 CrossRef CAS.
- Q. X. Zhou, H. H. Bai, G. H. Xie and J. P. Xiao, J. Chromatogr., A, 2008, 1188, 148 CrossRef CAS.
- Q. X. Zhou, X. G. Zhang and J. P. Xiao, J. Chromatogr., A, 2009, 1216, 4361 CrossRef CAS.
- M. C. Alcudia-León, R. Lucena, S. Cárdenas and M. Valcárcel, Anal. Chem., 2009, 81, 1184 CrossRef CAS.
- X. H. Shang and X. P. Yan, J. Anal. At. Spectrom., 2007, 22, 1284–1289 RSC.
- S. Rubio and D. Pérez-Bendito, Anal. Chem., 2009, 81, 4601 CrossRef CAS.
- Q. L. Li, X. F. Wang and D. X. Yuan, J. Environ. Monit., 2009, 11, 439 RSC.
- C. Baggiani, P. Baravalle, G. Giraudi and C. Tozzi, J. Chromatogr., A, 2007, 1141, 158 CrossRef CAS.
- B. Gilbert-López, J. F. García-Reyes, M. Mezcua, A. Molina-Díaz and A. R. Fernández-Alba, J. Agric. Food Chem., 2007, 55, 10548 CrossRef CAS.
- Q. X. Zhou, Y. J. Ding, J. P. Xiao, G. G. Liu and X. Y. Guo, J. Chromatogr., A, 2007, 1147, 10 CrossRef CAS.
- Y. R. Huang, Q. X. Zhou, J. P. Xiao, G. H. Xie, 2009, submitted.
- Q. X. Zhou, X. N. Zhao, G. H. Xie and J. P. Xiao, At. Spectrosc., 2008, 29, 145–149 CAS.
- M. C. Carneiro, L. Puignou and M. T. Galceran, Anal. Chim. Acta, 2000, 408, 263–269 CrossRef CAS.
- O. Nunez, E. Moyano and M. T. Galceran, J. Chromatogr., A, 2002, 946, 275–282 CrossRef CAS.
| This journal is © The Royal Society of Chemistry 2010 |

