Quantitative analysis of fluphenazine hydrochloride in human urine using excitation-emission matrix fluorescence based on oxidation derivatization and combined with second-order calibration methods
Shu-Fang
Li
,
Hai-Long
Wu
*,
Lei
Huang
,
Yuan-Na
Li
,
Jin-Fang
Nie
,
Shu-Rong
Zhang
and
Ru-Qin
Yu
State Key Laboratory of Chemo/Biosensing and Chemometrics, College of Chemistry and Chemical Engineering, Hunan University, Changsha, 410082, China. E-mail: hlwu@hnu.cn; Fax: (+86) 731 88821818; Tel: (+86) 731 88821818
First published on 21st May 2010
Abstract
An effective excitation-emission fluorescence method was proposed to determine fluphenazine hydrochloride (FPH) in the presence of chlorprothixene (CPT) in human urine samples with the aid of second-order calibration methods based on the full rank parallel factor analysis (FRA-PARAFAC) and parallel factor analysis (PARAFAC) algorithms respectively. FPH can be transformed into a highly fluorescent derivative through oxidation reaction with KMnO4. Both methods have been recommended to attain FPH concentration in urine samples free from interferents of urine matrix, even in the presence of another antipsychotic drug chlorprothixene (CPT). Satisfactory results have been achieved for FPH in predicted samples, fully exploiting “second-order advantage”. The average recoveries of FPH in the urine samples obtained by using both FRA-PARAFAC and PARAFAC with N = 4 are 101.0 ± 2.8% and 102.3 ± 2.8%, respectively. Furthermore, in order to investigate the performance of the proposed methods, some statistical parameters and figures of merit of FRA-PARAFAC and PARAFAC, i.e., sensitivity (SEN), selectivity (SEL) and limit of detection (LOD) were evaluated, and the accuracy of both algorithms was also validated by the elliptical joint confidence region (EJCR) test.
1. Introduction
Fluphenazine hydrochloride (2-[4-[3-[2-(trifluoromethyl)-10H-phenothiazin-10-yl] propyl]-piperazin-1-yl] ethanol dihydrochloride, FPH) is a typical antipsychotic drug, which belongs to the piperazine class of phenothiazines. FPH has been widely used in the treatment of psychotic patients, due to its neuroleptic and antidepressive effects.1 However, it is noteworthy to mention that some side effects to FPH have also been reported, such as akathisia, extrapyramidal side effects, especially in the case of overdoses or long-term therapy.2 Furthermore, the monitoring of FPH is important for quality assurance in the pharmaceutical industry and for obtaining optimum therapeutic concentrations in body fluids to minimize the risk of toxicity. Taking into account its relatively extensive practicability and possible health effects, quantitative analysis of FPH in body fluids is thus important.Based on the available literature, a wide variety of analytical techniques have been proposed for the determination of FPH in pharmaceutical preparations and biological samples, including spectrophotometry,3–5 electrochemical methods with different electrodes,6,7 spectrofluorometry,8–11 chemiluminescence,12–14 high performance liquid chromatography with ultraviolet detection (HPLC-UV)15,16 and liquid chromatography with mass spectrometric (LC-MS)17,18 or coulometric detection.19 However, most of the aforementioned methods usually involve careful sample pretreatment or liquid chromatographic separation steps when carried out for the determination in biological matrices. Apparently, LC inherently suffers from the main disadvantages associated with the need of large amounts of hazardous organic solvents, large sample volumes, and tedious pretreatment procedures, which are always time-consuming and laborious.
It is well recognized that spectrofluorimetry method is a versatile analytical technique, which is generally more sensitive than other detection systems such as classical UV absorption and less expensive than MS detection. In addition, the spectrofluorimetry method has also proven to be capable of acquiring clear spectra and is suitable for the analysis of substances that possess natural fluorescence. However, fluorescence detection can not provide high selectivity, especially for multi-component mixtures. The fluorescence signal peak of some species is usually broad, so the fluorescence signals of multi-component mixtures is often heavily overlapped, which interferes with the application of fluorescence detection. El-Yazbi et al.11 introduced a spectrofluorometric method based on the use of the first and second derivatives of the ratio of the emission spectra with a zero-crossing technique. The method could resolve the spectral overlapping of a ternary mixture and was applied successfully in synthetic mixtures and in commercial dosage forms. This method could be applied for the quality control of these fluorescent compounds. It is more complicated in the case of analysis in biological matrices and analysts might consider an appropriate pretreatment or using some separation techniques. Instead of using chromatographic separation, fluorescence detection combined with chemometrics could light an avenue to solve the problem. One of the strategies is the collection of excitation-emission matrix fluorescence spectra of a mixture and combination with multivariate resolution and calibration algorithms. The application of excitation and emission matrix fluorescence (EEM) for multi-component analysis is very well known and clearly studied previously. Early in 1977, Warner et al.20 proposed a method for the analysis of a fluorescent sample containing multiple components which utilized the experimental “Emission-Excitation Matrix”. They demonstrated that the Matrix could be used to provide information about (a) the number of independent components contributing to the spectra and (b) the possible excitation and emission spectra of each component in the case where only two are present. Appellof and Davidson21 introduced a rank annihilation method for multi-component determination and extended to a three-dimensional data array, which was obtained from a liquid chromatograph with a video-fluorimeter as detector. They also raised the possibility of improved sensitivity over the two-dimensional method.
FPH is a weak fluorescent substance. Mellinger and Keeler9,10 suggested its oxidation to sulfoxide as the reason for enhancement of fluorescence intensity. It can be easily oxidized by potassium permanganate (KMnO4) in room temperature to a highly fluorescent derivative. The oxidation reaction scheme for FPH was described in Fig. 1(a). In the present work, we used ascorbic acid as an antioxidant to react with excess KMnO4 and collected the fluorescence spectra of the samples as quickly as possible after the preparations were finished. Chlorprothixene (CPT) is an antipsychotic drug of the thioxanthene class, which has a similar oxidation mechanism22,23 under the same conditions and herein was used as an interferent in the determination of FPH. The oxidation reaction scheme for CPT was described in Fig. 1(b). We have attempted to utilize excitation-emission matrix fluorescence (EEM) to quantitative analysis of FPH in human urine samples with the aid of second-order calibration methods in this paper.
 | ||
| Fig. 1 Oxidation reaction schemes of fluphenazine hydrochloride (FPH) (a) and chlorprothixene (CPT) (b). | ||
The rapid development of modern hyphenated instruments capable of generating second-order data has led to a resurgence of interest in the development of second-order calibration-based analytical methodologies. Since the decomposition of a three-way data array stacked with a serial of response matrices measured for each sample is often mathematically unique, the second-order calibration methods can overcome background interference from potential interfering matrix contaminants and give rise to physical and chemical solutions. A great variety of second-order calibration methods have been proposed, such as parallel factor analysis (PARAFAC),24 alternating trilinear decomposition (ATLD)25 and self-weighted alternating trilinear decomposition (SWATLD).26 Compared with other traditional techniques, these methods can enable the direct determination of single analyte or the simultaneous determination of multiple analytes, even in the presence of uncalibrated interferents. Such property is often referred to as the “second-order advantage”,27 which has been a hotspot in the current chemometric domain and successfully employed for broad applications. With the development of theory for tensorial calibration in chemometrics, some practical applications of these quantitative analysis methods as a mathematical separation tool or a supplementation of chemical separation have been carried out, including pharmaceuticals, biological matrices, environmental matrices, and others. More recently, some articles28–31 have summarized the benefits and applications of these methods exhaustively. Full rank parallel factor analysis (FRA-PARAFAC)32 is a modified algorithm for PARAFAC, which can also achieve the second-order advantage. Our group reported on the quantification of noradrenaline in human plasma samples by combining kinetic fluorometric method with FRA-PARAFAC and PARAFAC,33 and also achieved the simultaneous determination of abscisic acid (ABA) and gibberellin (GA) contents in extracts of leaves and buds of Ginkgo with EEM analysis performed with both alternating normalization-weighed error (ANWE) and PARAFAC.34 In addition, the competitive interactions of adriamycin (AMC) and a fluorescence probe of ethidium bromide (EB) with DNA have been studied by FRA-PARAFAC combined with excitation-emission matrix fluorescence.32
In this paper, an effective excitation-emission fluorescence method was proposed to determine FPH in human urine samples with the aid of second-order advantage. The method is based on the measurement of highly fluorescent oxidation derivative of FPH obtained through oxidation reaction with KMnO4 solution. The second-order calibration methods such as PARAFAC and FRA-PARAFAC were employed to quantitative analysis of FPH in urine samples free from potential interferents of complicated biological matrix, even in the presence of another antipsychotic drug chlorprothixene (CPT). The predicted results acquired are satisfactory. Moreover, the figures of merit involving sensitivity (SEN), selectivity (SEL) and limit of detection (LOD) were investigated, and the accuracy of the proposed method was also estimated by using the elliptical joint confidence region (EJCR) test.
2. Theory
2.1 Trilinear component model for second-order calibration
Second-order data are usually generated from hyphenated instruments, such as excitation-emission matrix spectrofluorometer and high-performance liquid chromatography with a diode array detector. In the case of excitation-emission matrix fluorescence, a three-way data array![[X with combining low line]](https://www.rsc.org/images/entities/b_char_0058_0332.gif) with dimensions I × J × K can be produced by stacking a series of excitation-emission fluorescence spectra obtained for K samples consisting of calibration samples and predicted samples at I excitation and J emission wavelengths.
with dimensions I × J × K can be produced by stacking a series of excitation-emission fluorescence spectra obtained for K samples consisting of calibration samples and predicted samples at I excitation and J emission wavelengths.
In second-order calibration, the famous trilinear model proposed by Harshman35 and Carrol and Chang36 has been accepted owing to its consistency with Beer's law in chemistry. A trilinear model for the three-way array has the following form:
 | (1) |
![[E with combining low line]](https://www.rsc.org/images/entities/b_char_0045_0332.gif) .
.
A typical property of is that it can be uniquely decomposed, which can provide access to spectral profiles (A and B) and the relative concentrations (C) of individual factors in the K samples, even in the presence of chemically unknown interferences. The property is the basis of the “second-order advantage”. With the aid of the resolved profile matrices, the real analyte concentrations can be obtained by regression of the appropriate column of relative concentration matrix C corresponding to each analyte against its standard concentrations, which is second-order calibration, see the literature for details.25
2.2 PARAFAC and FRA-PARAFAC algorithms
For decomposition of a three-way data array, in terms of our experimental results, we selected PARAFAC (parallel factor analysis) and FRA-PARAFAC (full rank parallel factor analysis) algorithms which yielded better results to the data analysis. Both of them solve the decomposition problem of the trilinear component model based on the alternating least-squares (ALS) principle, and can uniquely converge into physical and chemical solutions. ALS at first assumes that the profile matrices in two modes are known and then the unknown parameters of the third mode were estimated. It is advantageous because the algorithm is simple to implement. For the superiority, the model has been accepted and used widely in chemistry.28–31 FRA-PRAFAC is a variant of PARAFAC, which utilizes the constrained condition of column full rank of excitation fluorescence data matrix (A) and emission matrix (B) in an ALS iterative procedure. A main advantage for the FRA-PARAFAC algorithm is that it is robust to the estimated component number provided the estimated number is not less than the real chemical component number of the system studied. More detailed information of both algorithms was described in the original literature.24,322.3 Rank estimation
The chemical rank estimation (the number of factors or components responsible for the trilinear model) is always an important and intractable problem in the analysis of three-way data arrays. According to our practical experience, if the chosen model dimensionality is much more than the actual number of components, generally, a model fitting error and a deviation between the predicted and actual results will arise. On the contrary, the algorithm can perform well with more acceptable resolution and calibration when the factor number chosen is the same as the chemical rank of the analytical system. There are many sophisticated methods for determining the number of factors of three-way data arrays in analytical systems, such as the core consistency diagnostic (CORCONDIA)37 and ADD-ONE-UP method.38 However, due to the complexity of the problem, none of them can guarantee the correctness of its results under all circumstances.25,26 Methods used for determinating the number of components only provide a reference. In the present work, we need a method to deal with more complex situations with existence of severe collinearity. Therefore, a subspace projection of pseudo high-way data array (SPPH) method developed by Xia et al.39 is used to determine the number of components. The SPPH method determines the chemical rank through performing singular value decomposition (SVD) on the slice matrices of original high-way data array to produce a pseudo high-way data array and employing the idea of the difference of the original truncated data set and the pseudo one. There are two criteria in SPPH method to be used to draw the final conclusion. One criteria is the residual will increase rapidly and obviously from a very small value to a relatively larger one when the selected factor number f = NI (NJ) + 1, where NI (NJ) denotes the I(J)-mode chemical rank of the three-way data arrays. One can directly observe and determine the appropriate component to fit the model by the figure of projection residuals. The other criteria: Define m = min (I, J) and ss = S*(m)/‖S*‖F; the residual is larger than ss when f > NI (NJ), where S*(m) denotes the mth singular value of XI × JK (XJ × KI). The number of factors needed in decomposing the three-way data array is equal to NI or NJ when NI is equal to NJ. However, when NI is not equal to NJ, a more conservative rule would be examining the possible sources of this difference, for example, N = max (NI, NJ) for having a heavy situation of colinearity. See more details in ref. 39.
2.4 Figures of merit
The estimation of analytical figures of merit (FOM), such as sensitivity (SEN), selectivity (SEL) and limit of detection (LOD) are frequently used for evaluating the results obtained by using the above second-order calibration algorithms. In second-order calibration, the idea of FOM is easy to comprehend by resorting to the useful concept of net analyte signal (NAS),40 which is defined as the part of the signal that relates uniquely to the analyte of interest. Different approaches for the calculation of the FOM have been extensively discussed in the literature.41–44The sensitivity is estimated as the NAS at unit concentration, and the selectivity is the ratio between the sensitivity and the total signal. The following equations can be obtained to estimate the SEN and SEL in this case:
| SEN = k{[(ATA)−1]nn[(BTB)−1]nn}−1/2 | (2) |
| SEL = {[(ATA)−1]nn[(BTB)−1]nn}−1/2 | (3) |
The limit of detection (LOD)45–47 is estimated as follows:
| LOD = 3.3s(0) | (4) |
3. Experimental
3.1 Reagents and chemicals
Fluphenazine hydrochloride (FPH) and chlorprothixene (CPT) were obtained from the National Institute for the Control of Pharmaceutical and Biological Products (Changsha, China). Both of them are chemical reference substances (CRS) in Chinese Pharmacopoeia, and the purity not less than 99.5%. All other chemicals used were of analytical reagent grade and were used without further purification. All glassware were previously soaked in chromate lotion overnight, and then rinsed with doubly distilled water before use. A stock solution of 57.0 μg ml−1 FPH was prepared in a 100 ml brown volumetric flask by dissolving it in water. Standard solution of CPT (63.0 μg ml−1) was prepared by accurate weighing of the appropriate amount of CPT and dissolving with 5 ml 0.01M hydrochloric acid solution then diluting to 100 ml with water. All stock solutions were protected from light and stored at 4 °C in a refrigerator. They were remained stable for at least 2 weeks, which was confirmed by using fluorescence measurement of the oxidation derivative of FPH and CPT at every single day and repeated for 20 days. The working solutions of FPH and CPT were daily prepared by diluting the stock solutions with water. Aqueous solution of 2.1 mM potassium permanganate and 2.3 mM ascorbic acid were prepared daily in 25 ml brown volumetric flask. Drug-free urine was taken from three healthy volunteers for use in preparing the urine samples for recovery investigations. Doubly distilled water was used throughout the experiments.3.2 Apparatus and software
Measurements of the fluorescence spectra signals were performed on an F-4500 fluorescence spectrophotometer (Hitachi, Japan), which was equipped with a 150 W continuous xenon arc lamp and interfaced to a personal computer. A 1.00 cm quartz cell was used at room temperature in all cases. In the MATLAB environment all home-made programs were written and further used for data analysis. All calculations were carried out on a microcomputer under the Windows XP operating system.3.3 Analytical methodology
In this paper, an external pseudo-calibration method was employed. Twenty five samples were prepared for the direct determination of FPH in prediction samples, including six synthetic samples and seven spiked urine samples. The first eight samples (C1–C8) containing FPH in the concentration range 0.2736-0.9120 μg ml−1 were used for pseudo-calibration with the FRA-PARAFAC and PARAFAC algorithms. In addition, four samples (T1–T4) with the analyte concentrations different from those employed for the pseudo-calibration set but within the same concentration range were created as a test set to validate the quality of the pseudo-calibration models. Table 1 lists the concentrations of analyte in both pseudo-calibration and test samples.| Sample | Added concentration/μg ml−1 |
|---|---|
| Calibration samples | |
| C1 | 0.2736 |
| C2 | 0.3648 |
| C3 | 0.4560 |
| C4 | 0.5472 |
| C5 | 0.6384 |
| C6 | 0.7296 |
| C7 | 0.8208 |
| C8 | 0.9120 |
| Test samples | |
| T1 | 0.3374 |
| T2 | 0.4378 |
| T3 | 0.5563 |
| T4 | 0.6475 |
Six synthetic samples (S1–S6) were constructed by spiking 50.0 ng ml−1 CPT as interferent in each sample, and with different FPH concentrations, respectively. Seven urine samples (U1–U7), each containing 100 μl urine, were spiked with different amounts of FPH and with a constant concentration 50.0 ng ml−1 CPT. The urine in the first five samples was taken from the same person, and the urine from a different individual was employed for each remaining sample. The final concentrations of FPH in prediction samples were within the calibration concentration range and shown in Table 2 and Table 3.
| Sample | Added concentration (μg ml −1) | Predicted concentration (μg ml −1) [recovery %] | |
|---|---|---|---|
| FRA-PARAFAC (N = 2) | PARAFAC (N = 2) | ||
| S1 | 0.3192 | 0.3294 [103.2] | 0.3306 [103.6] |
| S2 | 0.4104 | 0.4322 [105.3] | 0.4333 [105.6] |
| S3 | 0.5016 | 0.5185 [103.4] | 0.5195 [103.6] |
| S4 | 0.5928 | 0.5870 [99.0] | 0.5880 [99.2] |
| S5 | 0.6840 | 0.6995 [102.2] | 0.7008 [102.5] |
| S6 | 0.7752 | 0.7925 [102.2] | 0.7947 [102.5] |
| Average recovery (%) | 102.6 ± 1.4 | 102.8 ± 1.4 | |
| Sample | Added concentration (μg ml −1) | Predicted concentration (μg ml −1) [recovery %] | |
|---|---|---|---|
| FRA-PARAFAC | PARAFAC | ||
| U1 | 0.3830 | 0.3948 [103.1] | 0.4011 [104.7] |
| U2 | 0.4560 | 0.4422 [97.0] | 0.4489 [98.5] |
| U3 | 0.6202 | 0.6341 [102.3] | 0.6412 [103.4] |
| U4 | 0.6749 | 0.6897 [102.2] | 0.6976 [103.4] |
| U5 | 0.7296 | 0.7511 [103.1] | 0.7609 [104.3] |
| U6 | 0.7843 | 0.7472 [95.3] | 0.7559 [96.4] |
| U7 | 0.8390 | 0.8748 [104.3] | 0.8837 [105.3] |
| Average recovery (%) | 101.0 ± 2.8 | 102.3 ± 2.8 | |
Both the calibration and prediction samples were prepared according to the following procedure. For each sample, the reagent adding steps were in accordance with the following order of priority: 1) All samples were prepared in 10 ml brown volumetric flasks. Eight calibration samples (C1–C8) and four test samples (T1–T4) only contained appropriate amounts of FPH working solution without any interferents. Six synthetic samples (S1–S6) were contained with different FPH concentrations and a constant amount of CPT for each sample. Seven spiked urine samples (U1–U7), each containing 100 μl urine, were spiked with appropriate amounts of FPH and with a constant concentration CPT; 2) Then 200 μl of 2.1 mM KMnO4 solution was added to each of the volumetric flasks; 3) After allowing the mixture to react for 30 s, 200 μl of 2.3 mM ascorbic acid solution was added to react with excess KMnO4. Then the mixture was diluted to the mark with water and mixed thoroughly. The fluorescence spectra of the solution were measured 120 s after the preparation was finished.
The spectra of the reagent blank (without drugs and urine) were recorded in triplicate during the whole analysis procedure to subtract the influence of blank solutions. Three different blank drug-free urine samples were also determined in triplicate in order to estimate s(0), and then to calculate the limit of detection.
3.4 Measurements
All of the excitation-emission spectra were collected at excitation wavelengths varying from 240 to 370 nm in 5 nm steps, and emission wavelengths varying from 380 to 460 nm in 4 nm steps. The excitation and emission slit widths were both set to 5.0 nm and the scanning rate of the instrument was maintained at 1200 nm min−1. The fluorescence spectra were exported in the ASCII format from the instrument software to MATLAB. Under the above-mentioned conditions, a two-dimensional data array of size 27 × 21 (excitation wavelengths × emission wavelengths) was obtained for each sample.4. Results and discussion
4.1 Spectral characteristics
FPH is a weak fluorescent substance, which can be easily oxidized by KMnO4 in room temperature to a highly fluorescent derivative. Under the experimental parameters described in detail in the relevant part of the experimental, the three-dimensional excitation-emission fluorescence spectra for all of samples were measured in the well-chosen excitation and emission wavelength ranges which avoid Rayleigh and Raman scatterings.As shown in Fig. 2(a), the oxidation derivative of FPH presents a broad emission band with a peak value at 400 nm and multiple-wave excitation pattern with many peak values at 245 nm, 275 nm, 300 nm, 345 nm. Fig. 2 gives excitation-emission matrix fluorescence spectra for synthetic sample S3 (b), urine sample U3 (c) and urine blank sample (d) in the corresponding selected spectral ranges. In the prediction samples, CPT was used as an interferent which has a similar oxidation mechanism with FPH. The fluorescence intensity of sample solution was increased and the shape also had small changes. Moreover, after the urine addition, more changes and intensity increase existed in the urine sample. It can be observed that fluorescence signals from the CPT oxidation derivative and the interferents in the urine were seriously overlapped with the fluorescence signals of the FPH oxidation derivative, restricting the use of traditional spectrofluorometric methods without previous separation procedures. Fortunately, this problem can be overcome by the use of second-order calibration methods, which allow for unique decomposition of trilinear data and can directly extract relative concentration and spectral profiles of individual component of interest in complex samples, achieving “mathematical separation”. In this paper, FRA-PARAFAC and PARAFAC algorithms were recommended to assay the concentrations of FPH in urine samples, even coexisting with another antipsychotic drug, CPT, which fully exploit the “second-order advantage”.
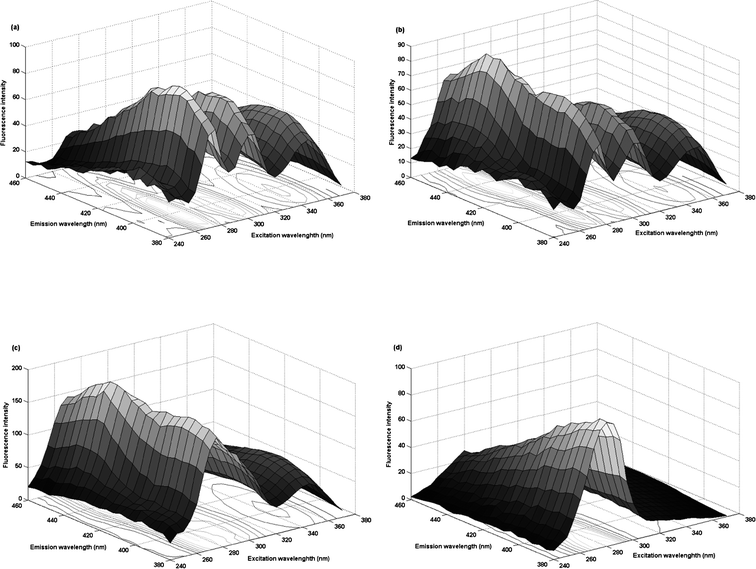 | ||
| Fig. 2 Three-dimensional plots of excitation-emission matrix fluorescence spectra: for sample C5 (a), sample S3 (b), sample U3 (c) and urine blank sample (d) in the corresponding selected spectral ranges. | ||
4.2 Estimation of the number of components
The number of components for the investigated system should be estimated before the application of the second-order calibration algorithms. In the present work, the subspace projection of pseudo high-way data array (SPPH) method, which can deal with more complex situations with existence of severe collinearity, was used to determine the number of components.The projection residuals of ten factors obtained by the SPPH method for the analysis of excitation-emission matrix fluorescence (EEM) data of synthetic samples are listed in Fig. 3a. The projection residuals for XI×JK and XJ×KI of the first two factors corresponded to the small value and increased remarkably to a large value for the subsequent factors. It shows that two underlying factors existed in the synthetic samples. Fig. 3b displays the projection residuals plot obtained by the SPPH method for the analysis of the urine samples. One can find that the projection residuals for XI×JK of the first three factors maintain a relatively small value and suddenly enhance to a very large value for the fourth factor; and the projection residuals for XJ×KI hold a small value with the first four factors and increase to a large value for the later factors. Hence, the factor numbers for XI×JK were considered as three and the factor numbers for XJ×KI were consider as four. Considering the presence of collinearity in the system, we chose N = max (NI, NJ), i.e. N = 4 for the urine samples. That is, one factor is modeled for FPH oxidation derivative, one is corresponding to CPT oxidation derivative, and the remaining two factors are mainly fit interferents from urine.
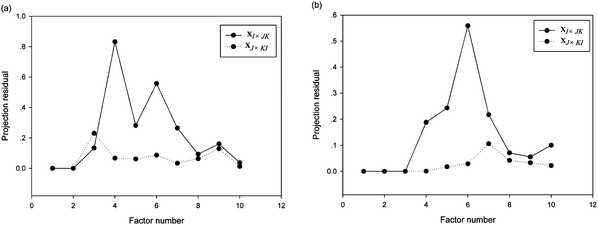 | ||
| Fig. 3 Projection residuals of ten factors for analysis of excitation-emission matrix fluorescence data of synthetic samples (a) and urine samples (b). The solid and dotted lines represented the projection residuals for XI × JK and for XJ × KI, respectively. | ||
4.3 Quantitative analysis of FPH in prediction samples
Prior to analysis in prediction samples, four test samples (T1–T4) without interferents were investigated to test the quality of the optimized pseudo-calibration models. Both FRA-PARAFAC and PARAFAC algorithms with N = 1 were applied for the resolution of these four test samples and used to predict the concentration of FPH in each sample, respectively. The average recoveries of FPH obtained by using these two algorithms were the same, both to be 100.8 ± 0.5%. The results distinctly indicate that the pseudo-calibration models selected are reliable for determining FPH in prediction samples, whose components are complicated and will be discussed in details below.For the determination of FPH in the presence of another antipsychotic drug with similar oxidation mechanism in prediction samples, both FRA-PARAFAC and PARAFAC methods were utilized for the decomposition of the three-way data array obtained. According to the spectral profiles extracted, we can easily find out the column corresponding to the FPH oxidation derivative in absolute concentration modes. The actual FPH concentrations in prediction samples can be evaluated through a linear regression of the appropriate column of relative concentration matrix C corresponding to FPH oxidation derivative against the initial FPH standard concentrations, which is called a pseudo-calibration.
For the quantification of FPH in six synthetic samples, a data array the size of 27 × 21 × 14 (the number 14 corresponds to eight calibration samples plus six synthetic samples) was obtained. The excitation and emission profiles as well as concentration information were resolved from the decomposition of the three-way data array above-mentioned by using FRA-PARAFAC (Fig. 4a1 and 4b1) and PARAFAC (Fig. 4a2 and 4b2) with the factor number of two (N = 2). The loadings associated with the excitation mode were shown in Fig. 4a and the loadings associated with the emission mode were shown in Fig. 4b. These excitation and emission spectral profiles were collected into the matrices A and B, respectively. In Fig. 4, the solid and dash lines represent the loadings of FPH oxidation derivative and CPT oxidation derivative, respectively, and the dotted lines denoted the actual spectral properties of FPH oxidation derivative. It can be observed that the resolved spectral profiles of FPH oxidation derivative are nearly the same as the actual ones, which confirms the accuracy and reliability of the proposed strategy, and satisfactorily predicted results of the FPH concentrations may be expected.
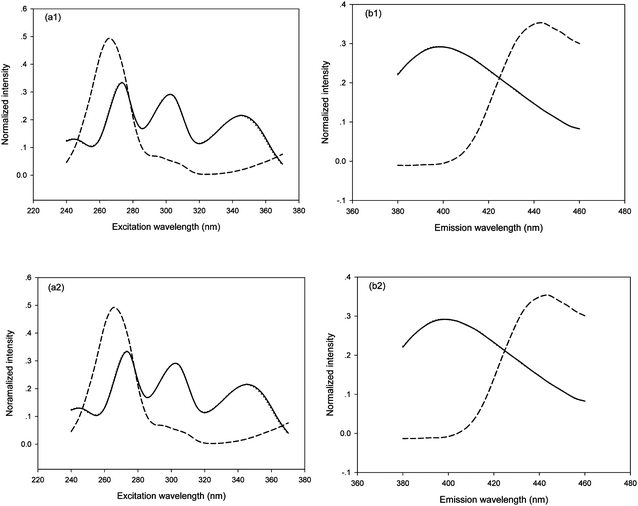 | ||
| Fig. 4 Profiles, normalized columnwise to unit length, obtained from both FRA-PARAFAC (a1, b1) and PARAFAC (a2, b2) with N = 2 for synthetic samples and actual spectral profiles: (a) excitation and (b) emission. The solid, dotted and dash lines represent the profiles of FPH oxidation derivative, the actual one and CPT oxidation derivative, respectively. | ||
The predicted results of FPH gained by FRA-PARAFAC and PARAFAC with N = 2 suggested by the SPPH method are listed in Table 2. The average recoveries of FPH in synthetic samples using FRA-PARAFAC and PARAFAC were found to be 102.6 ± 1.4% and 102.8 ± 1.4%, respectively. These results show that both second-order calibration algorithms can provide a satisfactory resolution and prediction capacity to potentially determine FPH in the presence of CPT.
Additionally, with the similar experimental scheme in the analysis of synthetic samples, both FRA-PARAFAC and PARAFAC methods with N = 4 were utilized for the quantification of FPH in the presence of CPT in urine samples. The loading profiles related to excitation (Fig. 5a) and emission (Fig. 5b) modes together with the actual ones are shown in Fig. 5. These excitation and emission spectral profiles were collected into the matrices A and B, respectively. In Fig. 5, the solid, and dash-dot-dot lines represent the loadings of FPH oxidation derivative and CPT oxidation derivative, respectively, and the short dash and long dash lines represented interferents from urine. Moreover, the dotted lines denoted the actual spectral properties of FPH oxidation derivative. It can be observed that the resolved spectral profiles of FPH oxidation derivative are nearly the same as the actual ones. Although the fluorescence spectra of the CPT oxidation derivative as well as interferents in urine matrices seriously overlapped with these from FPH oxidation derivative, it is still possible to extract the spectral profiles and concentrations of FPH from the urine matrices with the aid of second-order advantage.
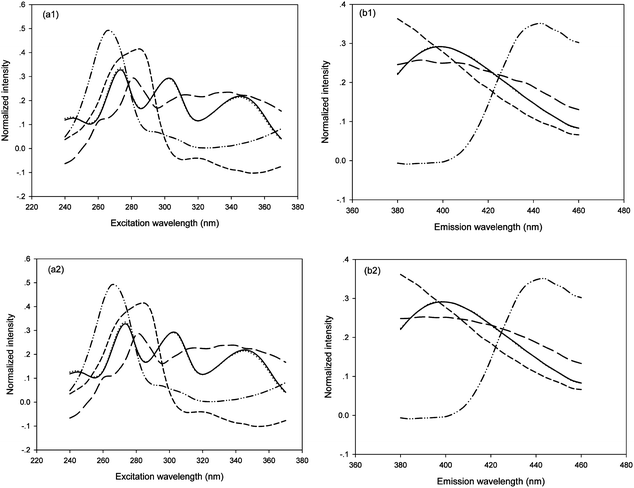 | ||
| Fig. 5 Profiles, normalized columnwise to unit length, obtained from both FRA-PARAFAC (a1, b1) and PARAFAC (a2, b2) with N = 4 for urine samples and actual spectral profiles: (a) excitation and (b) emission. The solid, dotted, dash-dot-dot, dash lines represent the profiles of FPH oxidation derivative, the actual one, CPT oxidation derivative and interferences from urine, respectively. | ||
The prediction results are summarized in Table 3, together with the percentage of recovery in square brackets. The average recoveries acquired from FRA-PARAFAC and PARAFAC are 101.0 ± 2.8% and 102.3 ± 2.8%, respectively. These results demonstrate that a satisfactory prediction capacity is acquired by the application of both second-order calibration algorithms in complicated urine matrices. All of the added and predicted concentration information from Tables 2 and 3 was collected in Fig. 6. From Fig. 6, one could also see the predicted concentrations are very close to the corresponding added concentrations. As can be seen from Fig. 4 and 5, the excitation spectral profiles and emission spectral profiles of FPH in both synthetic samples and urine samples are very similar, respectively, despite the variety of the algorithms employed or being in the different matrices.
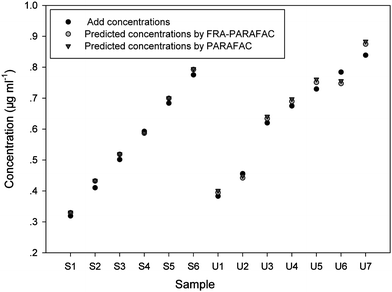 | ||
| Fig. 6 Added concentration (μg ml−1) of FPH, and predicted concentration (μg ml−1) of FPH in prediction samples by using FRA-PARAFAC and PARAFAC algorithms. | ||
4.4 Statistical validation and figures of merit
For the sake of evaluating the performance of the proposed approaches, some statistical parameters and figures of merit including sensitivity (SEN), selectivity (SEL) and limit of detection (LOD) for the determination of FPH in urine samples were investigated and summarized in Table 4. The root mean square error of prediction (RMSEP) can be calculated in terms of the formula as: | (5) |
| FRA-PARAFAC | PARAFAC | |
|---|---|---|
| RMSEP/μg ml−1 | 0.0237 | 0.0270 |
| Linear range/μg ml−1 | 0.00–1.02 | 0.00–1.02 |
| SEN/AFU ml μg−1 | 20.72 | 24.46 |
| SEL | 0.0129 | 0.0152 |
| LOD/μg ml−1 | 0.0036 | 0.0040 |
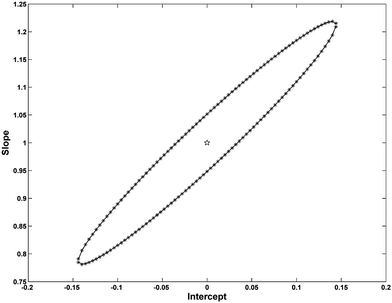 | ||
| Fig. 7 EJCRs for FPH applying FPARAFAC (* line) and PARAFAC (solid line) with N = 4. The pentacle (☆) indicates the ideal points (0, 1). | ||
5. Conclusions
A novel and effective approach for the determination of fluphenazine hydrochloride (FPH) in human urine samples based on its fluorescence property after oxidation with the aid of second-order calibration methods has been developed. The results obtained in this work revealed that excitation-emission matrix fluorescence combined with second-order calibration is an attractive alternative strategy for the quantification of FPH in biological samples. It is expected that the potential advantages of this determination, such as rapidity and low cost, can be even more enhanced by considering the possibility of automating the proposed method. The application in our work is only a limited example of the enormous potentiality of this strategy in the biomedical analytical fields. More applications in other fields, such as food, environmental and agriculture analysis can also be envisaged.Acknowledgements
The authors would like to acknowledge financial support from The National Natural Science Foundation of China (Grant No. 20775025) and the Program for Changjiang Scholars and Innovative Research Team in University (PCSIRT).References
- H. J. Möller, Der Nervenarzt, 2000, 71, 329–344 CrossRef CAS.
- X. Q. Chen, Y. Y. Jin, G. Tang, New Pharmacology, People's Medical Publishing House, Beijing, 15th Ed, 2003, p. 238 Search PubMed.
- R. J. D. Saladanha, S. Anada, B. M. Venkatesha and N. M. Made Gowda, J. Mol. Struct., 2002, 606, 147–154 CrossRef.
- K. Basavaiah and J. M. Swamy, Farmaco, 2001, 56, 579–585 CrossRef CAS.
- C. C. Nascentes, S. Cárdenas, M. Gallego and M. Valcárcel, Anal. Chim. Acta, 2002, 462, 275–281 CrossRef CAS.
- N. A. El-Ragehy, A. M. El-Kosasy, S. S. Abbas and S. Z. El-Khateeb, Anal. Chim. Acta, 2000, 418, 93–100 CrossRef CAS.
- B. Z. Zeng and F. Huang, Talanta, 2004, 64, 380–386 CrossRef.
- J. B. Ragland and V. J. Kinross-Wright, Anal. Chem., 1964, 36, 1356–1359 CrossRef CAS.
- T. J. Mellinger and C. E. Keeler, Anal. Chem., 1963, 35, 554–558 CrossRef CAS.
- T. J. Mellinger and C. E. Keeler, Anal. Chem., 1964, 36, 1840–1847 CrossRef.
- F. A. El-Yazbi, H. H. Hammud and S. A. Assi, Anal. Chim. Acta, 2006, 580, 39–46 CrossRef.
- F. A. Aly, N. A. Alarfaj and A. A. Alwarthan, Anal. Chim. Acta, 1998, 358, 255–262 CrossRef CAS.
- Y. H. Li, W. F. Niu and J. R. Lu, Talanta, 2007, 71, 1124–1129 CrossRef CAS.
- A. A. Ensafi, F. Hasanpour and T. Khayamian, Talanta, 2009, 79, 534–538 CrossRef CAS.
- E. Tanaka, T. Nakamura, M. Terada, T. Shinozuka, C. Hashimoto, K. Kurihara and K. Honda, J. Chromatogr., B: Anal. Technol. Biomed. Life Sci., 2007, 854, 116–120 CrossRef CAS.
- G. Diehl and U. Karst, J. Chromatogr., A, 2000, 890, 281–287 CrossRef CAS.
- H. Kirchherr and W. N. Kühn-Velten, J. Chromatogr., B: Anal. Technol. Biomed. Life Sci., 2006, 843, 100–113 CrossRef CAS.
- H. Hayen and U. Karst, Anal. Chem., 2003, 75, 4833–4840 CrossRef.
- M. A. Saracino, M. Amore, E. Baioni, C. Petio and M. A. Raggi, Anal. Chim. Acta, 2008, 624, 308–316 CrossRef CAS.
- I. M. Warner, G. D. Christian and E. R. Davldson, Anal. Chem., 1977, 49, 564–573 CrossRef CAS.
- C. J. Appellof and E. R. Davidson, Anal. Chim. Acta, 1983, 146, 9–14 CrossRef CAS.
- Z. T. Pang, L. Y. Zhang and C. B. Huang, J. Wuhan Univ. (Nat. Sci. Ed), 2000, 46, 403–406 Search PubMed.
- I. A. Shehata, S. M. EL-Ashry, M. A. EL-Sherbeny and D. T. EL-Shenrbeny, J. Pharm. Biomed. Anal., 2002, 22, 729–737 CrossRef.
- R. Bro, Chemom. Intell. Lab. Syst., 1997, 38, 149–171 CrossRef CAS.
- H. L. Wu, M. Shibukawa and K. Oguma, J. Chemom., 1998, 12, 1–26 CrossRef CAS.
- Z. P. Chen, H. L. Wu, J. H. Jiang, Y. Li and R. Q. Yu, Chemom. Intell. Lab. Syst., 2000, 52, 75–86 CrossRef CAS.
- K. S. Booksh and B. R. Kowalski, Anal. Chem., 1994, 66, 782A–791A CAS.
- G. M. Escandar, N. M. Faber, H. C. Goicoechea, A. M. de la Peña, A. C. Olivieri and R. J. Poppi, TrAC, Trends Anal. Chem., 2007, 26, 752–765 CrossRef CAS.
- A. C. Olivieri, Anal. Chem., 2008, 80, 5713–5720 CrossRef CAS.
- H. L. Wu, J. F. Nie, Y. J. Yu and R. Q. Yu, Anal. Chim. Acta, 2009, 650, 131–142 CrossRef CAS.
- V. Gómez and M. P. Callao, Anal. Chim. Acta, 2008, 627, 169–183 CrossRef CAS.
- H. P. Xie, X. Chu, J. H. Jiang, H. Cui, G. L. Shen and R. Q. Yu, Spectrochim. Acta, Part A, 2003, 59, 743–749 CrossRef.
- S. F. Li, H. L. Wu, A. L. Xia, S. H. Zhu, J. F. Nie, Y. C. Bian, J. Liu and R. Q. Yu, Acta Chim. Sinica, 2008, 66, 947–952 Search PubMed.
- Y. N. Li, H. L. Wu, J. F. Nie, S. F. Li, Y. J. Yu, S. R. Zhang and R. Q. Yu, Anal. Methods, 2009, 1, 115–122 RSC.
- R. A. Harshman, UCLA Working Papers in Phonetics, 1970, 16, 1–84 Search PubMed.
- J. D. Carroll and J. J. Chang, Psychometrika, 1970, 35, 283–319 CrossRef.
- R. Bro and H. A. L. Kiers, J. Chemom., 2003, 17, 274–286 CrossRef CAS.
- Z. P. Chen, Z. Liu, Y. Z. Cao and R. Q. Yu, Anal. Chim. Acta, 2001, 444, 295–307 CrossRef CAS.
- A. L. Xia, H. L. Wu, Y. Zhang, S. H. Zhu, Q. J. Han and R. Q. Yu, Anal. Chim. Acta, 2007, 598, 1–11 CrossRef CAS.
- A. Lorber, Anal. Chem., 1986, 58, 1167–1172 CrossRef CAS.
- Y. Wang, O. S. Borgen, B. R. Kowalski, M. Gui and F. Turecek, J. Chemom., 1993, 7, 117–130.
- K. Faber, A. Lorber and B. R. Kowalski, J. Chemom., 1997, 11, 95–109 CrossRef CAS.
- A. C. Olivieri, Anal. Chem., 2005, 77, 4936–4946 CrossRef CAS.
- A. C. Olivieri and N. M. Faber, J. Chemom., 2005, 19, 583–592 CrossRef CAS.
- A. Lorber, K. Faber and B. R. Kowalski, Anal. Chem., 1997, 69, 1620–1626 CrossRef CAS.
- R. Boqué, J. Ferré, N. M. Faber and F. X. Rius, Anal. Chim. Acta, 2002, 451, 313–321 CrossRef CAS.
- A. C. Olivieri and N. M. Faber, Chemom. Intell. Lab. Syst., 2004, 70, 75–82 CrossRef CAS.
- J. A. Arancibia and G. M. Escandar, Talanta, 2003, 60, 1113–1121 CrossRef CAS.
- A. G. González, M. A. Herrador and A. G. Asuero, Talanta, 1999, 48, 729–736 CrossRef CAS.
| This journal is © The Royal Society of Chemistry 2010 |