DOI:
10.1039/C0AY00238K
(Paper)
Anal. Methods, 2010,
2, 1559-1564
Low cost and rapid analytical technique for determination of niobium and titanium in zirconium alloy
Received
12th April 2010
, Accepted 14th June 2010
First published on
10th August 2010
Abstract
A low cost and rapid analytical technique was developed for determination of major and minor constituents in zirconium alloys. Determination of niobium (Nb) and titanium (Ti) in the bulk matrix of Zr has been done by recording absorption spectra of their peroxy complexes. Samples were initially digested in an acid mixture of HF![[thin space (1/6-em)]](https://www.rsc.org/images/entities/char_2009.gif) :
:![[thin space (1/6-em)]](https://www.rsc.org/images/entities/char_2009.gif) H2SO4
H2SO4![[thin space (1/6-em)]](https://www.rsc.org/images/entities/char_2009.gif) :
:![[thin space (1/6-em)]](https://www.rsc.org/images/entities/char_2009.gif) H2O2 (1
H2O2 (1![[thin space (1/6-em)]](https://www.rsc.org/images/entities/char_2009.gif) :
:![[thin space (1/6-em)]](https://www.rsc.org/images/entities/char_2009.gif) 1
1![[thin space (1/6-em)]](https://www.rsc.org/images/entities/char_2009.gif) :
:![[thin space (1/6-em)]](https://www.rsc.org/images/entities/char_2009.gif) 1 ratio). The interference from the bulk matrix of Zr and other major alloying elements such as Fe, Sn, Cr and Ni in addition to the interferences from trace elements such as Al, Cd, Co, Cu, Hf, Pb, Mn, W and V have been successfully avoided by forming peroxy complexes of Ti and Nb, using different concentrations of H2O2 and H2SO4. The spectrophotometric measurements were carried out at 310 nm and 410 nm for Nb and Ti, respectively. Determination of other major alloying (Fe, Sn, Cr and Ni) elements were also carried out by UV-Visible spectrophotometry, while detection of Cd, Co, Cu, Pb and Mn were carried out by Atomic Absorption Spectrometer (AAS). Inductively Coupled Plasma Optical Emission Spectroscopy (ICP-OES) was used for the determination of Al, Hf, W and V. The validation of the method used for determination of different elements was done by preparing samples using their respective standard solutions.
1 ratio). The interference from the bulk matrix of Zr and other major alloying elements such as Fe, Sn, Cr and Ni in addition to the interferences from trace elements such as Al, Cd, Co, Cu, Hf, Pb, Mn, W and V have been successfully avoided by forming peroxy complexes of Ti and Nb, using different concentrations of H2O2 and H2SO4. The spectrophotometric measurements were carried out at 310 nm and 410 nm for Nb and Ti, respectively. Determination of other major alloying (Fe, Sn, Cr and Ni) elements were also carried out by UV-Visible spectrophotometry, while detection of Cd, Co, Cu, Pb and Mn were carried out by Atomic Absorption Spectrometer (AAS). Inductively Coupled Plasma Optical Emission Spectroscopy (ICP-OES) was used for the determination of Al, Hf, W and V. The validation of the method used for determination of different elements was done by preparing samples using their respective standard solutions.
1.0 Introduction
Zirconium and its alloys are important in the nuclear field because of their favorable chemical characteristics. Zirconium forms alloys with a variety of metals such as Ti, Nb, Ni, Fe, Sn, and Cr. These elements are added to zirconium to improve the mechanical properties and to decrease corrosion by water at high temperatures. Zirconium is used in the manufacture of steel, porcelain, certain nonferrous alloys, and refractories. It is also used in vacuum tubes to remove traces of gases because it combines readily with oxygen, hydrogen, and nitrogen at high temperatures. Zirconium is used in heat exchangers, pump housings, valves, and other equipment subject to corrosion by acids. Special alloys of the metal called zircaloy-2 and zircaloy-4, containing 1.5 percent tin, are used in nuclear reactors as a cladding material for uranium-fuel elements and as a structural material. Zirconium is especially suitable in water-moderated reactors because of its low neutron-absorption cross section, excellent corrosion resistance at moderately elevated temperatures, strength, ductility, and ease of fabrication.1,2
Zirconium occurs in nature mostly in the form of silicate mineral known as zircon, which is extensively used in glass and ceramic industries and in foundries. Zirconium oxide (zirconia) is prepared from zircon and used all over the world as traditional and advanced ceramics and as a refractory material. Zirconium-based alloys are used for components in nuclear reactors with excellent resistance both to corrosion by water and water steam and to hydrogen absorption under operating conditions. Apart from tin (Sn), zirconium-based alloys contains 0.07–0.70% (by weight) iron, 0.05–0.15% chromium, 0.16–0.40% nickel, 0.015–0.30% niobium, 0.002–0.05% silicon, 0.09–0.20% oxygen, and the balance being zirconium and O impurities, normally occurring in reactor grade sponge zirconium. The production of pure zirconium oxide powder, reactor grade zirconium sponge and its alloys such as zircaloy-2, zircaloy-4, Zr–Nb, Zr–Ti, has increased significantly. Zirconium alloy components are permanent components for Pressurized Heavy Water Reactors (PHWRs). Hence specifications of the chemical composition for these components are the most stringent. These structural materials require very strict control during the fabrication to meet the stringent properties with respect to chemistry, mechanical, soundness and dimension. In view of its importance in the nuclear industry, it is essential to know the exact composition of the alloys in the bulk matrix of the Zr. The commonly used procedure for the determination of Ti and Nb in the bulk matrix of zircolay requires a separation of zirconium by extraction with TBP (Tribuytl phosphate) or by mandelic acid precipitation and many more as discussed elsewhere.3–6 This extraction or precipitation process may lead to loss of Nb and Ti by co-extraction or co-precipitation.
In this work, a low cost and rapid method of analysis was developed for the determination of Nb and Ti by total digestion of the sample in HF![[thin space (1/6-em)]](https://www.rsc.org/images/entities/char_2009.gif) :
:![[thin space (1/6-em)]](https://www.rsc.org/images/entities/char_2009.gif) H2SO4: H2O2. The analysis of Nb and Ti was done with the digested zircaloy sample by mixing different proportions of H2O2 and H2SO4. The use of hydrogen peroxide has a distinct advantage over the commonly used procedure for the determination of titanium (Ti) and niobium (Nb) in Zr. Furthermore, the determination of Ti, and Nb was done by AAS which has a poor sensitivity for refractory oxide forming metals like niobium. Determination of other major alloying elements like Fe, Sn, Cr and Ni was done by UV-Visible spectrometry. Traces of Cd, Co, Cu, Pb, Mn, were done by AAS. In addition, inductively coupled plasma optical emission spectroscopy (ICP-OES) was used for the determination of Al, Hf, W and V whereas determination of these elements by other techniques are discussed elsewhere.7,8
H2SO4: H2O2. The analysis of Nb and Ti was done with the digested zircaloy sample by mixing different proportions of H2O2 and H2SO4. The use of hydrogen peroxide has a distinct advantage over the commonly used procedure for the determination of titanium (Ti) and niobium (Nb) in Zr. Furthermore, the determination of Ti, and Nb was done by AAS which has a poor sensitivity for refractory oxide forming metals like niobium. Determination of other major alloying elements like Fe, Sn, Cr and Ni was done by UV-Visible spectrometry. Traces of Cd, Co, Cu, Pb, Mn, were done by AAS. In addition, inductively coupled plasma optical emission spectroscopy (ICP-OES) was used for the determination of Al, Hf, W and V whereas determination of these elements by other techniques are discussed elsewhere.7,8
2.0 Material and methods
2.1 Reagents and test solutions
All reagents of highest purity grade were used and deionized water came from Millipore RiOs™. Standard solutions for calibration of the instruments were prepared by using standard stock solutions either from using Sigma Aldrich, or Merck.
2.2 Dissolution of the sample
Complete dissolution of a 1 g alloy was carried out in a platinum dish in two steps. Initially, a 20 mL mixture of 1![[thin space (1/6-em)]](https://www.rsc.org/images/entities/char_2009.gif) :
:![[thin space (1/6-em)]](https://www.rsc.org/images/entities/char_2009.gif) 1 distilled water and HF was added slowly to a dish. After the initial reaction was over, 10 mL of 36 N sulfuric acid was added, and the dish was heated on a sand bath. After complete dissolution of the alloy, the solution was heated until the evolution of fumes of sulfuric acid started. The sample was allowed to cool and the residue was made up to 250 mL with distilled water.
1 distilled water and HF was added slowly to a dish. After the initial reaction was over, 10 mL of 36 N sulfuric acid was added, and the dish was heated on a sand bath. After complete dissolution of the alloy, the solution was heated until the evolution of fumes of sulfuric acid started. The sample was allowed to cool and the residue was made up to 250 mL with distilled water.
2.2.1 Sample preparation for determination of niobium.
An aliquot of 1 mL of the alloy solution was taken in 25 mL volumetric flasks. To this, 2.5 mL of H2O2 in H2SO4 (prepared by diluting 2 mL of 30% H2O2 to 50 mL with 50% H2SO4) was added and the volume was made up to the mark with 50% H2SO4. Calibration of the niobium was carried out by using the standard solutions prepared by dissolving pure Nb2O5(99.999%, JMC, England). Dissolution of 0.2 g Nb2O5 was carried out with 10 mL of 48% hydrofluoric acid, with 10 mL of deionized water. The reaction was carried out on a sand bath for 2 h. The solution was cooled and 5 ml of 36 N H2SO4 was added drop wise and heated on a sand bath until dense white fumes of H2SO4 appeared. The residue was dissolved in deionized water and made up to a 50 mL in a standard volumetric flask. To minimize the matrix interference, a chemical composition similar to the samples was prepared by mixing it with Zr and other expected metal ions in a similar elemental ratio. The solutions were allowed to stand for half an hour for maximum color development. The spectrophotometric measurements were carried out at 310 nm against the reagent blank. The concentration of Nb was calculated from the calibration graph.
2.2.2 Sample preparation for the determination of titanium.
A 1 ml aliquot of the alloy solution was mixed with 5 mL of 36 N sulfuric acid and 2 mL of 30% w/v H2O2 in a 100 mL of volumetric flask. The solutions were made up to 100 mL with distilled water. Calibration of the titanium was carried out by using standard solutions of titanium oxide prepared by dissolving pure TiO2 (from Leico Industries, USA having 99.99% pure). Dissolution of 0.2 g TiO2 was carried out with 10 mL of 48% hydrofluoric acid, with 10 mL of deionized water. The reaction was carried out on a sand bath for 2 h. The solution was cooled and 5 mL of 36 N H2SO4 was added drop wise and heated on a sand bath until dense white fumes of H2SO4 appeared. Residue was dissolve in deionized water and made up to 50 mL in a standard volumetric flask. To minimize the matrix interferences, a chemical composition equivalent to the sample was maintained by mixing with different elements. The solutions were allowed to stand for half an hour for maximum color development. The spectrophotometric measurements were carried out at 410 nm against the reagent blank. The concentration of Ti was calculated from the calibration graph.
2.2.3 Sample preparation for determination of major alloying elements (Fe, Sn, Cr and Ni).
A 1 mL aliquot of the alloy sample was taken in a 150 ml beaker. Stable complexes of Fe, Sn, Cr and Ni were formed as per the standard protocols discussed elsewhere.9–12 Standard solutions and synthetic samples were prepared in a similar manner. Calibration of these elements were carried out by using their primary salts (Aldrich make) and to minimize the matrix interferences, the standards were prepared by using a similar composition as the sample. The solutions were allowed to stand for half an hour for maximum color development in each case.
2.2.4 Sample preparation for determination of Al, Cd, Co, Cu, Hf, Pb, Mn, W and V.
Determination of traces of impurities was done in the bulk matrix (without separation of zirconium) and after separation of Zr. The separation procedure follows those in the literature.9–12 In the case of without separation, 1 mL of the alloy sample was diluted with deionized water to 100 mL in a standard volumetric flask. In the case of separation, the bulk matrix of Zr is separated in 100% Tributyl phosphate (TBP) from nitric acid medium. Determination of Cd, Co, Cu, Pb and Mn was done by AAS, whereas determination of Al, Hf, W and V was carried out by ICP-OES. Standard solutions and synthetic samples were prepared in a similar manner. Calibration of these elements were done by using their respective ICP and AAS standards either from Sigma Aldrich, USA or Merck, USA.
2.3 Measurement
2.3.2 Atomic absorption spectrophotometer (AAS).
Chemito AA-203 of Chemito Technologies Pvt Ltd (Nashik, India) was used for obtaining absorption data. This instrument has Atomic absorption and Flame Emission Molecular Absorption mode. It works in the wavelength range of 190–900 nm and uses a photo multiplier tube (R 955) as a detector. The data processing is performed by the software supplied by the instrument. Calibration of the instrument for measurements of traces of Cd, Co, Cu, Pb, Mn was done by using an E-Merck standard solution.
2.3.3 Inductively coupled plasma optical emission spectrometry (ICP-OES).
Determination of Al, Hf, W and V was carried out by using a simultaneous solid state detector inductively coupled plasma optical emission spectrometer (ICP-OES, model ACTIVA, from Horiba Jobin Yvon SAS, France). Intensity of emission was measured at two different wavelengths for each elements (Al at 308.215 nm and 396.152 nm, Hf at 264.141 nm and 282.022 nm, W at 224.875 nm and 276.427 nm, V at 309.311 nm and 292.402 nm). The calibration of the instrument was carried out by using their standard solutions.
3.0 Result and discussion
Hydrogen peroxide has long been known as a photometric reagent for titanium, vanadium, and molybdenum which form yellow to reddish yellow peroxy complexes in acid media. Niobium, tungsten, and uranium also react with hydrogen peroxide to form respective peroxy complexes, usable for their determination.13 Due to the formation of the peroxy coloured complexes of titanium and niobium with hydrogen peroxide in acidic medium, it is a very selective reagent for qualitative and quantitative determination of Ti and Nb by UV-Visible spectrometry in a Zircloy alloy. In the case of titanium, yellow to reddish yellow peroxy complexes form, whereas in the case of niobium, a yellow peroxy complex is formed. Simultaneous spectrophotometric determination of titanium, vanadium, and molybdenum with hydrogen peroxide was an early target of investigation of Freegrade and Jones14 on low-alloy steels for their determination. Reading at three wavelengths and solving the simultaneous equations were essential for the determination of the respective metal ions. In the present work, direct determination of the Ti and Nb was done in the bulk matrix of Zr by selecting wavelengths where the absorbance for the Zr is zero. In order to optimize the conditions of peroxy complexation and avoid the interference of Zr in Ti and Nb in the analysis of peroxy complex by spectrophotometry, the spectrum of Ti and Nb is recorded.15
3.1 Optimization of absorbance wavelength for titanium and niobium in the bulk matrix of zircaloy
3.1.1 Niobium.
The absorption spectra for Nb and Zr in 1![[thin space (1/6-em)]](https://www.rsc.org/images/entities/char_2009.gif) :
:![[thin space (1/6-em)]](https://www.rsc.org/images/entities/char_2009.gif) 90 ratio recorded in the wavelength range of 300–550 nm in sulfuric acid medium is shown in Fig. 1. Although there is a mutual interference between zirconium and niobium in the absorption spectrum between 300 and 550 nm wavelengths, the interference is minimum at 310 nm, that is the zirconium peroxide plot showed negligible absorbance at 310 nm where as the niobium-peroxide complex showed maximum absorption at 310 nm. A similar spectra was observed for Nb: Zr ratios 1
90 ratio recorded in the wavelength range of 300–550 nm in sulfuric acid medium is shown in Fig. 1. Although there is a mutual interference between zirconium and niobium in the absorption spectrum between 300 and 550 nm wavelengths, the interference is minimum at 310 nm, that is the zirconium peroxide plot showed negligible absorbance at 310 nm where as the niobium-peroxide complex showed maximum absorption at 310 nm. A similar spectra was observed for Nb: Zr ratios 1![[thin space (1/6-em)]](https://www.rsc.org/images/entities/char_2009.gif) :
:![[thin space (1/6-em)]](https://www.rsc.org/images/entities/char_2009.gif) 95 and 1
95 and 1![[thin space (1/6-em)]](https://www.rsc.org/images/entities/char_2009.gif) :
:![[thin space (1/6-em)]](https://www.rsc.org/images/entities/char_2009.gif) 99. Sulfuric acid media was selected, as niobium remains soluble in it.
99. Sulfuric acid media was selected, as niobium remains soluble in it.
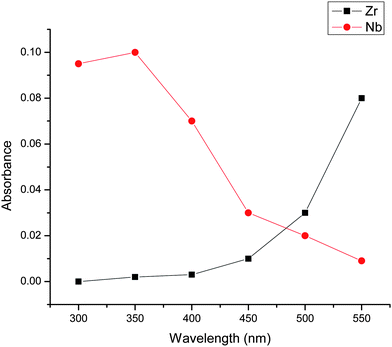 |
| | Fig. 1 Wavelength optimization for measurement of Niobium (Nb) in bulk matrix of Zirconium. | |
3.1.2 Titanium.
Absorption spectra of Ti![[thin space (1/6-em)]](https://www.rsc.org/images/entities/char_2009.gif) :
:![[thin space (1/6-em)]](https://www.rsc.org/images/entities/char_2009.gif) Zr in 1
Zr in 1![[thin space (1/6-em)]](https://www.rsc.org/images/entities/char_2009.gif) :
:![[thin space (1/6-em)]](https://www.rsc.org/images/entities/char_2009.gif) 9 ratio was recoded in the wavelength range of 400 to 550 nm and is shown in Fig. 2. The absorption spectrum for the TiO2+ complex [Ti(IV)OSO4], [H2O2] = 2% and [H2SO4] = 1.8 N H2SO4 shows maximum absorbance at 410 nm where Zr-peroxy showed minimum absorbance. Mutual interference between zirconium and titanium in the absorption spectrum is evident in the range of 400 to 550 nm in sulfuric acid media. Similar results were obtained in the absorption spectra recorded for Ti
9 ratio was recoded in the wavelength range of 400 to 550 nm and is shown in Fig. 2. The absorption spectrum for the TiO2+ complex [Ti(IV)OSO4], [H2O2] = 2% and [H2SO4] = 1.8 N H2SO4 shows maximum absorbance at 410 nm where Zr-peroxy showed minimum absorbance. Mutual interference between zirconium and titanium in the absorption spectrum is evident in the range of 400 to 550 nm in sulfuric acid media. Similar results were obtained in the absorption spectra recorded for Ti![[thin space (1/6-em)]](https://www.rsc.org/images/entities/char_2009.gif) :
:![[thin space (1/6-em)]](https://www.rsc.org/images/entities/char_2009.gif) Zr ratio of 1
Zr ratio of 1![[thin space (1/6-em)]](https://www.rsc.org/images/entities/char_2009.gif) :
:![[thin space (1/6-em)]](https://www.rsc.org/images/entities/char_2009.gif) 8.5 and 1
8.5 and 1![[thin space (1/6-em)]](https://www.rsc.org/images/entities/char_2009.gif) :
:![[thin space (1/6-em)]](https://www.rsc.org/images/entities/char_2009.gif) 9.5. Here again sulfuric acid media was selected, as titanium remains soluble in it. Hence, normal spectrophotometry is suitable for direct estimation of titanium and niobium in the presence of zirconium, even at higher concentrations. A detailed study on the kinetics of the reactions between TiO2+ and H2O2 was reported by O'Sullivan and Tyree.16 Under the experimental conditions used in this study, Ti(IV) exists as TiO2+(aq) complexed with SO42− ion in 1.8 N H2SO4. The kinetics of the formation of the titanium peroxide complex with varying concentration of H2SO4 and H2O2 is studied as per the work done by Sathyanarayana and Patel.17
9.5. Here again sulfuric acid media was selected, as titanium remains soluble in it. Hence, normal spectrophotometry is suitable for direct estimation of titanium and niobium in the presence of zirconium, even at higher concentrations. A detailed study on the kinetics of the reactions between TiO2+ and H2O2 was reported by O'Sullivan and Tyree.16 Under the experimental conditions used in this study, Ti(IV) exists as TiO2+(aq) complexed with SO42− ion in 1.8 N H2SO4. The kinetics of the formation of the titanium peroxide complex with varying concentration of H2SO4 and H2O2 is studied as per the work done by Sathyanarayana and Patel.17
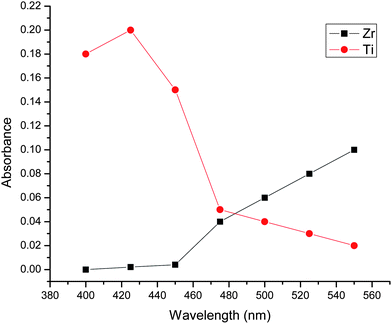 |
| | Fig. 2 Wavelength optimization for measurement of titanium (Ti) in bulk matrix of zirconium and lead. | |
3.2 Effect of concentration of [H2SO4], [H2O2] and time on the optical properties of peroxy titanium/peroxy niobium complex
Quantitative determination of Nb and Ti is based on the formation of coloured peroxy complexes. The intensity of theses peroxy complexes depend upon the concentration of H2SO4 and H2O2 and the time given for the development of the colour. In order to optimize the absorbance of peroxy complexes, spectra were recorded as a function of [H2O2], [H2SO4], elapsed time. Fig. 3(a), Fig 3(b) and Fig. 3(c) show the variation in absorbance with [H2SO4], [H2O2] and elapsed time, respectively. These spectra were obtained with Nb and Ti concentration at 200 μg mL−1 each whereas other constituents were kept within 10% of the optimized values [as described in Fig. 3 (a) and (b)]. The concentrations of H2O2 and H2SO4 have a direct impact on the peroxy complex having a triangular ring structure. The structure of these peroxy complexes were evaluated based on work done by Sathyanarayana and Patel.17 The IR spectrum of these peroxy complexes shows two infrared frequencies assignable to 0–0 stretching of the peroxy niobium group indicating that the peroxy niobium group may have a triangular ring structure.
![Optimization studies on niobium peroxide complex w.r.t. (a) [H2SO4] (b) [H2O2] (c) color development time.](/image/article/2010/AY/c0ay00238k/c0ay00238k-f3.gif) |
| | Fig. 3 Optimization studies on niobium peroxide complex w.r.t. (a) [H2SO4] (b) [H2O2] (c) color development time. | |
3.3 Linearity of the determination of Nb and Ti in zirconium based alloys
The validity and linearity of the determination of Nb and Ti in zirconium based alloys were verified by using the optimized parameters on the synthetic samples prepared from the standard solution of Zr and spiking them with Nb and Ti. The results are given in Tables 1 and 2. The accuracy (more than 99%) and precision clearly validate the experimental parameters such as selection of absorbance wavelength, the concentrations of H2SO4 and H2O2, and the time given for colour development. Fig. 4 gives the concentration of Nb (1–2.5%) and Zr (97.5 to 99%) observed in the different samples. The concentration of Ti along with Zr and Pb in a specially prepared Ti and Zr alloy is shown in Fig. 5. In this alloy, Ti and Zr concentrations range from 10.2 to 10.76% and 89.19–89.79% respectively. Determination of Zr was done by gravimetry method after precipitation with mandelic acid.
| Sr No. |
Number of samples |
Amount of Nb added/mg |
Mean amount of Nb obtained/mg |
| 1 |
5 |
1.0 |
1.06 ± 0.05 |
| 2 |
5 |
1.5 |
1.44 ± 0.05 |
| 3 |
5 |
2.0 |
2.05 ± 0.05 |
| 4 |
5 |
2.5 |
2.42 ± 0.05 |
| 5 |
5 |
3.0 |
2.99 ± 0.05 |
Table 2 Analysis of synthetic samples for Titanium in 90 mg of zirconium
| Sr No. |
Number of samples |
Amount of Nb added/mg |
Mean amount of Nb obtained/mg |
| 1 |
5 |
10 |
10.04 ± 0.06 |
| 2 |
5 |
9.5 |
9.41 ± 0.02 |
| 3 |
5 |
10.5 |
10.3 ± 0.08 |
| 4 |
5 |
9.0 |
9.10 ± 0.07 |
| 5 |
5 |
8.5 |
8.59 ± 0.07 |
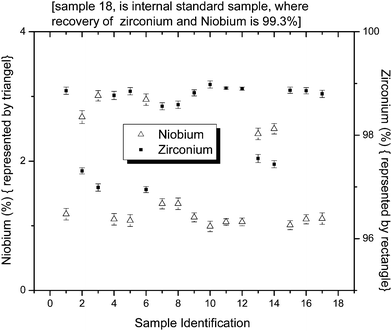 |
| | Fig. 4 Concentration (in percentage, w/w) of Nb and Zr in different samples. | |
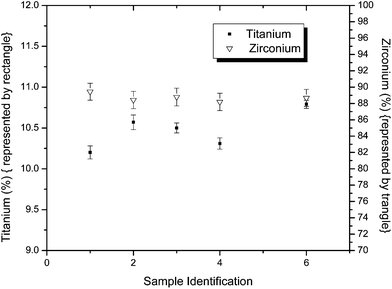 |
| | Fig. 5 Concentration (in percentage, w/w) of Ti and Zr in different samples. | |
3.4 Concentration of major alloying elements (Fe, Sn, Ni and Cr) and traces of Al, Cd, Co, Cu, Hf, Pb, Mn, W and V
Fig. 6 and 7 show the variation of major alloying elements and minor impurities present in the samples with and without separation of Zr. Zr is separated using 100% Tributyl phosphate (TBP) from nitric acid medium. The values shown for different elements in the figures are the average values obtained from seventeen samples. From these figures, it is evident that there are no significant variations between these two determinations except for statistical fluctuation (2–3%). From Fig. 7, it is clearly evident that hafnium (Hf) is less than 50 μg g−1, which is very essential for nuclear grade zirconium alloy, especially in the case of light water reactor where neutron economy is the main concern and Hf has 600 times more neutron absorption cross section compared to Zr. In view of this, it is essential to know the precise and accurate concentrations of the various elements present as impurities in the nuclear grade zircaloy.18–21
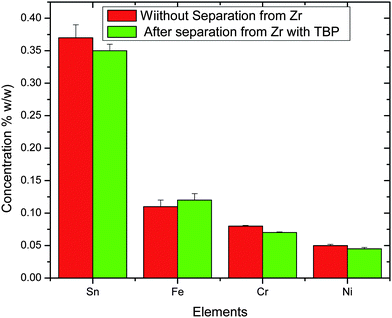 |
| | Fig. 6 Concentration of alloying elements in percentage (w/w) in Zircaloy-2. | |
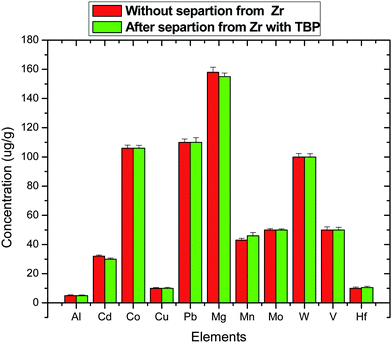 |
| | Fig. 7 Concentration of different elements as impurities in Zircaloy-2. | |
3.5 Comparative recovery of niobium and titanium
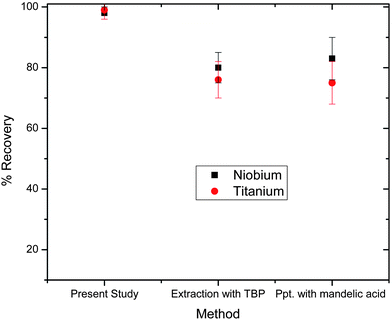
In order to understand the importance of the present study, solutions of zirconium alloy are spiked with known amounts of niobium and titanium. Fig. 8 shows the comparative recovery of niobium and titanium by three different methods. From this figure its clear that in the present work, recoveries were in the range of 97–99% whereas by other methods is about 75–82%. This difference is attributed to losses during extraction in the case of TBP while in the case of mandelic acid, it is due to losses from co-precipitation (precipitation along with Zr-mandelic acid). This fact is verified by further analyzing the titanium and niobium in the zirconium separated by these two methods. In the case of separation with TBP, Nb and Ti were observed at 15% and 16% respectively. While in case of co-precipitation with mandelic acid, Nb and Ti were observed at 25% and 18% respectively.
4.0 Conclusions
The use of zircaloy in the nuclear reactor components necessitates exact and detailed chemical characterization of the material for a large number of analytes from tens of percent to ppm levels. This was achieved by adopting a combination of classical procedures in percentage levels whereas modern instruments like ICP-OES and AAS were employed for the determination of impurities. The procedures presented in the present work helped in the rapid analysis of alloys for various constituents without compromising the quality of the analytical data. The results obtained confirm that hydrogen peroxide can be used to determine niobium and titanium in a zirconium matrix. The absorption performances are strongly affected by the [H2SO4], [H2O2], and time. The linearity of the calibration plots for the determination of Nb and Ti in zirconium based alloy confirmed that the process could be applicable over large concentration range.
Acknowledgements
The authors express their sincere gratitude to Dr T. Mukherjee, Director, Chemistry Group for his support and interest in this work. The authors highly appreciate the encouragement and guidance provided by Dr A.V.R. Reddy during the course of the preparation of the manuscript.
References
-
S. Banerjee, J. K. Chakravarty, J. S. Dubey, R. N. Singh and D. ShrivastavaProceedings of the Symposium Zirconium-2002, Edited by P. K. De. BARC, Mumbai. India, 2002pp 62 Search PubMed.
-
D. D. Sood, Nuclear Materials. BARC, Mumbai, 1996pp 32 Search PubMed.
- N. G. Bakeeva, P. S. Gordienko and E. V. Pashnina, Russ. J. Gen. Chem., 2008, 78-4, 527–531 CrossRef CAS.
- J. S. Gaudh and V. M. Shinde, Anal. Lett., 1995, 28(6), 1107–1125.
- P. R. Haddad, Anal. Lett., 1999, 32(15), 2909–2924 CAS.
- K. L. Ramkumar, V. A. Raman, V. L. Sant, V. D. Kavimandan and H. C. Jain, J. Radioanal. Nucl. Chem., 1988, 125(2), 467–471 CAS.
- N. Lavi, Radiochem. Radioanal. Lett., 1974, 19(4), 241–250 Search PubMed.
- V. K. Pandey, J. S. Becker and H. J. Dietze, Atom. Spectrosc., 1995, 16(3), 97–101 CAS.
-
R. C. Griffin, Technical Methods of Analysis, 2nd Ed., McGraw Hill, New York, 1927, pp 78–87 Search PubMed.
-
I. M. Kolthoff and P. J. Elving. Treatise on Analytical Chemistry, John Wiley and Sons, New York, 1978, pp.89–95 Search PubMed.
-
L. C. Paula and A. R. R. LordelloSpectrochemical Determination of Impurities in Zircaloy 2 and 4. Report Number: IPEN-PUB-107 [NTIS Order Number: DE88700241], 1987 Search PubMed.
-
A. I. Vogel. Quantitative Inorganic Analysis, UK: J. Wiley and Sons, 1989, pp 200–250 Search PubMed.
- M. Possanzini and V. Di Palo, Anal. Chim. Acta., 1995, 315(1–2), 225–230 CrossRef CAS.
- M. Freegarde and B. Jones, Analyst, 1959, 84, 716–719 RSC.
- Sadanobu Inoue, Osamu Mishima, Qiangbin Zhang, Hirotsugu Minami and Masayuki Uto, Anal. Lett., 2001, 34(14), 2465–2475 CrossRef CAS.
- Daniel W. O'Sullivan and Michael Tyree, Int. J. Chem. Kinet, 2007, 39(8), 457–461 CrossRef.
- D. N. Sathyanarayana and C. C. Patel, Z. Anorg. Allg. Chem., 1967, 35, 103–108 CrossRef.
- W. D. Mackintosh and R. E. Jervis, Anal. Chem., 1958, 30(7), 1180–1182 CrossRef CAS.
- T. C. Punc, Nucl. Sci. J, 1981, 18-4, 154–158 Search PubMed.
- V. V. Serbinovich, V. P. Antnv1ch and H. A. Pshetakovskaya, J. Anal.Chem. ÜSRR, 1986, 41(7), 867–81 Search PubMed.
- B. Zhu Luo and X. S. Liu, New Anal. Lett., 1997, 30(5), 963–972 Search PubMed.
|
| This journal is © The Royal Society of Chemistry 2010 |
Click here to see how this site uses Cookies. View our privacy policy here. ![[thin space (1/6-em)]](https://www.rsc.org/images/entities/char_2009.gif) :
:![[thin space (1/6-em)]](https://www.rsc.org/images/entities/char_2009.gif) H2SO4
H2SO4![[thin space (1/6-em)]](https://www.rsc.org/images/entities/char_2009.gif) :
:![[thin space (1/6-em)]](https://www.rsc.org/images/entities/char_2009.gif) H2O2 (1
H2O2 (1![[thin space (1/6-em)]](https://www.rsc.org/images/entities/char_2009.gif) :
:![[thin space (1/6-em)]](https://www.rsc.org/images/entities/char_2009.gif) 1
1![[thin space (1/6-em)]](https://www.rsc.org/images/entities/char_2009.gif) :
:![[thin space (1/6-em)]](https://www.rsc.org/images/entities/char_2009.gif) 1 ratio). The interference from the bulk matrix of Zr and other major alloying elements such as Fe, Sn, Cr and Ni in addition to the interferences from trace elements such as Al, Cd, Co, Cu, Hf, Pb, Mn, W and V have been successfully avoided by forming peroxy complexes of Ti and Nb, using different concentrations of H2O2 and H2SO4. The spectrophotometric measurements were carried out at 310 nm and 410 nm for Nb and Ti, respectively. Determination of other major alloying (Fe, Sn, Cr and Ni) elements were also carried out by UV-Visible spectrophotometry, while detection of Cd, Co, Cu, Pb and Mn were carried out by Atomic Absorption Spectrometer (AAS). Inductively Coupled Plasma Optical Emission Spectroscopy (ICP-OES) was used for the determination of Al, Hf, W and V. The validation of the method used for determination of different elements was done by preparing samples using their respective standard solutions.
1 ratio). The interference from the bulk matrix of Zr and other major alloying elements such as Fe, Sn, Cr and Ni in addition to the interferences from trace elements such as Al, Cd, Co, Cu, Hf, Pb, Mn, W and V have been successfully avoided by forming peroxy complexes of Ti and Nb, using different concentrations of H2O2 and H2SO4. The spectrophotometric measurements were carried out at 310 nm and 410 nm for Nb and Ti, respectively. Determination of other major alloying (Fe, Sn, Cr and Ni) elements were also carried out by UV-Visible spectrophotometry, while detection of Cd, Co, Cu, Pb and Mn were carried out by Atomic Absorption Spectrometer (AAS). Inductively Coupled Plasma Optical Emission Spectroscopy (ICP-OES) was used for the determination of Al, Hf, W and V. The validation of the method used for determination of different elements was done by preparing samples using their respective standard solutions.![[thin space (1/6-em)]](https://www.rsc.org/images/entities/char_2009.gif) :
:![[thin space (1/6-em)]](https://www.rsc.org/images/entities/char_2009.gif) H2SO4: H2O2. The analysis of Nb and Ti was done with the digested zircaloy sample by mixing different proportions of H2O2 and H2SO4. The use of hydrogen peroxide has a distinct advantage over the commonly used procedure for the determination of titanium (Ti) and niobium (Nb) in Zr. Furthermore, the determination of Ti, and Nb was done by AAS which has a poor sensitivity for refractory oxide forming metals like niobium. Determination of other major alloying elements like Fe, Sn, Cr and Ni was done by UV-Visible spectrometry. Traces of Cd, Co, Cu, Pb, Mn, were done by AAS. In addition, inductively coupled plasma optical emission spectroscopy (ICP-OES) was used for the determination of Al, Hf, W and V whereas determination of these elements by other techniques are discussed elsewhere.7,8
H2SO4: H2O2. The analysis of Nb and Ti was done with the digested zircaloy sample by mixing different proportions of H2O2 and H2SO4. The use of hydrogen peroxide has a distinct advantage over the commonly used procedure for the determination of titanium (Ti) and niobium (Nb) in Zr. Furthermore, the determination of Ti, and Nb was done by AAS which has a poor sensitivity for refractory oxide forming metals like niobium. Determination of other major alloying elements like Fe, Sn, Cr and Ni was done by UV-Visible spectrometry. Traces of Cd, Co, Cu, Pb, Mn, were done by AAS. In addition, inductively coupled plasma optical emission spectroscopy (ICP-OES) was used for the determination of Al, Hf, W and V whereas determination of these elements by other techniques are discussed elsewhere.7,8![[thin space (1/6-em)]](https://www.rsc.org/images/entities/char_2009.gif) :
:![[thin space (1/6-em)]](https://www.rsc.org/images/entities/char_2009.gif) 1 distilled water and HF was added slowly to a dish. After the initial reaction was over, 10 mL of 36 N sulfuric acid was added, and the dish was heated on a sand bath. After complete dissolution of the alloy, the solution was heated until the evolution of fumes of sulfuric acid started. The sample was allowed to cool and the residue was made up to 250 mL with distilled water.
1 distilled water and HF was added slowly to a dish. After the initial reaction was over, 10 mL of 36 N sulfuric acid was added, and the dish was heated on a sand bath. After complete dissolution of the alloy, the solution was heated until the evolution of fumes of sulfuric acid started. The sample was allowed to cool and the residue was made up to 250 mL with distilled water.
![[thin space (1/6-em)]](https://www.rsc.org/images/entities/char_2009.gif) :
:![[thin space (1/6-em)]](https://www.rsc.org/images/entities/char_2009.gif) 90 ratio recorded in the wavelength range of 300–550 nm in sulfuric acid medium is shown in Fig. 1. Although there is a mutual interference between zirconium and niobium in the absorption spectrum between 300 and 550 nm wavelengths, the interference is minimum at 310 nm, that is the zirconium peroxide plot showed negligible absorbance at 310 nm where as the niobium-peroxide complex showed maximum absorption at 310 nm. A similar spectra was observed for Nb: Zr ratios 1
90 ratio recorded in the wavelength range of 300–550 nm in sulfuric acid medium is shown in Fig. 1. Although there is a mutual interference between zirconium and niobium in the absorption spectrum between 300 and 550 nm wavelengths, the interference is minimum at 310 nm, that is the zirconium peroxide plot showed negligible absorbance at 310 nm where as the niobium-peroxide complex showed maximum absorption at 310 nm. A similar spectra was observed for Nb: Zr ratios 1![[thin space (1/6-em)]](https://www.rsc.org/images/entities/char_2009.gif) :
:![[thin space (1/6-em)]](https://www.rsc.org/images/entities/char_2009.gif) 95 and 1
95 and 1![[thin space (1/6-em)]](https://www.rsc.org/images/entities/char_2009.gif) :
:![[thin space (1/6-em)]](https://www.rsc.org/images/entities/char_2009.gif) 99. Sulfuric acid media was selected, as niobium remains soluble in it.
99. Sulfuric acid media was selected, as niobium remains soluble in it.

![[thin space (1/6-em)]](https://www.rsc.org/images/entities/char_2009.gif) :
:![[thin space (1/6-em)]](https://www.rsc.org/images/entities/char_2009.gif) Zr in 1
Zr in 1![[thin space (1/6-em)]](https://www.rsc.org/images/entities/char_2009.gif) :
:![[thin space (1/6-em)]](https://www.rsc.org/images/entities/char_2009.gif) 9 ratio was recoded in the wavelength range of 400 to 550 nm and is shown in Fig. 2. The absorption spectrum for the TiO2+ complex [Ti(IV)OSO4], [H2O2] = 2% and [H2SO4] = 1.8 N H2SO4 shows maximum absorbance at 410 nm where Zr-peroxy showed minimum absorbance. Mutual interference between zirconium and titanium in the absorption spectrum is evident in the range of 400 to 550 nm in sulfuric acid media. Similar results were obtained in the absorption spectra recorded for Ti
9 ratio was recoded in the wavelength range of 400 to 550 nm and is shown in Fig. 2. The absorption spectrum for the TiO2+ complex [Ti(IV)OSO4], [H2O2] = 2% and [H2SO4] = 1.8 N H2SO4 shows maximum absorbance at 410 nm where Zr-peroxy showed minimum absorbance. Mutual interference between zirconium and titanium in the absorption spectrum is evident in the range of 400 to 550 nm in sulfuric acid media. Similar results were obtained in the absorption spectra recorded for Ti![[thin space (1/6-em)]](https://www.rsc.org/images/entities/char_2009.gif) :
:![[thin space (1/6-em)]](https://www.rsc.org/images/entities/char_2009.gif) Zr ratio of 1
Zr ratio of 1![[thin space (1/6-em)]](https://www.rsc.org/images/entities/char_2009.gif) :
:![[thin space (1/6-em)]](https://www.rsc.org/images/entities/char_2009.gif) 8.5 and 1
8.5 and 1![[thin space (1/6-em)]](https://www.rsc.org/images/entities/char_2009.gif) :
:![[thin space (1/6-em)]](https://www.rsc.org/images/entities/char_2009.gif) 9.5. Here again sulfuric acid media was selected, as titanium remains soluble in it. Hence, normal spectrophotometry is suitable for direct estimation of titanium and niobium in the presence of zirconium, even at higher concentrations. A detailed study on the kinetics of the reactions between TiO2+ and H2O2 was reported by O'Sullivan and Tyree.16 Under the experimental conditions used in this study, Ti(IV) exists as TiO2+(aq) complexed with SO42− ion in 1.8 N H2SO4. The kinetics of the formation of the titanium peroxide complex with varying concentration of H2SO4 and H2O2 is studied as per the work done by Sathyanarayana and Patel.17
9.5. Here again sulfuric acid media was selected, as titanium remains soluble in it. Hence, normal spectrophotometry is suitable for direct estimation of titanium and niobium in the presence of zirconium, even at higher concentrations. A detailed study on the kinetics of the reactions between TiO2+ and H2O2 was reported by O'Sullivan and Tyree.16 Under the experimental conditions used in this study, Ti(IV) exists as TiO2+(aq) complexed with SO42− ion in 1.8 N H2SO4. The kinetics of the formation of the titanium peroxide complex with varying concentration of H2SO4 and H2O2 is studied as per the work done by Sathyanarayana and Patel.17
![Optimization studies on niobium peroxide complex w.r.t. (a) [H2SO4] (b) [H2O2] (c) color development time.](/image/article/2010/AY/c0ay00238k/c0ay00238k-f3.gif)


