Preparation of a mixed-mode of hydrophobic/cation-exchange polymer monolith and its application to analysis of six antidepressants in human plasma
Qiao
Ma
,
Jin
Xu
,
Yang
Lu
,
Zhi-Guo
Shi
and
Yu-Qi
Feng
*
Key Laboratory of Analytical Chemistry for Biology and Medicine (Ministry of Education), Department of Chemistry, Wuhan University, Wuhan, 430072, PR China. E-mail: yqfeng@whu.edu.cn; Fax: +86-27-68755595; Tel: +86-27-68755595
First published on 2nd August 2010
Abstract
A hydrophobic/cation-exchange polymer monolith was prepared via one-step thermally initiated polymerization of 2-acrylamido-2-methyl-1-propyl-sulfonic acid (AMPS), divinylbenzene (DVB) and ethylene glycol dimethacrylate (EDMA) in a capillary. The use of DVB and EDMA as binary crosslinking monomers help to increase the specific surface area and enhance hydrophobicity of the target monolith. The as-obtained monolith was characterized by diffuse reflectance infrared spectroscopy, scanning electron microscopy, nitrogen adsorption–desorption and mercury intrusion porosimetry. The results show that the monolith has favorable permeability and well mechanical strength. Furthermore, its specific surface area is up to 353 m2 g−1. The as-prepared monolith was used as a sorbent for polymer monolith microextraction (PMME), which was coupled to high performance liquid chromatographic-electrospray ionization-mass spectrometric (HPLC-ESI-MS) analysis in off-line mode for the determination of antidepressants in biological samples. The results show that the monolith with hydrophobic and strong cation-exchange functional groups exhibits high extraction efficiency towards the antidepressants. The limits of detections (S/N = 3) for the antidepressants in plasma samples were in the range of 0.06–0.39 ng mL−1 and the recoveries were from 73.2% to 110.8% (depending on the analytes), with relative standard deviations (RSDs) less than 9.8%.
Introduction
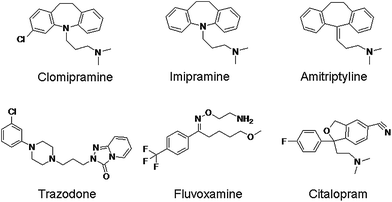
Depression is a chronic illness that affects social functions of patients and can eventually lead to suicidal behavior.1 The treatment of depressive disorders is usually accomplished by the use of antidepressant medication.2,3Important groups of antidepressants include tricyclic antidepressants (TCAs) (imipramine, amitriptyline and clomipramine), tetracyclic antidepressant (TeCA) (trazodone) and the selective serotonin reuptake inhibitors (SSRIs) (citalopram and fluvoxamine). TCAs belong to the first generation of the antidepressants and block the reuptake of the neurotransmitters, norepinephrine and serotonin in the central nervous system.4 Trazodone blocks the reuptake of serotonin in the presynaptic neurones and also acts at the 5-HT1 receptors.5 SSRIs block the reuptake of serotonin at central synapses selectively and powerfully.6 The chemical structures of these antidepressants are shown in Fig. 1. The drugs, especially TCA series, have narrow therapeutic windows and are dangerous in overdoses, which may bring drug-related death issues. In such cases, the risk of adverse effects should be considered. The measurement of these drugs in plasma levels is mandatory.6
 | ||
| Fig. 1 Chemical structures of the antidepressants. | ||
Solid-phase extraction (SPE)2,7–11 has been the most frequently employed technique for extraction of antidepressants from biofluids. The main purpose of the sample preparation is to enrich target analytes and clean up possible interfering matrices. However, this classic method usually consumes a large volume of sample, as well as being laborious and time consuming. In the past decade, solid-phase microextraction (SPME) was introduced as a simple, sample saving and timesaving extraction technique.6,12–15 To date, a large variety of sorbents has been utilized in SPME. Among these, SPME based on sorbents of polymer monoliths has drawn much attention, in which the SPME is also called as polymer monolith microextraction (PMME).16
Generally polymer monoliths can be synthesized by one-step polymerization and the porous structures of them are readily tunable.17,18 Another remarkable advantage of polymer monoliths lies in that the macroporous structure can realize convective mass transfer, which would be favorable to the extraction process.19
Polymer monolith is the kernel of PMME device. Its chemical composition, porous structure and morphology predetermine the efficiency of the extraction process.20 Poly(methacrylic acid-co-ethylene glycol dimethacrylate) (MAA-co-EDMA) monolith, a polymeric sorbent with weak cation-exchange groups, was first introduced into the technique to analyze several basic drugs in human serum.18 Later on, its application was expanded to biological21,22 and food 23 analysis. The success of poly(MAA-co-EDMA) in PMME has aroused interest from researchers and various monolithic sorbents have been developed, including poly(acrylamide-co-vinylpyridine-co-N,N′-methylene bisacrylamide) (AA-co-VP-co-Bis),24 poly(3-acrylamidophenylboronic acid-co-ethylene dimethacrylate) (AAPBA-co-EDMA),25 hydroxylated26 and diethylamine-modified27 poly(glycidyl methacrylate-co-ethylene glycol dimethacrylate) (GMA-co-EDMA) monolith. These sorbents have shown some unique performance in extraction.
Fabrication of new polymer monoliths to enrich PMME is still an interesting task. Previous reports demonstrate that polymer monoliths with multifunctional moieties are promising. Their applications in capillary electrophoresis or capillary electrochromatography have been shown to be very successful.28–34 However, none of such materials has been used in PMME. In the present study, a new polymer monolith having dual functional groups with hydrophobic and strong cation-exchange properties was prepared for PMME application. γ-Methacryloxypropyltrimethoxysilane (γ-MAPS) was attached to the inner wall of a capillary first by sol–gel reaction. Then monomers of 2-acrylamido-2-methyl-1-propanesulfonic acid (AMPS), divinylbenzene (DVB) and diethylene glycol dimethacrylate (EDMA) were introduced into the capillary for polymerization. In this poly(AMPS-co-DVB-co-EDMA) monolith, AMPS provides ion-exchange interaction sites and DVB help to increase the surface area and enhance hydrophobic interactions.20 Poly(ethylene glycol) (PEG) with different molecule weights were investigated as polymeric porogen to control the porous structure and specific surface area of the monolithic material. Based on this monolith, a method was proposed for the extraction and determination of six antidepressants from human plasma samples by PMME combined with high performance liquid chromatographic-electrospray ionization-mass spectrometric (HPLC-ESI-MS) analysis.
Experimental
Reagents
AMPS (99% pure) was supplied by Aladdin (Shanghai, China). EDMA (98% pure) and DVB (98% pure) were purchased from Acros (New Jersey, USA). γ-MAPS was obtained from the Chemical Plant of Wuhan University (Wuhan, China). Azobisisobutyronitrile (AIBN), N, N-dimethylformamide (DMF), PEG (MW, 400, 2000, 6000) and methanol of analytical reagent grade were obtained from Shanghai Chemical Reagent Corporation (Shanghai, China). Acetonitrile (ACN, HPLC grade) was supplied by Tedia (Ohio, USA). Water used throughout the study was purified using an Aike apparatus (Chengdu, China). Imipramine, amitriptyline, clomipramine, trazodone, citalopram, fluvoxamine and sertraline (used as internal standard, I.S.) of HPLC purity grade were obtained from the National Institute for Control of Pharmaceutical and Biological Products (Beijing, China). A stock standard solution of 1 mg mL−1 for each analyte was prepared in methanol and stored at 4 °C in dark. With these standard solutions, the sample solutions were spiked to the desired concentration for experiments.Preparation of monoliths
The polymer monolith was synthesized inside a fused-silica capillary (0.53 mm I.D.). The inner surface of the capillary was derivatized with γ-MAPS18 and then dried with N2. The poly(AMPS-co-DVB-co-EDMA) monolith was prepared by a one-step thermally-initiated polymerization method. First, porogen PEG was dissolved in DMF and thoroughly mixed to ensure that the solution was homogeneous. Subsequently monomer AMPS and cross-linker (DVB and EDMA) were added in the ratios described in Table 1. The mixture was then briefly shaken before adding the initiator AIBN (1% w/w with respect to monomer) to the solution. The polymerization mixture was completely mixed by vortexing and ultrasonication to form a homogeneous solution. Then the solution was filled into the capillary. Both ends of the capillary were sealed by silicon rubber for polymerization at 60 °C for 16 h. Finally the capillary was washed with ACN and acetone in sequence. Meanwhile, monoliths were synthesized in centrifuge tubes respectively for surface area measurement. After polymerization, the polymers were cut into small pieces and submersed into hot (70 °C) water–methanol (1/1, v/v) for at least 4 h to remove the PEG and non-reacted chemicals.35 The washing was repeated three times. Then, the samples were dried in an oven at 100 °C before characterization.| Monolith No. | AMPS/mg | DVB/mg | EDMA/mg | PEG/mg | Specific surface area/m2 g−1 | K 10−14/m2 |
|---|---|---|---|---|---|---|
| a The volume of co-porogen (DMF) was 220 μL. | ||||||
| M1 | 10 | 40 | 40 | — | 440 | 319.6 |
| M2 | 10 | 40 | 40 | 20 (PEG-400) | 391 | 1052.7 |
| M3 | 10 | 40 | 40 | 20 (PEG-2000) | 408 | 1066.4 |
| M4 | 10 | 40 | 40 | 20 (PEG-6000) | 334 | 1310.6 |
| M5 | 10 | 40 | 40 | 70 (PEG-2000) | 353 | 5781.3 |
| M6 | 5 | 42.5 | 42.5 | 70 (PEG-2000) | 356 | 41751 |
| M7 | 15 | 37.5 | 37.5 | 70 (PEG-2000) | 272 | 61508 |
| M8 | 10 | 25 | 55 | 70 (PEG-2000) | 249 | — |
| M9 | 10 | 55 | 25 | 70 (PEG-2000) | 411 | 1052800 |
| M10 | 10 | — | 80 | 70 (PEG-2000) | 289 | — |
| M11 | 10 | 80 | — | 70 (PEG-2000) | 330 | — |
Characterization
Scanning electron microscopy (SEM) was performed to examine the microscopic morphology of the monoliths using a JSM-6700F field emission electron microscope instrument (JEOL, Tokyo, Japan). Prior to measurement, the monolithic capillary samples were cut into 2 mm long pieces, placed on an aluminium stub and then sputter-coated with gold. The surface area and mesopore size distribution of poly(AMPS-co-DVB-co-EDMA) monolith were obtained by nitrogen adsorption–desorption experiments with a JW-BK surface area and pore size analyzer (JWGB Co. Ltd., Beijing, China). Before measurement, the monolithic pieces were evacuated in vacuum, and heated to 120 °C for 6 h to remove the physically adsorbed substances. The macroporous properties of the monoliths were determined by mercury intrusion porosimetry using a Micromeritics Autopore IV 9510 instrument (Atlanta, GA, USA). Prior to analysis, the samples were dried in vacuum at 60 °C over night. Fourier transform-infrared spectrometric (FT-IR) analysis was performed on a Thermo Nicolet 670 instrument (Thermo, San Jose, CA, USA).Instrumental and analytical conditions
The HPLC profiles were recorded using a HPLC system (Shimadzu, Kyoto, Japan) with an LC-10AT pump and an SPD-10A UV detector. The analytical column was a Phenomenex (Torrance, CA, USA) Luna C18 column (150 × 4.6 mm, 5 μm). The optimized mobile phase was ACN: 0.10 mol L−1 sodium acetate buffer (37![[thin space (1/6-em)]](https://www.rsc.org/images/entities/char_2009.gif) :63 v/v, pH 4.5) and the flow-rate was maintained at 1.0 mL min−1. The UV detection was set at 254 nm. The injection volume was 20 μL.
:63 v/v, pH 4.5) and the flow-rate was maintained at 1.0 mL min−1. The UV detection was set at 254 nm. The injection volume was 20 μL.
A HPLC-ESI-MS system of LCMS-2010EV (Shimadzu, Kyoto, Japan) was used for identification of the antidepressants. The column was Shim-pack VP-ODS (Shimadzu, 150 × 2.0 mm i.d., 5 μm). Isocratic elution was carried out with a mobile phase, which was composed of ACN (containing 0.1% (v/v) formic acid) (31%) and 0.1% formic acid solution (69%), at a flow rate of 0.2 mL min−1. The column oven temperature was maintained at 30 °C and sample injection volume was 10 μL. Capillary voltage was 4.5 kV. Curved desolvation line (CDL) and heat block temperatures for the analysis were set at 250 and 200 °C, respectively. Drying and nebulizer gases of nitrogen were set at 1.5 L min−1 with a pressure of 0.02 MPa. The detector voltage was set at 1.4 eV. Selective ion monitoring (SIM) mode was adopted for quantitative determination of the analytes. The masses were monitored at m/z 372, 325, 319, 281, 278, 315 and 306 which correspond to the protonated molecular ions of trazodone, citalopram, fluvoxamine, imipramine, amitriptyline, clomipramine and sertraline (I. S.), respectively.
Sample preparation
Plasma samples were collected from drug-free healthy volunteers. They were centrifuged at 12000 rpm for 5 min to remove any precipitated materials. Antidepressants were directly spiked into the supernatant of the biological fluids. The plasma samples were diluted 5 times with phosphate buffer (0.005 mol L−1, pH 3.0) prior to extraction.
PMME procedure
The whole PMME procedures are composed of precondition, sample loading, washing and desorption.16 The poly(AMPS-co-DVB-co-EDMA) monolith with 3 cm length was adopted as the extraction medium for PMME. A laboratory syringe pump (Longer Precision Pump Co. Ltd., Baoding, China) was employed for the delivery of solvents and sample solutions. For precondition, the syringe was filled with 0.3 mL methanol, which was then ejected via the monolith at 0.06 mL min−1 by the syringe pump, and then 0.3 mL phosphate buffer (0.005 mol L−1, pH 3.0) was ejected at 0.06 mL min−1. After that, the sample solution was ejected at 0.06 mL min−1 in the same way. In order to eliminate the residual sample solution and the possible adsorbed sample matrices, 0.3 mL ACN-phosphate buffer (0.005 mol L−1, pH 3.0) mixture (1:4, v/v) was kept to flow through the monolith at 0.06 mL min−1. Then the residual solution in the pinhead and monolithic capillary tube was pushed out with an empty and clean syringe to avoid polluting the eluate. For desorption, 0.1 mL acetone containing 5% (v/v) ammonia was injected via the monolith at 0.06 mL min−1 and the eluate was collected into a vial. The desorption solution was evaporated to dryness under a gentle stream of nitrogen at 35 °C, and reconstituted with 0.05 mL mobile phase for the following HPLC analysis or HPLC-ESI-MS analysis.
Results and discussion
Preparation of poly(AMPS-co-DVB-co-EDMA) monolith
The sorbent type, porous structure and its interactions with the analytes are closely related to the effectiveness and efficiency of the extraction process.20 In the present study, the Poly(AMPS-co-DVB-co-EDMA) monolith combine a polar monomer (AMPS), which can provide ion-exchange interaction, and two crosslinking monomers (DVB and EDMA), which may help to increase the specific surface area and enhance hydrophobic interaction. The diffuse reflectance FT-IR spectra of the monoliths are shown in Fig. 2. It can be seen that the absorption spectra of the monoliths display readily identifiable peaks at 2970 and 2923 cm−1, which are characteristics of C–H symmetric and antisymmetric stretching vibrations. The peak of –C![[double bond, length as m-dash]](https://www.rsc.org/images/entities/char_e001.gif) O stretching vibration around 1729 cm−1, combining a strong and wide peak at 1164 cm−1, reveals the existence of –COOC–. Meanwhile, the out-of-plane bending vibration of –C–H at 800 and 706 cm−1 indicates the presence of aromatic rings in the prepared polymer monolith.
O stretching vibration around 1729 cm−1, combining a strong and wide peak at 1164 cm−1, reveals the existence of –COOC–. Meanwhile, the out-of-plane bending vibration of –C–H at 800 and 706 cm−1 indicates the presence of aromatic rings in the prepared polymer monolith.
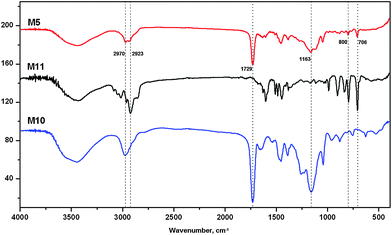 | ||
| Fig. 2 FT-IR characterization of the monoliths M5, M10 and M11. | ||
To be useful in PMME application, the permeability and surface area of the monolith should be controlled.36 Therefore, optimization of the preparation conditions of the monoliths is necessary. The effects of reactant ratios on permeability and surface area of the monolith were investigated in detail, with the results summarized in Table 1.
Fig. 3 shows the SEM images of these monoliths. As can be seen from Fig. 3-M1, without PEG porogen, the monolith has a compact continuous bed which was consisted of nano sized microglobules. The specific surface area of M1 was 440 m2 g−1 and the permeability was extremely poor. After adding 20 mg PEG-400 into the reactant, the specific surface area was decreased to 391 m2 g−1 and the calculated K of the resulting monolith increased from 3.196 × 10⁻¹² to 1.0527 × 10⁻¹¹ m2, as shown in Table 1. With an increase of PEG molecular weight in the polymerization mixture, the microglobules became bigger (Fig. 3-M3 and Fig. 3-M4) and the specific surface area decreased slowly, but the permeability of monoliths was still unsuitable for extraction. In such a case, the weight of PEG-2000 was investigated from 20 (M3) to 70 mg (M5) to understand its influence on the permeability of the monoliths. According to the SEM observation (Fig. 3-M3 and Fig. 3-M5), the size of the macropores increased as the PEG content increased, which improved the permeability of the monolith.
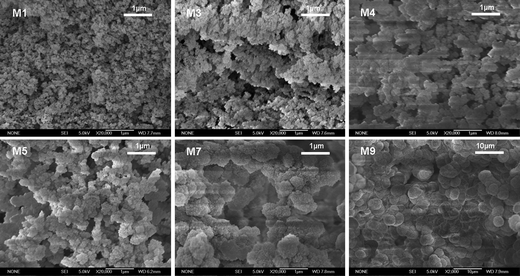 | ||
| Fig. 3 Scanning electron micrographs of the monoliths M1, M3, M4, M5, M8 (×20000) and M9 (×2000). | ||
In addition to PEG, the influence of the monomer ratios was also investigated. The results demonstrate that the ratio of DVB/EDMA affects the integrality of the monolith dramatically. For example, the monoliths M8, M10 and M11 were detached from the capillary walls, leading to a failure of the column preparation. Under some other conditions (M7 and M9), the monolith exhibited poor mechanical stability and the polymeric bed collapsed under pressure during the extraction process. As for M6, the ion-exchange site density of monomer AMPS was inadequate to achieve an acceptable extraction performance.
In all the prepared monoliths, M5 has the appropriate functional groups, large specific surface area, favorable permeability and well mechanical strength. Therefore, the reactant ratios of monolith M5 were chosen for the preparation of PMME medium in this study.
The microscopic morphology and pore size distributions of monolith M5 are shown in Fig. 4. It can be observed that the monolith is attached tightly to the inner wall of the capillary (Fig. 4a) and the macropores are interconnected with the polymer skeletons (Fig. 4b). Additionally, the monolith was characterized by a bimodal porous structure consisting of through-pores (macropores) and mesopores. As shown in Fig. 4c, the macropore diameter is around 2.0 μm, which is responsible for good permeability. Fig. 4d shows that mesopores with a wide size distribution in the range of 2–20 nm exist in the monolith.
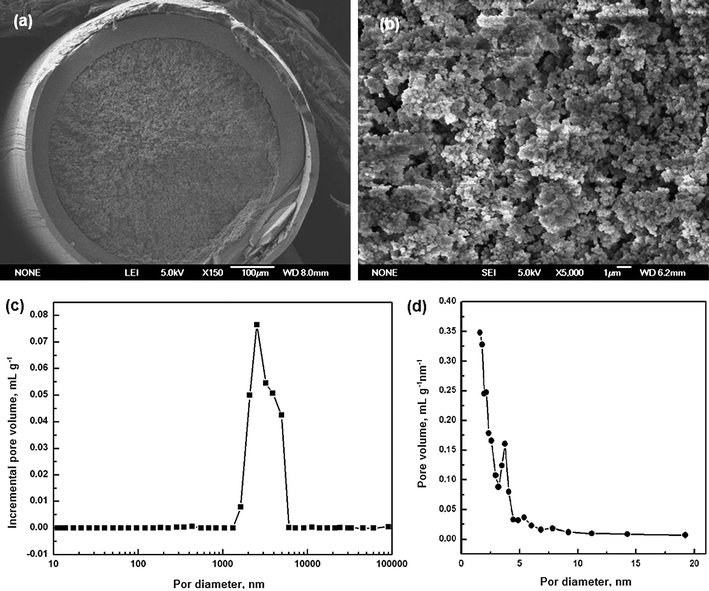 | ||
| Fig. 4 Scanning electron micrographs of the monolith M5 with magnifications at 150 (a) and 5000 (b). (c) Macropore size distribution profile and (d) mesopore size distribution of the monolith M5. | ||
Optimization of PMME conditions
The poly(AMPS-co-DVB-co-EDMA) monolith possesses sulfonate groups as well as DVB skeletons, which is expected to show strong cation exchange and hydrophobic interaction towards the analytes. To achieve the best extraction efficiency of this monolith toward the antidepressants, several parameters, including pH value, addition of salt and organic phase content, were investigated to optimize the extraction process.The pH values determine the charge status both of the analytes and of the stationary phase, which in turn affects the interaction between them. As shown in Fig. 5a, the extraction efficiency is highest at around pH 3.0. Under this condition, all antidepressants were present in their protonated forms, which may increase their ion-exchange interaction with the sulfonated groups on the monolith. Therefore, highest extraction performance was obtained. In view of this, pH 3.0 was selected for the subsequent analysis.
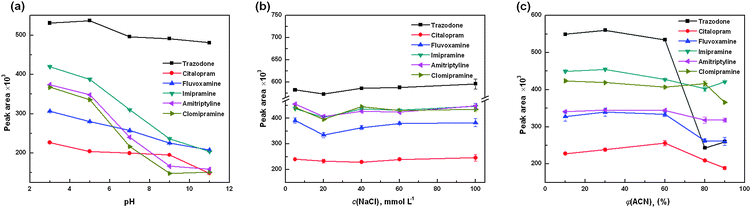 | ||
| Fig. 5 Effect of the (a) pH, (b) salt concentration and (c) acetonitrile content in the sample matrix on the extraction efficiency. Sample solution was consisted of six compounds spiked at 1.0 μg mL−1. | ||
The effect of salt addition on the extraction efficiency was also investigated. It is known that the addition of salt may decrease the ion-exchange interaction between the analytes and the monolith. As a result, the extraction efficiency should be decreased as the salt concentration increased. However, in the present study, the result indicates that the salt has little influence on the extraction of the analytes, as shown in Fig. 5b. Probably the ion-exchange interaction and hydrophobic interaction co-account for this phenomenon. Though the increase of the salt concentration decreased the ion-exchange interaction, it could enhance the hydrophobic interaction between the analytes and the monolith. As a result, the extraction was not markedly influenced by the salt addition. To simplify sample preparation as well as the extraction process, no sodium chloride was added in subsequent experiments.
As real samples are very complex, matrices may adsorb onto the monolith. In such a case, clean-up of the monolith is necessary before elution of the target analytes. Fig. 5c shows the influence of the organic solvent content on the extraction efficiency of the analytes. In the investigations, antidepressants were spiked at the 1 μg mL−1 level using a mixed solution of 0.005 mol L−1 phosphate solution (pH 3.0): ACN mixed in various ratios. For most analytes, the extraction efficiencies were almost constant when ACN ranged from 5–60%. Then they declined rapidly as the ACN content further increased. On the one hand, the increase of ACN content would swell the polymer monolith, which may expose many embedded interaction sites, leading to an increase in the extraction efficiency. On the other hand, the ACN can decrease the hydrophobic interaction between the analytes and the monolith. These two factors co-affected the retention of analytes on the monolith. To eliminate the possible matrices adsorption while keeping the analytes in situ, 20% of ACN was used to flush the monolith after extraction.
Moreover, the extraction volume profile was investigated by increasing the sample volume while keeping the flow rate constant at 0.06 mL min−1. The analytes were completely absorbed on the monolith and no breakthrough was observed even up to 4 mL of loaded samples (data was not shown). It demonstrates the monolith has good affinity for the analytes. Considering the sensitivity as well as saving the analysis time, 1 mL of sample volume was selected in the extraction.
The chromatograms of six antidepressants obtained by PMME/HPLC-UV and direct HPLC-UV analysis under the optimized conditions are shown in Fig. 6a and Fig. 6b, respectively. Apparently, after extraction, a significant peak height enhancement was observed, showing the remarkable preconcentration ability of the monolithic column.
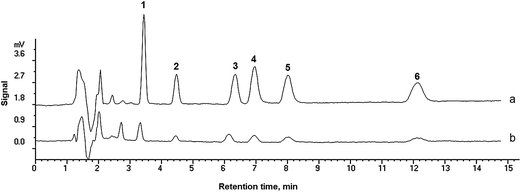 | ||
| Fig. 6 HPLC chromatograms of six antidepressants obtained by (a) PMME and (b) direct injection of the standard sample. Sample solution is consisted of six compounds spiked at 1.0 μg mL−1. The injection volume was 20 μL. Extraction volume was 0.3 mL. Peaks: 1. trazodone, 2. citalopram, 3. fluvoxamine, 4. imipramine, 5. amitriptyline, 6. clomipramine. | ||
Reproducibility of preparation for monolith
The reproducibility of monolith preparation is a significant factor that influences the effectiveness and practicability of the method. Under the above-optimized conditions, the column-to-column reproducibility was evaluated by calculating the RSD of the extracted amount while performing extraction of six antidepressants from standard samples. The results (Table 2) showed that the intra- and inter-batch RSDs were in the range of 2.0–8.8% (n = 4) and 5.5–11.9% (n = 4), respectively. In addition, the monolith showed high stability and could be reused after being washed with 0.3 mL methanol. No significant changes were found in its back pressure and extraction efficiency after more than 50 times of standard sample extractions.| Compound | Intra-batch RSD (%, N = 4) | Inter-batch RSD (%, N = 4) |
|---|---|---|
| a The compounds were spiked at 1 μg mL−1 in 0.005 mol L−1 phosphate solutions (pH 3.0). The extraction volume was 0.3 mL. | ||
| Trazodone | 2.0 | 5.5 |
| Citalopram | 6.6 | 8.1 |
| Fluvoxamine | 8.8 | 9.0 |
| Imipramine | 2.3 | 8.5 |
| Amitriptyline | 5.5 | 11.9 |
| Clomipramine | 4.5 | 11.8 |
Analysis of antidepressants in human plasma
Under the optimized PMME conditions, the method was applied for the determination of six antidepressants in plasma samples. HPLC-ESI-MS system was used to quantify these antidepressants. Fig. 7 shows the selected ion monitoring (SIM) chromatograms obtained by PMME/HPLC-ESI-MS of the plasma sample with six antidepressants spiked at 10 ng mL−1. No interferences from the matrix were observed. The results suggested that this method, which integrated sample clean up and enrichment, is practical for sensitive analysis of antidepressants in plasma samples.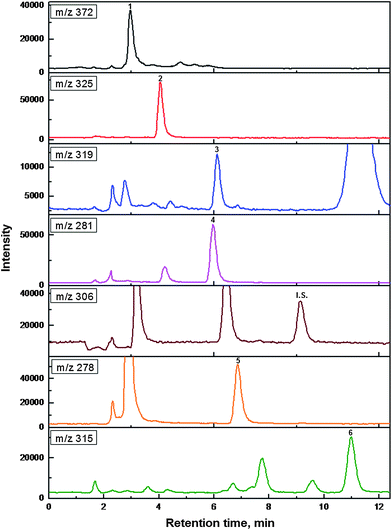 | ||
| Fig. 7 The selected ion monitoring (SIM) chromatograms of six antidepressants obtained by PMME/HPLC-ESI-MS from spiked plasma sample. The analytes were spiked at 10 μg mL−1. The injection volume was 10 μL. Extraction volume was 1 mL. Peaks: 1. trazodone, 2. citalopram, 3. fluvoxamine, 4. imipramine, 5. amitriptyline, 6. clomipramine, I.S. sertraline. | ||
The matrix effect on PMME was examined by relative extraction efficiency calculated by comparing the peak area ratios of analytes and IS (10 ng mL−1 sertraline) from the spiked plasma samples to those obtained from the standard solutions. Except for fluvoxamine, and clomipramine, relative extraction efficiencies of the other antidepressants were a little low (ranging from 64 to 87%). Obviously, the plasma matrices may affect the interaction between analytes and the monolith, which results in low extraction efficiency. Therefore, method validation was performed in plasma samples in subsequent experiments.
Limit of Detection (LOD), limit of quantification (LOQ) and calibration curve
The linear regression analyses were performed using peak areas ratios (anitdepressants/I.S.) against the respective analytes concentrations. The linear regression and the LODs data are listed in Table 3. The LODs (calculated at a signal-to-noise of 3) and LOQs (calculated at a signal-to-noise of 10) for six antidepressants were found to be 0.06–0.39 ng mL−1 and 0.20–1.31 ng mL−1, respectively. It is noteworthy that the LODs and LOQs were much lower than those reported in our previous works, in which poly(MAA-co-EDMA)37 and poly(N-isopropylacrylamide-co-ethylene dimethacrylate) monolith17 were used for the extraction of the antidepressants. In those two monoliths, only ion exchange or hydrophobic interaction is predominant for the extraction. However, in the present study, dual interactions exist and contribute to the extraction. As a result, a high extraction performance was achieved. It demonstrates the superior of the newly developed polymer monolith for PMME application.| Compound | Concentration rang/ng mL−1 | Regression line | LOD/ng mL−1 | LOQ/ng mL−1 | ||
|---|---|---|---|---|---|---|
| Slope | Intercept | R2 value | ||||
| Trazodone | 0.5–250 | 0.1795 ± 0.0053 | 0.1934 ± 0.5121 | 0.9880 | 0.12 | 0.41 |
| Citalopram | 0.5–250 | 0.2172 ± 0.0053 | 0.3638 ± 0.5160 | 0.9917 | 0.14 | 0.46 |
| Fluvoxamine | 5–250 | 0.0393 ± 0.0012 | 0.0872 ± 0.1390 | 0.9901 | 0.39 | 1.31 |
| Imipramine | 0.5–250 | 0.1693 ± 0.0024 | 0.3318 ± 0.2323 | 0.9972 | 0.06 | 0.20 |
| Amitriptyline | 0.5–250 | 0.1829 ± 0.0008 | −0.0045 ± 0.0731 | 0.9998 | 0.10 | 0.33 |
| Clomipramine | 1–250 | 0.1621 ± 0.0020 | 0.0481 ± 0.2091 | 0.9982 | 0.18 | 0.59 |
Precision and recovery
The precision was established by repeating analysis of samples with different concentrations. Excellent method repeatability was found by intra- and inter-day precisions, yielding the RSDs less than 6.1% and 9.8%, respectively (the data were listed in Table 4). Furthermore, satisfactory recoveries (relative to spiked standard samples) of the spiked analytes from plasma samples were achieved. They were in the range of 73.2–110.8%. These results clearly demonstrate that the PMME/LC-ESI-MS method for determination of antidepressants in plasma samples is suitable and reliable.| Compound | Intraday RSD (%, N = 5) | Interday RSD (%, N = 4) | Recovery (%, N = 4) | ||||||
|---|---|---|---|---|---|---|---|---|---|
| 1 (ng mL−1) | 10 (ng mL−1) | 100 (ng mL−1) | 1 (ng mL−1) | 10 (ng mL−1) | 100 (ng mL−1) | 1 (ng mL−1) | 10 (ng mL−1) | 100 (ng mL−1) | |
| Trazodone | 5.5 | 6.1 | 3.3 | 7.4 | 5.8 | 6.7 | 103.9 | 100.5 | 100.9 |
| Citalopram | 5.5 | 2.7 | 4.0 | 4.0 | 5.9 | 6.1 | 93.5 | 96.5 | 93.2 |
| Fluvoxamine | — | 5.8 | 5.1 | — | 8.9 | 9.8 | — | 104.0 | 99.2 |
| Imipramine | 3.3 | 4.7 | 5.2 | 5.3 | 3.1 | 3.2 | 73.2 | 91.9 | 93.4 |
| Amitriptyline | 4.6 | 3.6 | 3.2 | 5.2 | 2.7 | 7.0 | 107.9 | 104.8 | 100.8 |
| Clomipramine | 4.2 | 1.0 | 4.5 | 6.5 | 7.0 | 3.6 | 110.8 | 100.9 | 105.2 |
Conclusion
A hydrophobic/cation-exchange polymer monolith was prepared via one-step thermally initiated polymerization of 2-acrylamido-2-methyl-1-propanesulfonic acid (AMPS), divinylbenzene (DVB) and diethylene glycol dimethacrylate (EDMA) in a capillary. The presence of DVB and EDMA as the binary crosslinkers helps to increase the specific surface area and enhance hydrophobic property of the monolith. In addition, the sulfonic groups of the AMPS provide strong cation-exchange sites for analytes. The monolith exhibits good extraction performance towards antidepressants in complex plasma samples. Under the optimized extraction condition, the limits of detection were as low as in the ng mL−1 range. Good linearity and repeatability were also achieved. In general, this study demonstrates that the monolith with dual functional groups is ideal extraction medium for concentrating and isolating these analytes from complex biological samples.Acknowledgements
This work was supported by grants from the National Science Fund for Distinguished Young Scholars (no. 20625516), the National Key Technologies R&D Program (2006BAF07B03), and the Science Fund for Creative Research Groups (no. 20921062), NSFC.References
- A. Esrafili, Y. Yamini and S. Shariati, Anal. Chim. Acta, 2007, 604, 127–133 CrossRef CAS.
- A. de Castro, M. Concheiro, O. Quintela, A. Cruz and M. Lopez-Rivadulla, J. Pharm. Biomed. Anal., 2008, 48, 183–193 CrossRef CAS.
- A. Bakkali, E. Corta, J. I. Ciria, L. A. Berrueta, B. Gallo and F. Vicente, Talanta, 1999, 49, 773–783 CrossRef CAS.
- M. B. Joseph Wang and Cloud Morgan, Anal. Chem., 1986, 58, 1024–1028 CrossRef CAS.
- M. S. Garcia, J. Ortuno, M. I. Albero and M. Cuartero, Anal. Bioanal. Chem., 2009, 394, 1563–1567 CrossRef CAS.
- B. J. G. Silva, F. M. Lancas and M. E. C. Queiroz, J. Chromatogr., B: Anal. Technol. Biomed. Life Sci., 2008, 862, 181–188 CrossRef CAS.
- S. M. R. Wille, K. E. Maudens, C. H. Van Peteghem and W. E. E. Lambert, J. Chromatogr., A, 2005, 1098, 19–29 CrossRef CAS.
- D. S. Jain, M. Sanyal, G. Subbaiah, U. C. Pande and P. Shrivastav, J. Chromatogr., B: Anal. Technol. Biomed. Life Sci., 2005, 829, 69–74 CrossRef CAS.
- F. Busetti, K. L. Linge and A. Heitz, J. Chromatogr., A, 2009, 1216, 5807–5818 CrossRef CAS.
- V. F. Samanidou, M. K. Nika and I. N. Papadoyannis, J. Sep. Sci., 2007, 30, 2391–2400 CrossRef CAS.
- R. Mandrioli, L. Mercolini, N. Ghedini, C. Bartoletti, S. Fanali and M. A. Raggi, Anal. Chim. Acta, 2006, 556, 281–288 CrossRef CAS.
- A. R. Chaves, G. Chiericato and M. E. C. Queiroz, J. Chromatogr., B: Anal. Technol. Biomed. Life Sci., 2009, 877, 587–593 CrossRef.
- C. Alves, A. J. Santos-Neto, C. Fernandes, J. C. Rodrigues and F. M. Lancas, J. Mass Spectrom., 2007, 42, 1342–1347 CrossRef CAS.
- L. R. Melo, A. M. Nogueira, F. M. Lancas and M. E. C. Queiroz, Anal. Chim. Acta, 2009, 633, 57–64 CrossRef CAS.
- A. R. Chaves, S. M. Silva, R. H. C. Queiroz, F. M. Lancas and M. E. C. Queiroz, J. Chromatogr., B: Anal. Technol. Biomed. Life Sci., 2007, 850, 295–302 CrossRef CAS.
- M. Zhang, F. Wei, Y. F. Zhang, J. Nie and Y. Q. Feng, J. Chromatogr., A, 2006, 1102, 294–301 CrossRef CAS.
- Q. Ma, M. Chen, Z. G. Shi and Y. Q. Feng, J. Sep. Sci., 2009, 32, 2592–2600 CrossRef CAS.
- Y. Fan, Y. Q. Feng, S. L. Da and Z. G. Shi, Anal. Chim. Acta, 2004, 523, 251–258 CAS.
- S. F. Xie, F. Svec and J. M. J. Frechet, Chem. Mater., 1998, 10, 4072–4078 CrossRef CAS.
- N. Fontanals, R. M. Marce and F. Borrull, J. Chromatogr., A, 2007, 1152, 14–31 CrossRef CAS.
- F. Wei, M. Zhang and Y. Q. Feng, Electrophoresis, 2006, 27, 1939–1948 CrossRef CAS.
- H. J. Zhang, J. F. Huang, H. Wang and Y. Q. Feng, Anal. Chim. Acta, 2006, 565, 129–135 CrossRef CAS.
- J. F. Huang, H. J. Zhang and Y. Q. Feng, J. Agric. Food Chem., 2006, 54, 9279–9286 CrossRef CAS.
- H. J. Zhang, J. S. Li, H. Wang and Y. Q. Feng, Anal. Bioanal. Chem., 2006, 386, 2035–2042 CrossRef CAS.
- M. Chen, Y. Lu, Q. Ma, L. Guo and Y. Q. Feng, Analyst, 2009, 134, 2158–2164 RSC.
- Y. Wen and Y. Q. Feng, J. Chromatogr., A, 2007, 1160, 90–98 CrossRef CAS.
- Y. Wen, Y. Wang and Y. Q. Feng, Anal. Bioanal. Chem., 2007, 388, 1779–1787 CrossRef CAS.
- Z. Jiang, N. W. Smith, P. D. Ferguson and M. R. Taylor, J. Sep. Sci., 2008, 31, 2774–2783 CrossRef CAS.
- M. Q. Zhang and Z. El Rassi, Electrophoresis, 2001, 22, 2593–2599 CrossRef CAS.
- J. K. Adu, S. S. Lau, D. G. Watson, M. R. Euerby, G. G. Skellern and J. N. A. Tettey, Electrophoresis, 2005, 26, 3445–3451 CrossRef CAS.
- J. Dong, J. J. Ou, X. L. Dong, R. N. Wu, M. L. Yel and H. F. Zou, J. Sep. Sci., 2007, 30, 2986–2992 CrossRef CAS.
- X. C. Wang, H. X. Lu, X. C. Lin and Z. H. Xie, J. Chromatogr., A, 2008, 1190, 365–371 CrossRef CAS.
- J. Lin, G. H. Huang, X. C. Lin and Z. H. Xie, Electrophoresis, 2008, 29, 4055–4065 CrossRef CAS.
- R. Wu, H. Zou, H. Fu, W. Jin and M. Ye, Electrophoresis, 2002, 23, 1239–1245 CrossRef CAS.
- J. Courtois, E. Bystrom and K. Irgum, Polymer, 2006, 47, 2603–2611 CrossRef CAS.
- Z. J. Jiang, N. W. Smith, P. D. Ferguson and M. R. Taylor, Anal. Chem., 2007, 79, 1243–1250 CrossRef CAS.
- F. Wei, J. Fan, M. M. Zheng and Y. Q. Feng, Electrophoresis, 2010, 31, 714–723 CrossRef CAS.
| This journal is © The Royal Society of Chemistry 2010 |