TiO2 nano- and micro-particles in commercial foundation creams: Field Flow-Fractionation techniques together with ICP-AES and SQW Voltammetry for their characterization†
Catia
Contado
* and
Antonella
Pagnoni
Department of Chemistry, University of Ferrara, Via Luigi Borsari 46, I-44100, Ferrara, I. E-mail: Catia.Contado@unife.it; Fax: +39 0532 240709; Tel: +39 0532 455149
First published on 10th June 2010
Abstract
A procedure to determine the presence of nano- or micro- TiO2 particles in commercial cosmetic formulations, which may have a daily use, is proposed. Two identification techniques the Square Wave Voltammetry (SWV) and ICP-AES were employed to determine the amount of TiO2 in six foundation creams sold in Italy and the USA. A new SWV method, based on an acidic microwave-assisted digestion of the sample, has been set up and the results were compared and critically commented with those obtained by the established ICP-AES method. The analytical procedure was verified by analyzing the P-25 Degussa sample. The sizes of the particles contained in the foundations were investigated through Sedimentation (SdFFF) and Flow Field-Flow Fractionation (FlFFF) by analyzing aqueous slurries obtained from the foundation through a solvent extraction procedure. The FFF techniques synergically coupled with the ICP-AES made it possible to assess the sizes of the TiO2 particles. The content of the extracted slurries was also checked by TEM observation.
Introduction
Many ordinary cosmetics are now based on mineral nanoparticles and nano-emulsions, in which the particles or the droplets may be as small as 10 nm and because of this small size lend particular rheological properties to the final product. Since their first use, benefits of nanotechnology have been widely publicized, but the discussion of the potential effects on their widespread use in consumer and industrial products are just emerging. In the last decade, the number of scientific publications on possible adverse effects of nanoparticles (NP) on humans, animals or more generally on the environment is increasing, but the knowledge of any problems NP may cause once inside of human body is still limited.1–3A cosmetic product is declared suitable for the market if its safety is assessed, however, regulatory authorities have different positions regarding safety assessments of cosmetics: the FDA looks at the safety of final products, while in Europe, safety assessment is mainly ingredient-based. Moreover, while for chemical ingredients, the toxicity has been studied and according to it a list of not allowed substances is included in the updated directive 76/768/EEC,4 for nanoparticles and nanomaterials the set of rules are full of gaps. From a regulatory perspective, ideally a nanomaterial in cosmetics should be size characterized as it appears in the final formulation used by the consumer. Unfortunately, with the existing methodologies it is very difficult to get physico-chemical information about the nanomaterial in the final products, so that each ingredient is characterized and tested separately and its worst possible effect on human health is used to assess its safety. In this time of uncertainty, the need of analytical methods to be able to detect and monitor the presence of micro- or nano-sized particles contained in commercial products, is a mandatory request, not only to assess the quality of the ingredients but also to establish the safety of the finished products, particularly for stay-on cosmetic products, which are subjected to close, direct and prolonged contact with the skin and/or permeable mucous membranes (level of exposure).
TiO2 particles represent the most significant example: initially declared safe by the Scientific Committee for Consumer Products (SCCP), so that TiO2 is currently the only nano-material allowed in Europe as a UV filter up to 25%,5 it is now under re-evaluation6 because of new scientific data on nano sized particles. Moreover, TiO2 is not used only as an inorganic sunscreen UV filter, it is used for whitening and as an anti-bacterial in toothpaste, as an inorganic component in stay-on cosmetics, to make pearl pigments, for high quality eye and face make-ups, lipsticks, nail lacquers, and it is an important component also in pharmaceuticals, as coloring agent for capsules, films, tablets and coated pills as well as medical sticky tapes.7,8
In this work two identification techniques, Square Wave Voltammetry (SWV) and ICP-AES, were used to detect the presence of TiO2 inside of six commercial foundation creams widely available on the market, while the Sedimentation and the Flow Field-Flow Fractionation techniques9 (SdFFF and FlFFF respectively) were employed to separate and size the nano- and micro-particles contained in the cosmetic formulations.
The novelties of this study lies in the set-up of an analytical method for the SWV at the hanging mercury drop electrode (HMDE) as an alternative identification technique to ICP-AES to quantify the TiO2 content in a complex matrix such as a foundation cream, and the sample type—foundation—which has never taken into consideration before as possible application for the FFF separation techniques, which provide very powerful size-selective sorting methods. To date, only few examples of SdFFF separations of TiO2 microparticles are reported in literature,10–13 and only two applications of FlFFF on TiO2 NPs are available.14,15
To gather good information on the size of a material contained in a complex matrix is not trivial, and often a combination of different techniques is needed to get a thorough understanding of the properties of a material. At present among the most consolidated sizing methods, there are the laser-based techniques such as Dynamic Light Scattering (DLS) and Photon Correlation Spectroscopy (PCS);16 the X-Ray Diffraction (XRD) and X-Ray Disc Centrifugation; transmission electron microscopy (TEM) and atomic force microscopy (AFM) to make measurements also in wet conditions; gravimetric measurements and scanning mobility particle sizing (SMPS)17 to assess the aggregation of the particles; and finally size exclusion chromatography (SEC), which allows the particles to be suspended in their natural solvent, but whose results unfortunately may be influenced by electrostatic or hydrophilic–hydrophobic interactions with the gel matrix used as stationary phase. All these methods provide very different particle size results, without any of those results being better or “more correct” than others.
In this work, the results achievable by the two identification methods were first tested and critically compared by analyzing the mineralized TiO2 aeroxide (Degussa P-25), taken as standard sample; then the amount of TiO2 present inside the foundations was determined on mineralized samples. The apparent disadvantage of voltammetric determinations is the necessary acidic digestion of the foundations, since the Ti is detected through the reduction of Ti4+ ion to Ti3+, but the longer time required by this method is widely overcome by the much lower cost of the analysis to achieve the same information. On the other hand, the ICP-AES was used and chosen in spite of its very high costs of exercise since it gives very rapid multi-elemental data, as attested by previous FFF applications in which the ICP-AES was used as detector18–20even if the most common FFF-ICP on-line coupling is done with mass spectrometer (MS) detector.21–23
From an analytical point of view, it is noteworthy that the extraction of the nano- and micro-particles from the commercial formulation is by keeping them in the wet state as they are, without altering too drastically the organic coating layer that sometimes they might have. A solvent extraction procedure was applied to the foundations to isolate the mineral particles; the aqueous phases concentrated were analyzed either by ICP-AES and SWV and sorted by SdFFF and the FlFFF in order to get the particle size distributions of the samples, sizes which were compared with TEM results. The FFF elution profiles were always recorded with an UV detector, and in almost all cases they were verified by monitoring off-line the eluted Ti concentration by ICP-AES.
Experimental
Materials
Monodispersed polystyrene nanosphere latex standard with nominal diameters of 96 nm and 194 nm were obtained (PPs-0.1 and PPs-0.2, G.Kisker GbR Produkte f.d.Biotechnologie, Steinfurt, Germany). The 2.5% w/v commercial suspensions were diluted in the carrier solutions prior their use for the FlFFF and SdFFF calibration. Aeroxide TiO2 Degussa P-25 powder (Degussa, Frankfurt am Main, Germany), hereafter indicated as P-25, of declared purity 99.5% based on ignited material; assumed average density 4.05 g mL−1. Commercial foundations were purchased in different shops in Italy and USA (for details see Table S1, ESI†). FL-70 anionic surfactant (oleic acid, sodium carbonate, tergitol, tetrasodium EDTA, polyethylene glycol and triethanolamine)24 (# SF105-1, Fisher Scientific, Fair Lawn, NJ, USA) was used to prepare the mobile phase solutions: 0.01% v/v for the FlFFF and 0.1% v/v for the SdFFF. Hydrofluoric HF (39.5%), nitric HNO3 (65%) acids were Suprapur grade reagents (Carlo Erba, Milan, Italy); they were used for the acidic digestions of the samples. Oxalic C2O4H2·H2O and boric H3BO3 acids (Carlo Erba,, Milan, Italy) were used for the SWV analyses. Methanol CH3OH and hexane C6H14 (Carlo Erba,, Milan, Italy) were used to extract the TiO2 particles from the foundation samples. Ti, Fe, Zn, Cu and Bi elemental standard solution 1000 mg L−1 (Merk, Darmstadt, Germany) were used to make the ICP-AES standard solutions. Ultrapure deionized (18 MΩ-cm) water (Milli-Q system, Waters Corp., Milford, MA, USA) was used to prepare all the solutions and suspensions.FlFFF system
The FlFFF was a Model F-1000 symmetric FlFFF channel (Postnova Analytics, Salt Lake City, UT, USA). The channel was formed of a 0.0254 cm thick Mylar spacer, length 29.5 cm (tip-to-tip) and breadth 2 cm. Nadir regenerated cellulose (RC) membrane with a nominal cut-off of 30 kDa (UC030 T) was kindly donated by Microdyn-Nadir GmbH (Wiesbaden, Germany). The geometrical channel void volume was calculated to be 1.41 ± 0.03 cm3. Due to the inlet and outlet connections to the injection valve and detector, the extra column volume was estimated at 0.265 cm3. Carrier liquid was delivered to the channel using a P680A dual gradient pump (Dionex Corp., Sunnyvale, CA, USA), which was able to independently generate both the longitudinal and cross flows. A 20 μL injection loop, mounted on a Rheodyne 7725i sample valve (Rheodyne LLC, Rohnert Park, CA, USA) was used for injecting the PS standard samples, while a 50 μL loop was used for the foundation aqueous extracted suspensions. The outlet tube from the channel was connected to the UV detector Spectra Series UV 100 (Thermo Separation Products, USA) with wavelength set at 254 nm. The UV signal was collected by a DI-154RS acquisition card (DATAQ Instruments, Akron, OH, USA) and stored using the dedicated software on a PC-compatible computer. The fractograms were converted to particle size distributions (PSDs) using a software developed in 1990 at the FFF Research Center (FFFRC) (University of Utah, Salt Lake City, UT, USA).SdFFF equipment
Sedimentation FFF system Model S-101 particles/colloid fractionator (Postnova Analytics, Landsberg/Lech, Germany) was employed; its channel had nominal dimensions of 89.5 cm in length, 2 cm in breadth and 0.0254 cm in thickness (w). The channel walls were made of hastelloy C with highly polished surfaces. The radius r was 15.1 cm. The computed void volume V0 was 4.30 ± 0.12 mL, which was equivalent to the geometrical value of 4.34 mL declared by the manufacturer. The extra-channel contribution to retention time, computed as the ratio of the extra-channel geometric volume (0.24 mL) and the carrier flow rate, was taken into account. The samples were injected through a 50 μL Rheodyne loop. A HPLC Pump PN1121 (Postnova Analytics) was used to generate the flow into the channel; the actual flow was determined by monitoring the effluent volume as a function of time. The carrier solution was Fl-70 0.1% v/v, pH ∼10.00. The flow-rate was set at Q = 2.00 mL min−1 but it was measured during each run. The eluted samples were detected by an UV detector Spectra Series UV 100 (Thermo Separation Products, USA) with wavelength fixed at 254 nm. The rotations per minute set to perform the fractionations, together with the correspondent generated fields, are reported in Table S2, ESI.† After injection, the carrier was usually stopped for 10 min (relaxation period) to allow the sample to equilibrate under the applied field. The SdFFF instrument was controlled by SPIN 1409 which acquired also the fractrograms; the registered data were processed by FFF ANALYSIS; both were Windows compatible programs provided by Postnova Analytics (Germany) together with the instrument.ICP-AES system
ICP-AES metal determinations were carried out on a Perkin-Elmer Optima 3100 XL Inductively Coupled Plasma-Atomic Emission Spectrometer equipped with an axial torch, segmented array charge coupled device (SCD) detector and Babington-type nebulizer with cyclonic spray chamber for sample introduction. The experimental conditions are listed in Table S3, ESI.† Elemental standard solutions were employed to prepare diluted standard solutions to ICP-AES optimization. Depending on the sample concentration, the calibration curve ranges have foreseen a linear or a quadratic regression,25,26 from which detection limits LD, spanning between 15 and 95 μg L−1, were evaluated. The selected wavelengths for Ti were 334.940 nm, 336.121 nm and 337.279 nm; for Fe were 238.204 nm, 239.562 nm and 259.939 nm.SWV equipment
Voltammetric measurements were carried out with an AMEL Model 433 (Milan, Italy), employing a conventional three-electrode cell: a hanging mercury electrode (HMDE) as working electrode, an Ag/AgCl, KCl saturated electrode and a platinum wire as reference and auxiliary electrode, respectively. The solutions were deaerated with pure nitrogen for 10 min before measurements and for 30 s after each standard addition. Data handling was controlled by a host computer using Amel software.Other instruments
Vortex-Genie 2 mixer and Bandelin Sonorex Digital 10 P Ultrasonic baths were purchased from Sigma-Aldrich (Italy) and used to disperse the particle suspensions before injection into the sample loop. Microson ultrasonic cell disruptor (Model XL2000, Misonix, Farmingdale, NY) with a 0.48 cm diameter microtip probe, operated at 50% power (10 W) was used to disperse the foundation cream during the solvent extraction procedure. An Ethos 900 Microwave sample preparation system (Milestone, USA) equipped with a 6 vessels rotor model HPR1000/6M was employed to mineralise all samples. Samples were placed in high pressure TFM vessel. A Perkin-Elmer Analyst 800 GF-AAS analyzer, equipped with a pyrolytically coated graphite tube with integrated platform with Zeeman background correction was used to quantify the Cu. A transmission electron microscope (TEM) (Hitachi H-800) was used to evaluate both size and morphology of the nano- and micro-particles. Usually, a drop of aqueous sample suspension was deposed on a cupper grid (mesh 150) and let to dry in an oven at 40 °C prior of its use.Results and discussion
Accuracy and precision of the voltammetric determinations: mineralized TiO2 Aeroxide Degussa P-25 powder
Six independent portions of TiO2 Aeroxide Degussa P-25 powder, considered here as a reference material because of its purity, were sampled, accurately weighted (Table 1) and mineralized according Method 1, ESI.† Each mineralized portion, diluted of a factor of 100, was analyzed in triplicate either by SWV and ICP-AES, for a total of 18 determinations for each method.The detection limits for the SWV method, computed according to27–29 as LD = Ksy/x/b, where sy/x and b are the estimated deviation and the slope of the analytical calibration function respectively, with a 98% (K = 3) confidence level, were in average of 160 μg L−1. An example of a series of square wave voltammograms for the reduction of Ti4+/Ti3+ is reported in Fig. S2 a), ESI.†
The TiO2% w/w mean values computed by the three analyses made on each portion are reported in Table 1 (columns 2–7), while in the last column the average and its standard deviation for each method is reported. The two average TiO2 percentage values are almost identical (97.9 ± 2.8 vs. 98.2 ± 2.2 TiO2% w/w) and the methods can be considered equivalent on the basis of the “t” test, applied at the 95% confidence level. The variances of the methods were pooled, but in general, the precision of the SWV determinations was lower than the correspondent value computed for the ICP-AES, this is because the ICP-AES instrument makes it possible to perform several readings on the same solution, while with the SWV each measurement derives from a completely independent analysis. In fact, the numerical result is obtained only after having added the standards to the portion of sample solution placed in the cell, which will not be further analyzed; furthermore the cell must be cleaned thoroughly and the electrode washed for each measurement.
The TiO2 percentage obtained from SWV and ICP-AES were also compared with the 99.5 TiO2% w/w declared by the manufacturer, and the “t” test assessed that the two results were in agreement and statistically equivalent at the 95% confidence level with the given purity.
TiO2 determination: SWV and ICP-AES methods applied to mineralized foundation
In order to prove that the SWV method gives reliable and accurate results also on a complex matrix such as that of a foundation cream, the same procedure applied to the P-25 was applied to Sample #1, which is produced and commercialized in USA and to Sample #2, belonging to the same brand, but produced and commercialized in Europe (Italy). Sample #1 was the only sample among those considered in this study in which TiO2 was listed among the ingredients as well as “possible present”.Six portions of cream were accurately weighed and mineralized according Method 2, ESI† and each mineralized portion was analyzed in triplicate either by SWV and by ICP-AES; the results are reported in Table 2. SWV determinations were made by diluting the mineralized solutions with the supporting electrolyte solution (H2C2O4 0.25 M + H3BO3 0.20 M) of a factor of 100. The detection limits LD of the SWV method, computed as above reported, were in this case higher than before and spanning between 76 and 315 μg L−1. An example of voltammograms for this sample is reported in Fig. S2 b), ESI.†Before computing the average for each method, the ANOVA was applied to the six sets of data. The TiO2 content determined in Sample #1 by SWV was 9. 7% w/w. The ICP-AES method gave usually higher values of TiO2% w/w—0.8% w/w the whole average—with a lower variability inter portions (higher precision) respect to the SWV technique (sICP-AES = ± 0.2 vs.sSQWV = ± 1.3).
| Sample #1 | |||||||
| Portion 1 | Portion 2 | Portion 3 | Portion 4 | Portion 5 | Portion 6 | % w/w Av ± sd | |
| Amount of foundation/g | 0.1412 | 0.1421 | 0.1107 | 0.1134 | 0.1365 | 0.1263 | |
| SWV (% w/w) | 11.8 | 9.9 | 9.4 | 8.3 | 10.3 | 8.2 | 9. 7 ± 1. 3 |
| ICP-AES (% w/w) | 10.9 | 10.9 | 11.1 | 11.0 | 10.4 | 10.7 | 10.8 ± 0.2 |
| Sample #2 | |||||||
| Portion 1 | Portion 2 | Portion 3 | Portion 4 | Portion 5 | Portion 6 | % w/w Av ± sd | |
| Amount of foundation/g | 0.1253 | 0.1209 | 0.1270 | 0.1085 | 0.1336 | 0.1339 | |
| SWV (% w/w) | 7.7 | 7.7 | 8.8 | 8.1 | 8.4 | 7.8 | 8.1 ± 0.4 |
| ICP-AES (% w/w) | 7.9 | 8.1 | 8.1 | 8.1 | 7.9 | 8.0 | 8.0 ± 0.1 |
An analogous study was performed on Sample #2, for which the TiO2% w/w content was estimated being of 8.1 by SWV, with detection limits LD in the same range of Sample #1, and 8.0 by ICP-AES; the ICP-AES gave also for this sample more precise values (sSQWV = ± 0.4 vs.sICP-AES = ± 0.1).
The application of the “t” test to the both samples assessed at the 95% confidence level that the two methods gave also for the mineralized foundation statistically equivalent results even if in this case the variance of the two methods could not be combined.
TiO2 content in the six foundations
The six foundations chosen for this study were light beige in order to reduce the possible interference of other inorganic pigments, such as iron oxide in all its forms (CI 77491 red, CI 77492 yellow, CI 77499 black); Samples #1 and #4 had a SPF of 15 and 18 respectively.To shorten the analysis time, only three independent portions were collected as described in “Foundation sampling method”, ESI †for all samples but Sample #2; the portions were mineralized according Method 2, ESI† and the resulting solutions were perfectly clear and transparent, except those obtained by Samples #4 and #6 which were transparent but yellow colored (see Fig. S3, ESI†).
SWV determinations were made in triplicate, by diluting the mineralized solutions with the supporting electrolyte solution (H2C2O4 0.25 M + H3BO3 0.20 M) by a factor of 10 or 100, depending on the sample. The SWV detection limits LD in some cases increased up to ∼1 mg L−1. The highest content of TiO2 (∼10.8% w/w) was confirmed for Sample #1, while Sample #6 had the lowest (∼5.2% w/w), closely followed by Sample #4 (∼5.5% w/w). (see Table 3). These unexpectedly low values were caused by the interfering action played by Cu2+, whose peak potential is Ep = −100 mV; the perturbation in the baseline due to the Cu2+ peak introduced a bias, which affected the Ti determinations; the Cu2+ determination done on Sample #6 assessed a copper contamination of about 1.7 mg L−1, even if further experiments should be carried out to establish the origin of such an ion in these two samples. Examples of voltammograms registered for Sample #6 can be seen in Fig. S4a) and S4b) in the ESI.†
| Sample | #1 | #2 | #3 | #4 ab | #5 | #6 ab |
|---|---|---|---|---|---|---|
| a Probably presence of interfering elements, such as Pb2+ (ultra-trace) on the right and Cu2+ (trace) on the left of the SWV Ti4+ peak. b mineralized solution clear but yellow. | ||||||
| Amount of foundation/g | 0.1119 | See Table 2 | 0.1114 | 0.1778 | 0.1187 | 0.1549 |
| 0.1039 | 0.1295 | 0.1162 | 0.1028 | 0.1439 | ||
| 0.1303 | 0.1145 | 0.1606 | 0.1730 | 0.1535 | ||
| SWV | ||||||
| TiO2 Average (% w/w) | 10.8 | 8.1 | 9.1 | 5.5 (a) | 6.7 | 5.2 |
| Sd (% w/w) | 0.3 | 0.4 | 0.4 | 0.6 | 0.3 | 0.6 |
| RDS (%) | 2.8 | 5.4 | 4.8 | 11 | 3.9 | 11 |
| ICP-AES | ||||||
| TiO2 Average (% w/w) | 11.0 | 8.0 | 9.9 | 8.01 | 7.4 | 7.4 |
| Sd (% w/w) | 0.2 | 0.1 | 0.2 | 0.04 | 0.3 | 0.7 |
| RDS (%) | 1.9 | 1.3 | 2.3 | 0.51 | 3.8 | 9.6 |
The ICP-AES analyses were made in triplicate on all the mineralized solutions and the average results are reported in row 7 (Table 3). The TiO2 content is ranging between 11.0% w/w and 7.4% w/w respectively for Sample #1 and Sample #5. The ICP-AES results achieved for Sample #4 and #6 are aligned with the values determined on the other samples, since the spectroscopic method does not suffer from the interfering action of Cu2+, whose suggested main line (λ = 324.454 nm) is far from the main lines of Ti (334.940 nm, 336.121 nm and 337.279 nm). The ICP-AES values were usually higher than the correspondent SWV data, the only exceptions was Sample #2, for which the two techniques gave very similar results; the ICP-AES gave also in this series of experiments more precise determinations, as witnessed by the standard deviation and the relative standard deviations values reported in rows 9–10 (vs rows 5–6).
The two methods were compared for each sample, at 95% of confidence level, and as expected, the results were statistically equivalent for Samples #1–3, while for those samples which had interfering substances only the ICP-AES results were considered reliable. On the other hand, if the ICP-AES would had been used alone, the interfering action of Cu would not have been discovered (positive aspect of the SWV measurements).
The TiO2% w/w data reported in Table 3, were used in the following for computing the extraction yields.
Recovery of the TiO2 particles from the foundation cream: Solvent extraction
A representative portion of TiO2 particles were isolated from the six foundations by applying a solvent extraction procedure, knowing that these formulations have as base an oil-in-water emulsion, in which the pigments are dispersed (aqueous phase). The choice of the solvents was based on a previous work in which the TiO2 particles were extracted from a sunscreen lotion.15 The choice of the ternary mixture water–methanol–hexane was confirmed by some preliminary experiments while to establish the more suitable volume ratio among the solvents, five different portions of Sample #1 were treated following the procedure described in “Foundation cream: TiO2particle solvent extraction” (ESI†) and by varying the volumes of water, methanol and hexane as reported in Table 4. The extraction procedure was applied once and only the aqueous phase was retained for the subsequent experiments, even if “a priori” it reasonable to think that the TiO2 particles may distribute between the two phases if they are coated with an organic layer.| Extract 2 | Extract 3 | Extract 4 | Extract 5 | Extract 6 | |
|---|---|---|---|---|---|
| Water/mL | 20 | 15 | 10 | 20 | 40 |
| Methanol/mL | 20 | 25 | 30 | 80 | 160 |
| Hexane/mL | 10 | 10 | 10 | 20 | 40 |
| Weighed amount of foundation/g | 0.1682 | 0.1881 | 0.1841 | 0.3483 | 0.7271 |
| Expected amount of TiO2 by SWV/mg | 16.2 | 18.2 | 17. 8 | 33.6 | 70.2 |
| Determined amount of TiO2 by SWV/mg | 1.6 | 2.0 | 2.5 | 15.0 | 31.3 |
| Yield (%) | 10% | 11% | 14% | 14% | 11% |
| Expected amount of TiO2 by ICPAES/mg | 18.3 | 20.4 | 20.0 | 37.8 | 78.9 |
| Determined amount of TiO2 by ICP-AES/mg | 1.8 | 3.2 | 2.9 | 17.9 | 30.9 |
| Yield (%) | 10% | 16% | 15% | 14% | 10% |
| Slurry ICP-AES/mg | 1.4 | 1.7 | 8.7 | ||
| Yield (%) | 9% | 10% | 12% |
Part of the aqueous phases were mineralized as described in Methods 3 (ESI†) and analyzed either by SWV “as is” and ICP-AES, diluting the mineralized solution 1![[thin space (1/6-em)]](https://www.rsc.org/images/entities/char_2009.gif) :100; the amount of TiO2 present in the aqueous extract was calculated by knowing the weighed amount of treated cream (row 4) and by using the percentage of TiO2 determined by SWV and by ICP-AES on the mineralized sample (Table 3). By increasing the ratio of water–methanol from 1:1 to 1:4 the amount of TiO2 present in the aqueous extracted is almost constant, ranging between ∼10% to ∼14% (row 7) when the mg are computed from the concentrations determined by SWV with detection limits LD of about 540 μg L−1, between ∼10% to ∼16% (row 10) if the mg are computed from the concentrations determined by ICP-AES.
:100; the amount of TiO2 present in the aqueous extract was calculated by knowing the weighed amount of treated cream (row 4) and by using the percentage of TiO2 determined by SWV and by ICP-AES on the mineralized sample (Table 3). By increasing the ratio of water–methanol from 1:1 to 1:4 the amount of TiO2 present in the aqueous extracted is almost constant, ranging between ∼10% to ∼14% (row 7) when the mg are computed from the concentrations determined by SWV with detection limits LD of about 540 μg L−1, between ∼10% to ∼16% (row 10) if the mg are computed from the concentrations determined by ICP-AES.
The last two columns report the data for a water–methanol 1:4 in which the final whole aqueous fraction volumes were about 100 and 200 mL respectively, which were reduced roughly to 30 and 50 mL by centrifuging the fractions at 4000 RPM for 1 h. One could argue that the intensity of the centrifuge field was too low to sediment all the TiO2 particles, but this result suggests instead that the TiO2 particles contained in this sample have a mass, or size, correspondent to the TiO2 used as pigment (white colored) and not as UV filter (colorless, sizes < 100 nm). This statement will be proven by other experiments described in the following sections concerning the size/mass distributions.
To confirm the concentration of the aqueous extracted fractions, some of them were selected (extracts 2, 4 and 6) and analyzed by ICP-AES directly as slurries. The results, reported in the last two rows of Table 4 are in reasonable agreement and confirm the correspondent data achieved on the mineralized portions.
Since the extraction yields in terms of TiO2% w/w were almost independent of the extraction solvent volume ratio, the 1:4:1 was selected since the higher amount of methanol better dispersed the foundation, and it was evaporated more rapidly than water when the extracted phases had to be concentrated for the SdFFF-ICP-AES measurements.
Preliminary FlFFF fractionations of the aqueous phase extracted from the foundations
All the aqueous phases extracted from the foundations were analyzed by FlFFF fractionation in order to roughly estimate the size distributions of the particles contained in them. The suspensions were vortexed and bath sonicated for 5 s before being injected in the FlFFF channel. Fig. 1(a) reports as example the whole fractogram obtained from Sample #1, chosen since it has the highest concentration of TiO2; graph (b) is the enlarged view of it. The applied flow conditions were not extreme (Qc/QL = 0.527; Qc = 0.220 mL min−1), so that UV profile shows an intense void peak compared to the fractionated sample: the amount of particles which were not fractionated was extremely high respect to the particles which interact with the cross-flow. The analysis time was 110 min, and the last peak visible on the plot is due to the particles exiting the channel after that the cross flow was switched off. | ||
| Fig. 1 (a) FlFFF fractogram. Carrier flow rate QL = 0.417 ± 0.046 mL min−1, cross flow rate Qc = 0.220 ± 0.021 mL min−1, Qc/QL = 0. 527; (b) Enlarged view of the fractogram. (c) FlFFF fractogram obtained applying a carrier flow rate QL = 1.361 ± 0.001 mL min−1 and a cross flow rate Qc = 0.388 ± 0.008 mL min−1, Qc/QL = 0.285, fractions were collected every 5.5 min Ti (μg g−1) ICP-AES determination (blue circles), LD = 25 μg L−1 (d) Particle size distribution (PSD) derived from the fractogram reported in (c). Carrier: Fl-70 0.01% v/v, UV range = 0.005; V0 = 2.03 mL, w = 0.0365 cm. | ||
To determine the elemental composition of the particles which generated such a UV profile, a new separation was performed by increasing the ratio Qc/QL to 0.283 to achieve a more intense signal due to the retained particles even if the resolution was reduced, as expected. During the run some fractions were collected every 5.5 min (about 7.5 mL), which were analyzed as slurries by ICP-AES. Plot (c) summarizes the separation results, the whole fractogram and the enlarged view, in which the secondary y-axis reports the Ti concentration expressed in μg L−1. The Ti profile follows quite well the UV trace showing a maximum at about 40 min, which correspond to particles of about 200 nm, as it may be deduced by the PSD plot reported in (d). Since the Ti detection limit in this case was LD = 25 μg L−1, with the concentration data it was possible to make a semiquantitative analysis, and the recovery, respected to the injected amount was of 65%.
Two general remarks were derived from these preliminary fractionations, i) the TiO2 was mainly associated with particles of sizes > 100 nm, which is a reasonable result considering that TiO2 should be here used as a white pigment; ii) in the light of this evidence the more suitable separation technique to identify the Ti profile is the SdFFF.
Preparation of concentrated extracts for the SdFFF-ICP-AES analysis
Since the FFF separations usually dilute the injected sample by a factor of 500–1000 times, in order to perform a mass/size fractionation and to determine the Ti concentration in the collect fractions during the SdFFF analysis, the extraction procedure was repeated for all samples always with the solvent ratio 1:4:1 (water–methanol–hexane) and the aqueous phases were concentrated by about 10 times by evaporating the methanol at 70 °C, a temperature slightly higher than its boiling point.
Samples #1, 2 and 5 produced milky suspensions colored with nuances from white/yellow to white/pink/brown, while Samples 3, 4 and 6 gave more transparent whitish suspensions (see Fig. 5S, ESI†). It is worthwhile to underline that the suspensions derived from Samples #4 and #6 did not settled even after 40 days, while part of the suspensions of Samples #1, #2 and #5 settled within 1 day; this evidence suggested that probably these latter samples contained a higher number of particles of sizes bigger (or heavier) than the other two.
The TiO2 concentration was determined only by ICP-AES since, as previously underlined, this technique in comparison with SWV is more rapid and less sensitive to interfering ions. The analyses were performed on both the suspensions as slurries and mineralized solutions achieved applying the Method 3 (ESI†); data are summarized in Table 5. In almost all cases the determinations made on the slurries gave higher results. The agreement between the concentration values determined on the mineralized solutions and the slurries was reasonably good for Samples #1, 4 and 6 (about 10%), while the sample which gave the worst correspondence was the #3.
:4:1 extraction ratio), concentrated by evaporation 70 °C
| Sample | #1 | #2 | #3 | #4 | #5 | #6 |
|---|---|---|---|---|---|---|
| Weighed/g | 0.4276 | 0.4147 | 0.4188 | 0.4193 | 0.416 | 0.423 |
| w/w % TiO2 | 11.0 | 8.0 | 9.9 | 8.0 | 7.3 | 7.4 |
| Miner/mg L−1 | 27.4 | 18.3 | 12.5 | 4.7 | 16.3 | 6.9 |
| Yield extr Min | 73% | 69% | 34% | 18% | 60% | 25% |
| Slurry/mg L−1 | 30.2 | 15. 7 | 8.7 | 5.2 | 20.3 | 8.0 |
| Yield extr Slu | 80% | 59% | 24% | 19% | 75% | 29% |
The extraction yields, computed with respect to the concentrated extracts, were quite high for Samples #1, 2 and 5, whereas Samples #3, 4 and 6 gave lower yields.
SdFFF-ICP-AES analysis
The SdFFF fractionation of the six concentrated suspensions were preformed under programmed conditions of the field, whose parameters depended on the sample type, and they are reported in Table S2 (ESI†). The PSDs were computed elaborating the fractograms with the software which manages the instrument. The most critical input parameter to get the PSD from a SdFFF fractogram is the sample density, which in this study, was set to 4.05 g mL−1, the average value of the two most common crystallographic phases of TiO2, Rutile and Anatase, whose densities are 3.84 and 4.26 g mL−1 respectively.30In order to be sure that the detected particles were made of Ti—Fe, Zn and Bi were selected for the spectroscopic determinations. In all cases the concentration values of these elements were below or very close to their correspondent detection limits, so that in all the next figures their flat, constant profiles have been omitted. The Ti detection limits were in the range 17–95 μg L−1, depending on the sample, and the concentration determined in the fractions sometimes was very close to these values; however, even if the data do not allow quantitative calculations, such as the mass recovery evaluation for which the quantification limit should be exceeded, the important aspect is the qualitative correlation between the UV elution profile and the elemental composition of the eluate.
The suspensions were vortexed and bath sonicated for 5 s before being injected in the SdFFF channel; during the run, fractions of eluate were collected every 3 min in order to have a sufficient volume available for the direct ICP-AES determinations. The element concentration values, expressed in μg L−1, are reported in all Figures on the right secondary y-axis of graph (a). The results are collected in Fig. 2–7, in which are also reported some TEM pictures taken for each sample. As a general comment, the amount of material existing in the void peak was significantly high for all samples, meaning that there are particles of mass which cannot be fractionated by SdFFF; it might be supposed that these particles may have sizes lower than 100 nm or bigger, if their density is lower than ∼4 g mL−1.
 | ||
| Fig. 2 (a) SdFFF fractogram and its enlarged view of extracted concentrated Sample #1; fractions collected every 3 min. Ti (μg g−1) ICP-AES determination (circles), LD = 17 μg L−1. (b) Particle size distribution (PSD). Separation conditions: Program A (Table S2, ESI†); Carrier: Fl-70 0.1% v/v; flow rate Q = 2.050 ± 0.007 mL min−1, UV range 0.01. (c and d) TEM photographs of Sample #1 at different magnifications, 30 and 50 respectively. | ||
 | ||
| Fig. 3 (a) SdFFF fractogram and its enlarged view of extracted concentrated Sample #2; fractions collected every 3 min. Ti (μg g−1) ICP-AES determination (circles), LD = 46 μg L−1. (b) Particle size distribution (PSD). Separation conditions: Program A (Table S2, ESI†); Carrier: Fl-70 0.1% v/v; flow rate Q = 2.045 ± 0.008 mL min−1, UV range 0.01. (c and d) TEM photographs of Sample #2 at different magnifications, 10 and 50 respectively. | ||
 | ||
| Fig. 4 (a) SdFFF fractogram and its enlarged view of extracted concentrated Sample #3; fractions collected every 3 min. Ti (μg g−1) ICP-AES determination (circles), LD = 42 μg L−1. (b) Particle size distribution (PSD). Separation conditions: Program A (Table S2, ESI†); Carrier: Fl-70 0.1% v/v; flow rate Q = 2.039 ± 0.003 mL min−1, UV range 0.01. (c and d) TEM photographs of Sample #3 at different magnifications, 8 and 80 respectively. | ||
 | ||
| Fig. 5 (a) SdFFF fractogram and its enlarged view of extracted concentrated Sample #4; fractions collected every 3 min. Ti (μg g−1) ICP-AES determination (circles), LD = 15 μg L−1. (b) Particle size distribution (PSD). Separation conditions: Program B (Table S2, ESI†); Carrier: Fl-70 0.1% v/v; flow rate Q = 2.041 ± 0.006 mL min−1, UV range 0.01. (c and d) TEM photographs of Sample #4 at different magnifications, 9, 20 and 15 respectively. | ||
 | ||
| Fig. 6 (a) SdFFF fractogram and its enlarged view of extracted concentrated Sample #5; fractions collected every 3 min. Ti (μg g−1) ICP-AES determination (circles), LD = 21 μg L−1. (b) Particle size distribution (PSD). Separation conditions: Program A (Table S, ESI†); Carrier: Fl-70 0.1% v/v; flow rate Q = 2.041 ± 0.004 mL min−1, UV range 0.01. (c and d) TEM photographs of Sample #5 at different magnifications, 70, 100 and 120 respectively. | ||
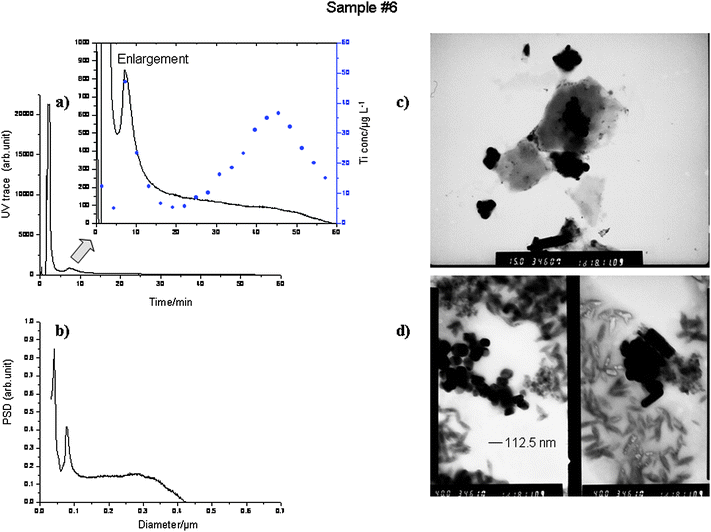 | ||
| Fig. 7 (a) SdFFF fractogram and its enlarged view of extracted concentrated Sample #6; fractions collected every 3 min. Ti (μg g−1) ICP-AES determination (circles), LD = 21 μg L−1. (b) Particle size distribution (PSD). Separation conditions: Program B (Table S2, ESI†); Carrier: Fl-70 0.1% v/v; flow rate Q = 2.049 ± 0.005 mL min−1, UV range 0.01. (c and d) TEM photographs of Sample #6 at different magnifications, 15 and 40 respectively. | ||
Sample #1 (Fig. 2): The fractogram, achieved by applying the SdFFF program A (Table S2, ESI†), presents a single broad but quite regular and symmetric peak (graph a) to which corresponds in the PSD a population of particles spanning between 100 and 500 nm (graph b). The μg L−1 of Ti can be read from the secondary y-axis of graph (a); from the element profiles it might be deduced that the peak is mainly due to TiO2 particles, which are symmetrically polydisperse.
By observing the TEM picture (c), it might be supposed that the TiO2 particles are those which appear very dark, whose dimensions correspond to those determined via SdFFF. In the same picture, and also in the photograph (d) are shown other particles, of very regular rounded form, which present a radial structure and whose diameters span between 50 to 130 nm; they may correspond to the shoulder peaking at 100 nm in the PSD, graph (b) because their presence is quite limited.
Sample #2 (Fig. 3): The fractogram was recorded under the conditions reported in program A (Table S2, ESI†); it presents a single broad peak of weaker intensity with respect to the previous one, to which correspond in the PSD a population of particles spanning between 150 and 400 nm. The TEM photographs prove that the particles contained in this sample are more heterogeneous in shape, e.g. some rods are also present; they might be made of different mineral, but the flat Fe, Zn and Bi profiles did not answer to this point.
A light discrepancy between the UV profile and the Ti profile occurs between 10 and 20 min where particles made of TiO2, are exiting but whose amount does not appear in the UV profile.
Sample #3 (Fig. 4): The SdFFF UV elution profile presents two partially overlapped peaks, the first peaking at about 30 min and the second at about 40 min. The correspondent PSD, derived by the fractogram achieved with program A (Table S2, ESI†) and computed always by assuming the average density of 4.05 g mL−1, gives the first population of particles at about 230 nm and the second at 300 nm. The Ti concentration profile resembles that one just described for Sample #2, but its peak perfectly matches only the second population of particles. It might be supposed that the pigment used in this formulation be very similar to that used to prepare Sample #2, even if this is difficult to assess by observing the TEM pictures reported in (c) and (d). In fact, two different types of particles are present, both of regular shape (roundish): some of them resemble those observed in Sample #1 and #5, the others, of bigger dimensions have a lighter, almost transparent texture to TEM, typical of triple emulsion state, for which the assumption of a density of 4.05 g mL−1 is surely inappropriate.
Sample #4 (Fig. 5): The fractogram was obtained by applying a stronger initial field (program B, Table S2, ESI†), in spite of this the UV signal shows a very intense peak close to the void time and a profile which slowly decreases within 50 min without evidencing any other distinct peak; some other attempts were made by increasing the applied field and setting the run time to 90 min but the results were very similar to that reported in graph (a). The most interesting aspect of these analyses is the apparent discrepancy between the Ti concentration profile and the UV trace. In fact, the highest Ti concentration detected in the collected fractions is roughly 3 times more than that found in the Sample #3 and it is found at about 45 min (∼290 nm), where the turbidimetric signal is low. This sample seams to contain numerous small particles, which may aggregate, but which are not responsible for the TiO2 peak. This deduction can be supported by the TEM pictures (c) and (d), in which very small particles of quite regular shape (dark spots) are evident together some bigger particles of irregular shape, less compact or thinner, of about 300–400 nm.
Sample #5 (Fig. 6): This concentrated sample appeared milky as Sample #1 and lightly brown colored, its SdFFF analysis (program A, Table S2, ESI†) produced a single broad peak, whose maximum falls at about 35 min, with a turbidimetric signal which is the highest among all samples. The Ti concentration profile, overlaps quite perfectly with the UV signal, and the Ti concentration values are far from the detection limits, as found for Samples #1 and #4. The symmetrical shape of the peak suggests that the particles are also symmetrically polydispesed with respect to the most frequent size identified at about 260 nm. The TEM pictures reported in (c) and (d) show particles of very regular roundish shape, very similar to those seen inside of Samples #1 and #3, whose size correspond to that observed in the PSD and that can be reasonably considered made of TiO2, since the Fe concentration profile shows a very weak increase in correspondence of the maximum; however its concentration levels were below the detection limits. From the photographs, the presence of compact particles smaller than 100 nm is also evident.
Sample #6 (Fig. 7): This suspension appeared very similar to Sample #4, stable over the time and opalescent white, so that a stronger initial SdFFF field was applied to fractionate it (program B, Table S2, ESI†). The fractogram presents a very narrow peak at about 8 min, immediately after the very intense void peak, and then a profile which slowly decreased almost to the base line within 60 min, similar to what was observed in Fig. 5 (Sample #4); in the PSD plot, the first peak falls at about 90 nm, then the particle population spans up to 400 nm. The ICP-AES determinations gave a Ti profile which perfectly matchs the first narrow peak but which does not follow the UV trace toward the end of the fractogram, where the Ti concentration increases but only a few particle (∼260 nm) are eluting. The TEM photographs reported in (c) and (d) confirm that this sample contains mainly very small and compact particles of irregular shape ranging between 60 to 130 nm and a consistent amount of small needle particles, which were peculiar for this sample.
FlFFF fractionation of some concentrated aqueous suspensions
From the previous SdFFF experiments supported by the TEM images, the samples which captured the author's attention were Sample #3 and #4 because of the particle type.In order to verify the lowest sizes of the particles, both samples were analyzed by FlFFF since its fractionation does not depend on the density of the particles; very extreme cross flow conditions were applied and the runs were stopped even if the fractionation process was incomplete. Fig. 8 (a) reports the fractogram of Sample #3, in which a very intense peak is visible at the end of the run when the cross flow is removed, which allows the particles to exit all together from the channel. The first very weak peak is visible between 10 and 20 min, then at about 25 min the UV signal increases and stay almost stationary till at the end. The derived PSD (plot (b)) shows that to the first peak corresponds to particles of about 2–3 nm. These could be part of those very small which were entrapped inside of the triple emulsion (see TEM picture (c) in Fig. 4), which exit because of either the extraction process and the mechanical action of the ultrasound probe used to disperse the sample prior of the analysis.
 | ||
| Fig. 8 (a) FlFFF fractogram (black line) obtained by injecting Sample #3. Carrier: Fl-70 0.01% v/v, carrier flow rate QL = 0.980 ± 0.008 mL min−1, cross flow rate Qc = 0.956 ± 0.003 mL min−1, Qc/QL = 0.975, V0 = 1.96 mL, UV range = 0.002; (b) Particle size distribution (PSD) derived from the fractogram reported in (a). The fractogram conversion was obtained using w = 0.0340 cm. (c) FlFFF fractogram (black line) obtained by injecting Sample #4. Carrier: Fl-70 0.01% v/v, carrier flow rate QL = 0.452 ± 0.010 mL min−1, cross flow rate Qc = 1.329 ± 0.030 mL min−1, Qc/QL = 2.94, V0 = 2.03 mL, UV range = 0.02; (d) Particle size distribution (PSD) derived from the fractogram reported in (c). The fractogram conversion was obtained using w = 0.0365 cm. | ||
A different aspect presents the fractogram obtained from Sample #4, whose component have been resolved from the void peak but the signal is increasing and it reach an almost stationary condition after 1 h (see Fig. 8 (c)). The derived PSD (d) says that the smaller size measured by the FlFFF are of about 15 nm.
Conclusions
In this work an analytical procedure to quantify the TiO2 contained in commercial foundations by SWV is proposed as an alternative to the more consolidated ICP-AES spectroscopic technique. Both methods make it possible to determine multielements simultaneously but the SWV equipment cost is considerably lower. The SWV results on the mineralized samples, achieved with a good precision and accuracy, were compared with the established ICP-AES method and the disagreement between the SWV and ICP-AES results allowed to highlight the presence of Cu2+, detected only by SWV, as interfering ion.The higher amount of TiO2 was found in the sample commercialized in USA, on which the TiO2 was declared as ingredient (∼ 11% w/w), while all samples commercialized in Europe (Italy) had a lower TiO2 content (in most cases < 8% w/w).
The Flow and the Sedimentation FFF techniques were used synergically to size the particles contained in the commercial foundations. Thanks to non-disruptive nature of the FFF techniques, on collected fractions of eluate, the off-line ICP-AES slurries determinations allowed to classify the TiO2 as pigment, i.e. with particles of sizes bigger than 100 nm. However, in all considered samples a large number of nanoparticles were detected, whose chemical nature is currently under investigation.
Acknowledgements
The authors gratefully thank Dr Maciej Zborowski and Dr P. Stephen Williams of the Lerner Research Centre, Cleveland Clinic (Cleveland, OH) for the kind loan of the Flow FFF system and Microdyn-Nadir GmbH (Wiesbaden, Germany) for having donated the membranes. The authors wish gratefully to thank also Dott. Arrigo Aleotti for his assistance in performing TEM analyses at the Centro di Microscopia Elettronica of the Università di Ferrara. This work was financially supported by University of Ferrara (Fondo di Ateneo per la Ricerca Scientifica FAR 2009).References
- A. O. Gamer, E. Leibold and B. van Ravenzwaay, Toxicol. in Vitro, 2006, 20, 301–307 CrossRef CAS.
- J. Wu, W. Liu, C. Xue, S. Zhou, F. Lan, L. Bi, H. Xu, X. Yang and F.-D. Zeng, Toxicol. Lett., 2009, 191, 1–8 CrossRef CAS.
- L. XiaoBo, X. Shunquing, Z. ZhiRen and H. J. Schluesener, Chin. Sci. Bull., 2009, 54, 3830–3836 CrossRef.
- http://ec.europa.eu/enterprise/sectors/cosmetics/documents/directive/ .
- http://ec.europa.eu/health/ph_risk/committees/sccp/documents/out222_en.pdf .
- http://ec.europa.eu/health/ph_risk/committees/04_sccp/docs/sccp_o_123.pdf .
- Annex IV/1 76/768/EEC - http://eur-lex.europa.eu/LexUriServ/site/en/consleg/1976/L/01976L0768-20061003-en.pdf.
- http://ec.europa.eu/enterprise/sectors/cosmetics/files/doc/colouring_agents_restricted_fields_of_appl_en.pdf .
- Field-Flow Fractionation Handbook; M. E. Schimpf, K. D. Caldwell, J. C: Giddings, ed.; Wiley-Interscience: New York, 2000 Search PubMed.
- S. K. Ratanathanawongs Williams, H. Lee, B. Butler-Veytia, ACS Symposium Series – 6805 (Service Life Prediction), 2002, p. p. 285.
- S. Rasouli, P. Blanchart, D. Cledat and P. J. P. Cardot, J. Chromatogr., A, 2001, 923, 119–126 CrossRef CAS.
- P. J. P. Cardot, S. Rasouli and P. Blanchart, J. Chromatogr., A, 2001, 905, 163–173 CrossRef CAS.
- A. Koliadima, D. Gavril and G. Karaiskakis, J. Liq. Chromatogr. Relat. Technol., 1999, 22, 2779–2793 CrossRef CAS.
- A. Zattoni, P. Reschiglian, M. Montalti, N. Zaccheroni, L. Prodi, R. A. Picca and C. Malitesta, Inorg. Chim. Acta, 2007, 360, 1063–1071 CrossRef CAS.
- C. Contado and A. Pagnoni, Anal. Chem., 2008, 80(19), 7594–7608 CrossRef CAS.
- B. P. Frank, S. Saltiel, O. Hogrefe, J. Grygasa and G. Garland Lala, J. Aerosol Sci., 2008, 39, 19–29 CrossRef CAS.
- T. Allen, Powder Sampling and Particle Size Determination, 3rd ed.; Chapman &Hall: London, 2003 Search PubMed.
- W. S. Kim, M. Park, D. W. Lee, M. H. Moon, H. Lim and S. Lee, Anal. Bioanal. Chem., 2004, 378, 746–752 CrossRef CAS.
- M. F. Benedetti, J. F. Ranville, T. Allard, A. J. Bednar and N. Menguy, Colloids Surf., A, 2003, 217, 1–9 CrossRef CAS.
- G. Blo, C. Conato, C. Contado, A. Pagnoni and F. Dondi, Ecol. Chem. Eng., 2006, 13(5), 399–408 Search PubMed.
- L. G. Gimbert, K. N. Andrew, P. M. Haygarth and P. J. Worsfold, TrAC, Trends Anal. Chem., 2003, 22(9), 615–633 CrossRef CAS.
- B. Stolpe, L. Guo, A. M. Shiller and M. Hassellöv, Mar. Chem., 2010, 118(3–4), 119–128 CrossRef CAS.
- S. Dubascoux, I. Le Hécho, M. P. Gautier and G. Le spes, Talanta, 2008, 77, 60–65 CrossRef CAS.
- http://fscimage.fishersci.com/msds/06352.htm .
- I. Lavagnini and F. Magno, Mass Spectrom. Rev., 2007, 26, 1–18 CrossRef CAS.
- D. L. Massart, B. G. M. Vandeginste, L. M. C. Buydens, S. De Jong, P. J. Lewi, J. Smeyers-Verbeke, Handbook of Chemometrics and Qualimetrics: Part A; Elsevier: Amsterdam, 1997 Search PubMed.
- D. Melucci and C. Locatelli, Microchem. J., 2007, 85, 321–328 CrossRef CAS.
- International Union of Pure and Applied Chemistry—Analytical Chemistry Division, Spectrochim. Acta, 1978, 33B, pp. 241–245 Search PubMed.
- Analytical Methods Committee, Analyst, 1987, 112. pp. 679–686 Search PubMed.
- The Merck index: an encyclopedia of chemicals, drugs, and biologicals, O'Neil, M. J. ed,14th Ed.; Merck Research Laboratories: Whitehouse Station (NJ), 2006 Search PubMed.
Footnote |
| † Electronic supplementary information (ESI) available: Theory, methods and Fig. S1–5. See DOI: 10.1039/c0ay00205d |
| This journal is © The Royal Society of Chemistry 2010 |