Alternative moving window factor analysis (AMWFA) for resolution of embedded peaks in complex GC-MS dataset of metabonomics/metabolomics study
Da-Lin
Yuan
a,
Lun-Zhao
Yi
*ab,
Zhong-Da
Zeng
a and
Yi-Zeng
Liang
*a
aResearch Center of Modernization of Chinese Medicines, Central South University, Changsha, 410083, China. E-mail: yilunzhao@mail.csu.edu.cn; Fax: +86-731-883-0831; Tel: +86-731-883 6376
bKey Laboratory of Cancer Proteomics of Chinese Ministry of Health, Xiangya Hospital, Central South University, Changsha, 410078, China. E-mail: yizeng_liang@263.net; Fax: +86-731-882-5637; Tel: +86-731-882 2841
First published on 21st June 2010
Abstract
Hyphenated instruments, such as GC-MS, have been being widely used in many studies of metabolomics/metabonomics. With the deepening of research, chromatograms become more and more complex and the problem of embedded peaks seems to be ineluctable. In this paper, alternative moving window factor analysis (AMWFA) method is introduced to resolve this problem occurring in metabolomics/metabonomics research. This new method can extract selective information by alternative scanning and comparing between two analytical systems. On the basis of the selective information obtained from chromatograms and spectra of two systems, the AMWFA approach can resolve the embedded peaks in GC-MS responses matrix into pure chromatograms and spectra without any model assumption on the peak shape. The resolution results obtained from one simulated data and two real metabolomics data demonstrate the performance of the proposed approach and indicate that it may be a promising one for analyzing complex data from metabolomics/metabonomics studies.
1. Introduction
Gas chromatography-mass spectrometry (GC-MS) is the most commonly used method for characterization and identification of organic compounds in complex mixtures, such as samples investigated in metabolomics/metabonomics. In general, the two-dimensional data from this hyphenated instrument provide non-negative spectra and non-negative and unimodal chromatographic profiles. Furthermore, the peak that elutes first will disappear first in chromatographic direction, or say simply “first-in–first-out”1. Those features of two-dimensional data make it possible to resolve chemical components in a complex system. In recent decades, different kinds of methods have been proposed to extract pure spectra from complex chromatograms, for example, iterative target transformation factor analysis (ITTFA)2, evolving factor analysis (EFA)3,4, heuristic evolving latent projections (HELP)5,6, windows factor analysis (WFA)7,8 and sub-window factor analysis (SFA)9,10. These methods have shown their potential in many fields 1,11–14.However, a special case called embedded peaks is often existent in chromatography, especially in the analysis of metabolites and traditional Chinese medicines. For this case, the assumption of “first-in–first-out” will not be available and the above resolution techniques seem to be helpless. For example, SFA requires that each targeted analyte has two subwindows where only that analyte is the common component. But two such subwindows are impossible to find for the component whose peak is embedded. How to deal with this case is still a big problem for analytical researchers though some resolution approaches have been proposed and progressed. Every method is limited by crucial assumptions, many of which are even very rigorous. To the best of our knowledge, sequential rank analysis of first-order differentiated matrix (SRAFDM) 15method and orthogonal projections resolution algorithm (OPR) 16,17are two popular techniques for embedded peaks, while the assumptions of them might be too strong for chromatographic peaks in real systems, especially for the GC-MS data. For example, the assumption of SRAFDM method is locally symmetric. It is almost impossible for most real GC-MS data.
In this investigation, a new resolution approach named alternative moving window factor analysis (AMWFA)18 was introduced to resolve data with embedded peaks. This method is a very powerful tool for information mining. Selective information, whatever it is strong or not, hidden in two analytical systems can be extracted. Based on the selective information, number of common components, their corresponding spectra and chromatograms can be obtained automatically. In real experimental processes, some embedded peaks could be isolated or partly isolated through optimizing chromatographic conditions, such as selecting a more effective column, changing the oven temperature and so on. But the optimization procedure may be usually be time-consuming and/or the established experimental conditions are rigorous, requiring, for example, a more expensive column or high-grade instrument etc. In fact, it is deserved for one sample but it will be unworthy for large numbers of samples. AMWFA method could utilize selective information in one data to resolve the corresponding embedded peaks in other data. It frees us from experimental conditions to some extent.
In this paper, a simulated data was used to demonstrate the data analytical procedure of AMWFA. Then, the approach was successfully applied to analyze the embedded peaks in the investigation of the secondary metabolites (volatile oils) in a herb, Herba Houttuyniae, and the metabolites of fatty acids in Type 2 diabetic patient's plasma. This method has shown powerful abilities and a prosperous future for the resolution of embedded peaks in complex systems, which is of great importance in the research fields of metabolomics, phytochemistry and environmental science, etc.
2. Theory
The AMWFA method is proposed based on multicomponent spectral correlative chromatography (MSCC)19 and sub-window factor analysis (SFA) developed by Liang et al. and Manne et al. in our research group, respectively. MSCC algorithm utilized a projection operator constructed with the principal spectral features extracted from the data of target sample to judge the presence or absence of a spectral correlative chromatographic cluster in another one. For this judgment, congruence coefficient between the original spectra and its projected residual vectors is proposed to eliminate the influence from background and noises, especially heteroscedastic noises in the original data.19 This method has been successfully used to composition comparison of complex systems, such as analysis of herbal medicines 20 and metabolites 21.As to the discussion of SFA, when only one of the common component exists in two submatrices (denoted as E and F), its spectrum, say s, can be easily expressed by the linear combination of the columns of E or F, that is, s = ∑aiei = ∑bjfj = Ea = Fb. The key point in SFA is to correctly pick up two subwindows, so-called left and right subwindows, containing only one common component, and then to extract its corresponding pure spectrum from the eigenvector of eigenvalue being equal to or close to 1 by solving the eigenvalue problem of the equation, say aTETFb = d.9 The only new point of AMWFA compared to SFA just lies in its efficiently utilizing the useful information from both matrices X and Y. The difference between matrices X and Y both in concentration profiles and chemical species will provide much more chances of picking out the selective information or nearly selective information hidden in matrix X or matrix Y. For that reason, this method could extract selective information of embedded peaks from another matrix which has the same component as the embedded one. So, how to resolve embedded peaks turns into the problem of how to extract the selective information from common component.
Embedded peaks in GC-MS data are divided into three species (shown in Fig. 1 (a), (b) and (c)). All of them can be resolved by the proposed AMWFA method because their selective information can be obtained from another analytical system. Selective information can be obtained from three possible cases shown in Fig. 1 (a′), (b′) and (c′)). For the cases ‘a’ and ‘c’, the pure selective information areas are easy to be found. As to the case ‘b’, the pure selective information area of peak 2 does not exist in both ‘b’ and ‘b’ matrices, while, by AMWFA method we can obtain the pure spectrum information from the area that the number of common components is one. The one common component areas are between the two dotted lines in Fig. 1(b) and (b′). In order to extract the pure spectrum of the common component efficiently and automatically, two techniques were developed and named as common rank map and spectral auto-correlative curve, which will be discussed in detail in the following subsections.
 | ||
| Fig. 1 Three cases of embedded peak clusters. (a), (b) and (c): Three different elution patterns for a chromatographic peak embedded in another one. (a′), (b′) and (c′): Three kinds of elution patterns that selective information can be obtained. | ||
2.1. Common rank map
| sk = ∑aikei = ∑bjkfj = Eak = Fbk (k = 1, 2, …, c) | (1) |
| f(ak, bk) = |Eak − Fbk|2 = akTETEak + bkTFTFbk − 2akTETFbk = 2 − 2akTETFbk = 2(1 − akTETFbk) (k = 1, 2, …, c) | (2) |
Thus, the minimum of the above objective function can be achieved by solving the following eigenvalue problem, that is,
| akTETFbk = dk | (3) |
Notice that, ETE = I, FTF = I and sk = Eak = Fbk, then we have
| ak = ETsk = ETFbk = ETFFTsk = ETFFTEak | (4) |
| bk = FTsk = FTEak = FTEETsk = FTEETFbk | (5) |
According to eqn (4) and eqn (5), as long as the analyte, say sk, is really a common component of X and Y, ak and bk must be the eigenvectors of matrices ETFFTE and FTEETF with unit eigenvalues. If there are c common components in X and Y, there will be c eigenvalues, say dk (k = 1, 2, …, c), equal or closing to 1. If there is no common component between X and Y, the value of dk will be significantly less than 1 and the value of the objective function f(ak, bk) will be close to 2. Therefore, the objective function f(ak, bk) is entitled as fitting value F and can be employed to evaluate the fitness of Ea and Fb. If there are two or more common components between X and Y, the second or more singular values will also be close to 1, deservedly. In other words, the number with eigenvalue dk = 1 (k = 1, 2,…, c) is equal to the number of common components c.
As discussed above, the key step in SFA is first to correctly pick up two subwindows containing only one common component from a 2D spectra-chromatogram and then to conduct common rank analysis. Moreover, one has two spectra-chromatograms at hand for AMWFA, which hints that there is a much greater chance for AMWFA to carry out common rank analysis. Thus, how to do the common rank analysis efficiently needs some strategic thought. With the help of the moving window technique, a plot called common rank map describing the relationship between two spectra-chromatograms can be produced in AMWFA. At first, the basic matrix Y containing selective information about interesting components was selected from one chromatogram, and then the moving window technique was employed to pick out matrix X from another chromatogram. Of course, the roles of two chromatograms can be exchanged alternatively when needed. Notice that the spectral information in basic matrix Y and the selective information hidden in X can be extracted efficiently by such a common rank map for resolving the spectra of pure common components, since the size of moving window can be easily changed. The smaller the size of the moving window is, the higher the selectivity efficacy of such a searching. In some cases, it is very difficult to obtain the clear selective information by classic two-way resolution methods. Under these conditions, the change of the basic matrix and the size of moving window will be very helpful to extract the selective information hidden both in two spectra-chromatograms.
2.2. Spectral auto-correlative curve
As discussed above, when only one of the common components exists in both matrices compared, its spectrum, say s, can be easily extracted by using linear combination of their loading matrices E and F, that is, s = ∑aiei = ∑bjfj = Ea = Fb. Suppose that a series of spectra (the first eigenvector for matrix ETF) can be extracted by the scanning procedure of moving window discussed above. Then a series of correlation coefficients, or similarities, of the front and its followed spectra are calculated and plotted versus its retention time points, a curve can be obtained, which records the change of the identified spectra. It is named spectral auto-correlative curve here. In this curve, the region with similarity closing to 1 will be used to calculate a pure spectrum of target component together with the information from the common rank map. Furthermore, this region can also be verified by the corresponding value of the objective function defined in eqn (5), say f(a, b)=2(1 − aTETFb), in every calculation. Especially, every interesting chromatographic peak cluster(s) in two spectra-chromatograms can be checked and analyzed by AMWFA. Therefore, it can extract more useful information from two datasets. The advantages and flexibilities of AMWFA are clear and very important for resolving the embedded peaks in complex hyphenated dataIt is worth noting that the chromatographic profiles of the pure components embraced in overlapping peak cluster(s) in X and Y can also be obtained through least squares technique (eqn (9) and eqn (10)), if all the spectra of components in them are obtained. That is,
| Cx = XSx (SxTSx)−1 | (9) |
| Cy = YSy (SyTSy)−1 | (10) |
3. Experimental
A simulated data of GC-MS and two real GC-MS metabolomics data obtained from herbal medical plant (Herba Houttuyniae) and biological samples (Type 2 diabetic patient's plasma samples) are employed to check and validate the performance of AMWFA for complex embedded systems.3.1. Simulated GC-MS data
In this investigation, the synthetic chromatographic profile (c) of each pure component for simulation is of Gaussian peak shape generated according to the following equation,| c(t) = h × e−(t−p)2/(2×w2) | (11) |
| Two systems | Three parameters of the simulated chromatographic profiles | Component names of corresponding mass spectra | |||
|---|---|---|---|---|---|
| h | w | p | |||
| Data X | Component 1 | 90 | 7 | 40 | Oleic acid (18![[thin space (1/6-em)]](https://www.rsc.org/images/entities/char_2009.gif) :1w9) :1w9) |
| Component 2 | 20 | 5 | 45 | Trans-Oleic acid ([E]- 18:1w9) |
|
| Component 3 | 40 | 6 | 55 | Linoleic acid (18:2 w6,9) |
|
| Data Y | Component 1 | 50 | 8 | 30 | Oleic acid (18:1w9) |
| Component 2 | 30 | 6 | 40 | Linoleic acid (18:2 w6,9) |
|
| Component 3 | 40 | 9 | 55 | Trans-Oleic acid ([E]- 18:1w9) |
|
3.2. Analysis of metabolites of fatty acids in Type 2 diabetic patient's plasma
:1) using a vertex mixer for 3 min. 2.5 mL of the upper layer was transferred to an uncapped test tube and dried by nitrogen gas. Prior to analysis, the extracted samples were redissolved in 50 μL of hexane. A volume of 1 μL of the solution was analyzed by GC-MS.
:100. Mass condition was as followed: ionization voltage, 70 ev; ion source temperature, 200 °C; full scan mode in the 30 to 450 μ mass ranges with 0.2 s/scan velocity.
Column temperature process 1: In the gas chromatographic system, an FFAP capillary column (30 m × 0.25 mm × 0.25 μm) was used. Column temperature was maintained at 70 °C for 1 min and then programmed from 70 °C to 150 °C at the rate of 20 °C, 150 °C to 180 °C at the rate of 6 °C, 180 °C to 220 °C at the rate of 20 °C, then hold 2 min at 230 °C.
Column temperature process 2: An DB-WAX capillary column (30 m × 0.25 mm × 0.25 μm) was used. Column temperature was maintained at 70 °C for 1 min and then programmed from 70 °C to 200 °C at the rate of 7 °C and hold 2 min, 200 °C to 230 °C at the rate of 2 °C, then hold 30 min at 230 °C.
3.3 Investigation of second metabolites in volatile oils from Herba Houttuyniae
Chromatographic condition 1: Inlet temperature was kept at 250 °C. Helium carrier gas was used at a constant flow rate of 0.7 ml min−1. An oil sample of 0.2 μl was injected, the split ratio of the injector being 1:50. Column temperature was maintained at 50 °C for 6 min and then programmed from 70 °C to 230 °C at the rate of 10 °C and hold 16 min.
Chromatographic condition 2: Inlet temperature was kept at 210 °C. Helium carrier gas was used at a constant flow rate of 1.0 ml min−1. An oil sample of 0.2 μl was injected, the split ratio of the injector being 1:50. Column temperature was maintained at 60 °C for 3 min and then programmed from 60 °C to 80 °C at the rate of 10 °C and hold 5 min, from 80 °C to 120 °C at the rate of 10 °C and hold 5 min, from 120 °C to 160 °C at the rate of 5 °C and hold 5 min, from 160 °C to 200 °C at the rate of 5 °C, then hold 10 min.
3.4 Data analysis
All computer programs used in this study were coded in MATLAB 6.5 and all calculations were performed on a Pentium IV processor based IBM compatible personal computer with 256 M RAM memories.4. Results and discussion
4.1 Results from the simulated GC-MS data
The simulated chromatograms for two overlapping peak clusters (X and Y) were shown in Fig. 2(a) and 2(b). They both have 3 components, the peaks of which are seriously overlapping with each other. In this example, the resolution processes of those three peaks were presented to show the advantage of AWMFA. Two regions of pure components were represented in the rank map of matrix X (Fig. 2(c)) using FSMWEA and marked ‘1’ and ‘3’. The region 1 of scan points from 10 to 20 was selected as the first basic matrix. Then, the moving window searching was conducted on Y with a fixed window size 3.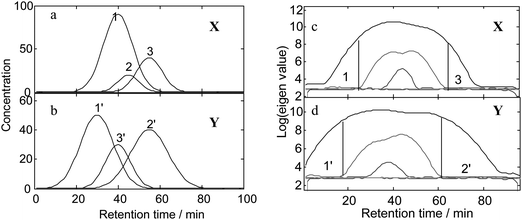 | ||
| Fig. 2 The simulated overlapping chromatograms and the results of FSMWEA analysis. (a) and (b): The chromatograms of matrix X and Y. (c) and (d): The plots of evolving eigenvalues of X and Y obtained using FSMWEA with a window size of five. | ||
The spectral auto-correlative curve and common rank map by AMWFA are shown in Fig. 3(a) and 3(b). The spectral auto-correlative curve gives us the information of spectra similarity of neighboring scan points in the scan region. Spectral auto-correlative curve (in Fig. 3(a)) has a platform at region of scan points 15 to 28. It informs that the spectra of common components obtained from this region are very similar in this region. The common rank map shows the change of number of common components. From scan points 2 to 15, these two matrices have only one common component and it informs us that peak 1 and peak 1′ are corresponding to the same constituent. So, we can obtain the pure mass spectrum by combining the information of the spectral auto-correlative curve and common rank map (the marked region of R1 in Fig. 3(a)). The resolution process of peak 3 is the same as peak 1. The common rank map (Fig. 3(d)) shows that peak 3 and peak 3′ are the same component. Furthermore, the identified pure spectrum of peak 3 can be picked out from the region of R3 in Fig. 3(c). The peak 2 of matrix X is totally embedded by peak 1 and overlapped with peak 3. Commonly, it is impossible to resolve this complex overlapping peak cluster using former chemometric methods, such as EFA, HELP and so on. The proposed method (AMWFA) shows its potential for these embedded peak clusters. The result of FSMWEA analysis for matrix Y exhibits two selective regions (marked ‘1’and ‘2’ in Fig. 2 (d)). Obviously, the region ‘2’ is a good basic matrix for scanning the matrix X. From the spectral auto-correlative curve and common rank map (shown in Fig. 3 (c) and (d)) obtained from the scanning process, the pure mass spectrum was picked out from the flat that was marked as ‘R2’.
 | ||
| Fig. 3 Spectral auto-correlative curves and common rank maps of AMWFA analysis of the simulated data. (a) and (e) are the Spectral auto-correlative curves of X conducted to Y while (c) is that of Y conducted to X. (b) and (f) are the common rank maps of X conducted to Y while (d) is that of Y conducted to X. (NCC: Number of common components). | ||
The mass spectra from NIST 107 mass spectral library and the resolution results of AMWFA are very similar and even the same (Fig. 4). Evidently, AMWFA method is extraordinary effective for qualitative analysis of embedded peak cluster even their spectra are very similar, just as peak 1 and peak 2 in this example. Furthermore, the chromatograms of those two peak clusters can be obtained using least square analysis according to the eqn (9) and eqn (10).
 | ||
| Fig. 4 Comparison between the mass spectra from NIST 107 database and the obtained resolution results by AMWFA. (a), (b) and (c): Identified pure mass spectra from the flat regions R1 to R3. (d), (e) and (f): The pure mass spectra from NIST 107 mass spectral library. | ||
4.2 Results of analysis of fatty acids in Type 2 diabetic patient's plasma
Fatty acids are considered to be important biomedical indicators of the abnormal lipid metabolism in Type 2 diabetes mellitus and many studies have been undertaken to investigate the changes of fatty acid profiles.25,26 Some embedded peaks maybe exist in the analysis of fatty acid profiles, just as Fig. 5 (a) shows. Based on the chromatographic shape, peak cluster I seems to be one-component chromatographic peak. At the same time, the comparison of the mass spectra through the whole peak region shows up that those mass spectra are very similar. In a basic analytical way, we may conclude there is only one component in this region. However, its retention time is the same as that of a 9-octadecenoic acid standard, while their mass spectra are absolute different. It is like a riddle. | ||
| Fig. 5 The total ionic chromatograms (TICs) of peak cluster I and peak cluster II from GC-MS data of fatty acids analyses. | ||
So, chemometric methods were employed to find out the answer. To calculated how many components were in the peak cluster, the rank estimation of sub-space comparison method was utilises, as shown in Fig. 6 (a). The lowest point is on the ‘2’, this suggests that there are two components in that region. In order to confirm the conclusion of rank estimation and detect peak purity of the two-dimensional data, fix-size moving window evolving factor analysis (FSMWEFA), so-called eigenstructure tracking analysis,27 was applied. The curve of logarithm values of eigenvalues higher than the noise level represents the appearance of components. If a studied system contains only one constituent, just one curve is higher than the noise level in its FSWMEFA plot. Otherwise, there are at least two curves higher than the noise level. From the FSWMEFA plot of peak cluster I (see in Fig. 6 (b)), there are two curves higher than the noise level and the second curve appears two tubers. According to the “first in-first out” hypothesis, there should only be one tuber for a two-component system. The FSWMEFA plot of the two-dimensional data in this study is obviously inconsistent with the hypothesis. It is the typical plot of embedded peaks.
 | ||
| Fig. 6 Components estimation of peak cluster I. (a). Rank estimation of peak cluster I. (b). The plot of evolving eigenvalues obtained using FSMWEA with a window size of five. The horizontal dashed lines represent the noise level. | ||
In order to further confirm the results obtained, all the chromatograms at every m/z point are investigated (shown in Fig. 7). From this figure, one can easily see that they really contain some embedded peaks from some selective m/z points.
 | ||
| Fig. 7 All the ionic chromatograms of peak cluster I in Fig. 5(a). | ||
The in-time and out-time of those two embedded peaks are almost the same. The former chemometric resolution methods, even those methods which focus on embedded peaks, such as SRAFDM, OPR, do not work for this case. The proposed method, alternative moving window factor analysis (AMWFA), will obtain satisfied resolution results if other data that has selective information of the embedded peaks is available. In this study, the embedded peaks were isolated by better chromatographic condition that cost additional time of more than 25 min for one sample (the TIC was shown in Fig. 5(b)), while resolution of this embedded peak cluster cost less than 5 min. The isolated peak cluster was selected as the base matrix (say as X). Then, the moving window searching was conducted on the embedded peak cluster (say as Y). The spectral auto-correlative curve and common rank map by AMWFA with a fixed window size 3 are shown in Fig. 8(a) and (b). In the common rank map, the two platforms with the number of common component is equal to 1 inform us of the selective regions of components because their corresponding eigenvectors are their pure spectra according to the method described above.
 | ||
| Fig. 8 Resolution results of AMWFA analysis of the data in Fig. 5. (a): Spectral auto-correlative curve of cluster II conducted to cluster I. (b): The common rank map of cluster II conducted to cluster I. (NCC: Number of common component) (c) and (d): The obtained mass spectra of R1 and R2 by AMWFA. | ||
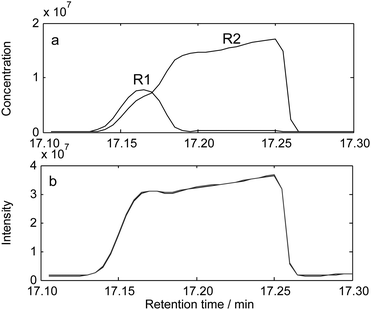
Furthermore, in the spectral auto-correlative curves, there are two corresponding regions, marked as R1 and R2 (shown in Fig. 8 (a)), whose values of similarities are very close to 1. It indicates that each of them is a one-component region. So, two pure spectra could be extracted from those two regions. Components in R1 cannot be found in the NIST 107 mass database and the component in R2 is identified to be oleic acid, the resolved mass spectra were shown in Fig. 8(c) and (d). The chromatograms of this embedded peak cluster were resolved by least square analysis. The result is satisfied and shown in Fig. 9.
 | ||
| Fig. 9 The resolution result of chromatogram for peak cluster I in Fig. 5. | ||
4.3 Results from the resolution of volatile components in Herba Houttuyniae
Herba Houttuyniae is a traditional medicinal plant which has been used for thousands of years for treatment of cough, leucorrhea, ureteritis and so on. Ketone, methyl nonyl is one of most important active components of Herba Houttuyniae volatile oil and the chromatographic elution time of this component is very clear, even the same with that of Bornyl acetate, just as Fig. 10(a) shows. It looks like a multiple components system. But HPLP failed to resolve it. The further investigation confirmed that it actually is an embedded system of two components. So, AMWFA was utilized to deal with this situation. Fig. 10(b) is the TIC curve of Herba Houttuyniae volatile oil under another chromatographic condition. The results of common rank analysis between the data pair are shown Fig. 11. It shows clearly that the number of common components is 2 for the data pair shown in Fig. 10 after analyzing their fitting values f(ak, bk) (see eqn (5)). Then, AMWFA method was employed to resolve the embedded peaks in Fig. 10 (a) using the selective information of peak cluster in Fig. 10 (b). The whole peak cluster II (Fig. 10 (b)) was selected as the base matrices. Then, the moving window searching was conducted on peak cluster I (Fig. 10(a)).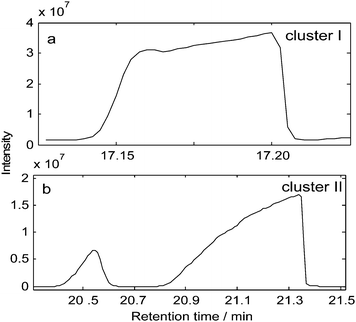 | ||
| Fig. 10 The total ionic chromatograms (TICs) of peak cluster I and peak cluster II from GC-MS data of Herba Houttuyniae volatile oil. | ||
 | ||
| Fig. 11 The result of common rank analysis. | ||
The results of scanning with a fixed window size 3 are shown in Fig. 12 including the spectral auto-correlative curves (Fig. 12(a) and Fig. 12(c)) and common rank maps (Fig. 12(b) and Fig. 12(d)). In the regions with the number of common components is equal to 1, namely R1 and R2 marked in Fig. 12(a) and 12(c), their corresponding eigenvectors are their pure spectra according to the method described above. In Fig. 13(a) and 13(b), the two identified pure mass spectra are shown, which are ketone, methyl nonyl and bornyl acetate, respectively through matching search from the NIST107 mass spectral library. The similarities are 0.9913 and 0.9653, respectively. The standard mass spectra of those two components were shown in Fig. 13(c) and Fig. 13(d). Then, the chromatograms of peak cluster I were resolved by least square analysis (shown in Fig. 14(a)). Furthermore, the TIC after resolution was compared with the original TIC. These two lines have almost superposed with each other (Fig. 14(b)). It proved that the resolution result of peak cluster I is credible.
 | ||
| Fig. 12 Spectral auto-correlative curves and common rank maps of AMWFA analysis of the data in Fig. 10. (a) and (b): The Spectral auto-correlative curves of cluster II conducted to cluster I (c) and (d): The common rank maps of cluster II conducted to cluster I. (NCC: Number of common components). | ||
 | ||
| Fig. 13 Comparison between the mass spectra from NIST 107 mass spectral library and the obtained resolution results by AMWFA. (a) and (b): Resolved pure mass spectra from the flat regions of R1 and R2 by AMWFA (c) and (d): The pure mass spectra from NIST 107 mass spectral library. | ||
 | ||
| Fig. 14 The resolution results of chromatogram and TIC for peak cluster I in Fig. 10. a. The resolution results of chromatograms for two common components in peak cluster I. b. The original and resolved TIC profiles for peak cluster I. (The dotted line is TIC after resolution and the solid line is original TIC). | ||
5. Conclusions
The most important thing in the resolution of embedded peaks is how to extract the selective information. The proposed AMWFA method could extract useful information from two or more analytical systems to resolve embedded peaks of GC-MS data. Its powerful abilities for information extraction make it to be an efficient tool of embedded peaks resolution. In addition, the idea of moving window technique was employed to improve sensitivity of this method when selective information is unclear or weak. So, more accurate results can be achieved even for a data pair with very similar spectra. The resolution results of the simulated data pair and two real GC-MS metabolomics dataset pairs have further proved the feasibility and veracity of this method. This method can not only greatly enhance the separation ability but also the qualitative identifying ability of the hyphenated chromatography, which shows the prosperous prospect for analysts to deal with very difficult problems in metabolomics and other research fields.Acknowledgements
This work is financially supported by the international cooperation project on traditional Chinese medicines of ministry of science and technology of China (No. 2007DFA40680), National Nature Foundation Committee of China (Grant No.20875104), China Postdoctoral Science Foundation funded project (No. 20080440181), Special Fundation of China Postdoctoral Science (No. 200902481), and Central South University Science Development Foundation (No. 10SDF22).References
- C. J. Xu, Y. Z. Liang and Y. Q. Song, et al. , Fresenius J. Anal. Chem., 2001, 371, 331–336 CrossRef CAS.
- P. J. Gemperline, J. Chem. Inf. Comp. Sci., 1984, 24, 206–212 CrossRef CAS.
- M. Maeder, Anal. Chem., 1987, 59, 527–530 CrossRef CAS.
- M. Maeder and A. Zilian, Chemom. Intell. Lab. Syst., 1988, 3, 205–213 CrossRef CAS.
- O. M. Kvalheim and Y. Z. Liang, Anal. Chem., 1992, 64, 936–946 CrossRef CAS.
- Y. Z. Liang, O. M. Kvalheim and H. R. Keller, et al, Anal. Chem., 1992, 64, 946–953 CrossRef.
- E. R. Malinowski, J. Chemom., 1992, 6, 29–40 CAS.
- E. R. Malinowski, J. Chemom., 1996, 10, 273–279 CrossRef CAS.
- R. Manne, H. L. Shen and Y. Z. Liang, Chemom. Intell. Lab. Syst., 1999, 45, 171–176 CrossRef CAS.
- H. L. Shen, R. Manne, Q. S. Xu, D. Z. Chen and Y. Z. Liang, Chemom. Intell. Lab. Syst., 1999, 45, 323–328 CrossRef CAS.
- B. Y. Li, Y. Z. Liang and Y. P. Du, et al., Chromatographia, 2003, 57, 235–243 CAS.
- X. N. Li, H. Cui and Y. Q. Song, et al, Phytochem. Anal., 2003, 14, 23–33 CrossRef CAS.
- F. Q. Guo, J. Chromatogr., A, 2003, 1016, 99–110 CrossRef CAS.
- S. Y. Wei, C. J. Xu and D. K. W. Mok, et al, J. Chromatogr., A, 2008, 1187, 232–238 CrossRef CAS.
- Y. Z. Liang, White, Grey and Black Multicomponent Systems and Their Chemometric Algorithms, Hunan Publishing House of Science and technology, Changsha, Hunan, 1996 Search PubMed.
- Y. Z. Liang and O. M. Kvalheim, Anal. Chim. Acta, 1994, 292, 5–15 CrossRef CAS.
- S. F. Cuesta, S. C. Rutan, N. D. G. Garcia and D. L. Massart, Chemom. Intell. Lab. Syst., 1997, 36, 153–164 CrossRef CAS.
- Z. D. Zeng, Y. Z. Liang and Y. L. Wang, et al. , J. Chromatogr., A, 2006, 1107, 273–285 CrossRef CAS.
- Y. Hu, Y. Z. Liang and L.B.Y.e. al, J. Agric. Food Chem., 2004, 52, 7771–7776 CAS.
- F. Q. Guo, Y. Z. Liang and L. F. Huang, et al. , Chem. J. Chinese University, 2004, 3, 430–435 Search PubMed.
- Y. L. Wang, Y. Z. Liang, Y. Hu, B. Y. Li, Z. D. Zeng and Y. K. He, Chemom. Intell. Lab. Syst., 2006, 82, 229–235 CrossRef CAS.
- I. T. Jolliffee, Principal Component Analysis, Springer Verlag, New York, 1986 Search PubMed.
- H. R. Keller and D. L. Massart, Anal. Chim. Acta, 1991, 246, 379–390 CrossRef CAS.
- Chinese Pharmacopoeia Committee, Chinese Pharmacopoeia, Chemical Industry Press, 2000 Search PubMed.
- C. Wang, H. W. Kong and Y. F. Guan, et al. , Anal. Chem., 2005, 77, 4108–4116 CrossRef CAS.
- J. Yang, G. W. Xu and Q. F. Hong, et al. , J. Chromatogr., B: Anal. Technol. Biomed. Life Sci., 2004, 813, 53–58 CrossRef CAS.
- Y. Z. Liang, O. M. Kvalheim, A. Rahmani and R. G. Brereton, J. Chemom., 1993, 7, 15–43 CAS.
| This journal is © The Royal Society of Chemistry 2010 |