Comparative study of the three sol–gel based solid phase microextraction fibers in extraction of BTEX from water samples using gas chromatography-flame ionization detection
Ali
Sarafraz-Yazdi
*a,
Hamed
Piri moghadam
a,
Zarrin
Es'haghi
b and
Soroosh
Sepehr
a
aDepartment of Chemistry, Faculty of Sciences, Ferdowsi University of Mashhad, Iran. E-mail: asyazdi@ferdowsi.um.ac.ir; Fax: + 98 511 8438032; Tel: + 98 511 8432023
bDepartment of Chemistry, Faculty of Sciences, Payame Noor University, Iran
First published on 30th April 2010
Abstract
Thermally stable SPME sol–gel based fibers were made and applied as a sorbent onto the home made SPME holder for extraction of BTEX from water samples. Three different sol-gel coatings were made: non-polar, polar and polar reinforced with multi-walled carbon nanotubes and used as the bonded phase on the surface of the fibers. Extraction efficiency of carbon nanotubes reinforced fiber was approximately 7 times more than non-polar and 2 times more than polar fiber at the same conditions. Linear ranges, detection limits and analytes pre-concentration factors were determined. Repeatability and reproducibility of these fibers were also compared with each others.
Introduction
Volatile organic compounds (VOCs) are organic chemical compounds that have high enough vapor pressure under normal conditions to significantly vaporize and enter to the atmosphere. BTEX is a group term for benzene, toluene, ethyl benzene, and xylene which are among the volatile organic hydrocarbons (VOHs) that are found in petroleum derivatives such as petrol (gasoline). BTEX compounds are well-known due to the contamination of soil and groundwater with these compounds. BTEX can have major affects on the central nervous system. Some extraction methods such as single drop microextraction (SDME),1 hollow fiber liquid phase microextraction (HF-LPME)2 and solid phase microextraction (SPME)3 have been already reported for the determination of BTEX from water samples.SPME is an innovative, solvent free extraction method that is fast, economical and versatile and was introduced in the early 1990s.4 In this technique a small amounts of the sorbent dispersed on a solid support, is exposed to the sample for a well defined period of time.5 In addition, this extraction technique can be easily coupled to gas chromatography (GC) and high-performance liquid chromatography (HPLC).6 The extraction efficiency of SPME fibers are determined by different types of intermolecular and steric interactions between the analyte species and the extractor phases. Thus, selective extraction of analytes can be achieved based on their polarity, hydrophobicity, chemical composition, shape/size etc.7 In spite of the advantages of this technique; there are some drawbacks with conventional SPME fibers:
I - Thermal and solvent instability of fibers. The absence of appropriate chemical bonding between the polymeric coating and fiber surface could be responsible for low thermal and solvent stability of these coated SPME fibers.8
II - Life time of the fibers is less than 20–30 times due to stripping of coatings.
III - Carry over is a limiting factor because the temperature cannot be raised enough and residue from previous extractions is left on the fiber.
IV - Solid support is the fragile fused silica and should be handled carefully.
Amongst the different approaches to coating development for SPME fibers, the sol–gel coating technique offers important advantages compared to conventional SPME coatings. The inherent advantages of sol–gel process are: better homogeneity, higher purity, lower temperature of preparation, good mixing properties, better control of particle size, and the possibility of creating hybrid organic–inorganic materials and thereby good chromatographic selectivity, stability of the stationary phase.
The use of sol–gel technology in SPME fibers has been reported recently for the preparation of fibers with enhanced thermal stability for GC.9 Polyethylene glycol coated SPME fibers using sol–gel technology have also been reported.10 Later on, Pawliszyn and co-workers reported a novel fiber using carbon nanotubes, CNTs as an extractant phase.11
Carbon nanotubes (CNTs) are a new type of carbon material.12 Because of their unique geometry/structure, they exhibit excellent mechanical, thermal properties and have a very large surface area which makes them potentially useful in nanotubes-reinforced materials, as the sorbents for SPME. Therefore, we decided to promote the SPME technique by dispersing multiwalled carbon nanotubes (MWCNTs) into the coatings. In this work three different SPME fibers based on sol–gel technique were made and compared from analytical application point of views. For the first time a polar coating (PEG modified with carbon nanotubes) was prepared and applied for the extraction of BTEX from the water samples. The results have shown excellent extraction efficiencies with high pre-concentration factors in case of PEG/CNTs coating for BTEX in the environmental water samples.
Experimental
Reagents and standards
Hydroxy-terminated poly(dimethylsiloxane) (PDMS) and poly(ethyleneglycol) (PEG) were purchased from Flucka (Buchs, Switzerland) and methyltrimethoxysilane (MTMOS) and trifluoroacetic acid (TFA) and poly(methylhydrosiloxane) (PMHS) were purchased from Merck (Darmestadt, Germany). Benzene, toluene, ethylbenzene and O-xylene were also purchased from Merck. A stock solution of BTEX (2000 μg mL−1) was prepared in the methanol and stored in a refrigerator at 4 °C. Fresh working solutions were prepared daily by diluting the stock solution in distilled water.GC analysis
Gas chromatographic analysis was carried out using a Chrompack CP9001 (Middleburg, the Netherlands) fitted with a split/splitless injector and flame ionization detector (FID). Helium (99.999%, Sabalan Co., Tehran, Iran) was used as the carrier gas.To focus the analytes at the head of the column for reducing the band broadening, the flow rate of the carrier gas was 0.5 mL min−1 for the first 15 s, and then was increased up to 1.5 mL min−1 for 30 s, and then kept constant at 1 mL min−1 until the run time of GC was finished. The column was also held at 40 °C for 5 min, this temperature programming was led to the well defined and sharp peaks. Separations were conducted using a CP-Sil 5 capillary column, WCOT Fused silica and 30 m × 0.25 mm i.d. with 0.25μm stationary film thickness (Chrompack, Middelburg, and the Netherlands). The column was held at 40 °C for 5 min, then increased to 60 °C at a rate of 10 °C min−1 and kept constant for 1 min and then raised to 100 °C at 10 °C min−1. The temperature was kept at this temperature for 1 min, then raised to 160 °C at 20 °C min−1 and finally kept constant for 3 min. The total time for each GC run was 16 min. The detector temperature was set at 200 °C and split-less mode of injection performed. The air flow rate (99.99%, Sabalan Co., Tehran, Iran) for FID was 250 mL min−1 and the hydrogen flow rate was 25 mL min−1. The temperature of the injection port was held at 250 °C.
Fiber pretreatment
Prior to coating the SPME fiber with sol–gel technique, the protective polyimide layer of a 2 cm-long fused-silica fiber (GC capillary column) was removed from the last 1 cm of the segment by burning with flame. Then the fiber was dipped into 1 M NaOH solution for 1 h, to activate the surface of the fiber with producing silanol groups on it, and then it was washed with water. Finally, the fiber was placed into 0.1 M HCl solution for 30 min to neutralize the excess of NaOH, then washed again with water and dried in the Oven.Preparation of non-polar fiber
The sol solution was prepared according to Malik group9,13 with some revision as follows: 100 mg of PDMS was added to 100 μL methylene chloride in an Eppendorf tube and dissolved by ultrasonic agitation (Branson 1510 at 42 KHz) for 5 min. 100 μL MTMOS, and 40 μL PMHS were added to the solution and mixed thoroughly for 5 min. Then approximately 40 μL TFA containing 1% water was sequentially added to the resulting solution with ultrasonic agitation for 3 min. At this stage, treated fused silica was dipped vertically into the sol solution for optimized time of 30 min and gel coating was formed on the activated outer surface of the fused silica. If a mixture of gel and sol was produced, it was centrifuged at 15000 rpm for 3 min to cause sedimentation of the gel and then the clear sol solution was separated and used for fiber coating. After 30 min the fiber was removed and placed into desiccators for the next 30 min. This coating process was repeated three times until the desired thickness of the coating was obtained. It was experimentally confirmed that after three times repeating the coating process, our adsorption data were more reproducible and efficient. The produced fiber was then placed into the desiccators at room temperature for 24 h. The latter process is named aging. The final step is drying; in this step fiber was placed into GC oven at 50 °C for 10 min, after that temperature was raised to 300 °C at 1 °C min−1 and kept constant for 10 min at the final temperature. Then oven should be cooled gradually to 40 °C. This cooling process reduces the probability of any breakage of the fiber coating.Preparation of polar fiber
The sol solution was prepared as follows according to the method developed by Wang10 100 mg polyethylene glycol was added to 100 μL MTMOS in an Eppendorf tube and dissolved thoroughly by ultrasonic agitation for 5 min. Then approximately 70 μL volume TFA containing 1% water was sequentially added to the solution and the mixture was sonicated for next 3 min. Further steps are same as non polar fiber (2.3.1 section).Preparation of polar fiber modified with carbon nano-tubes
MWCNTs with outer diameter dp ≤ 20 nm were selected as sorbent modifier in this study. The length of MWCNTs was in the range 5–15 μm and MWCNTs purity was greater than 95%.These data were provided by the manufacturer (Research Institute of Petroleum Industry, Tehran, Iran). As already reported the functionalization of the CNTs is used to generate functional groups (e.g., –COOH, –OH, or –CO).14For CNTs functionalization, MWCNTs were thermally treated using an oven at 350 °C for 30 min to remove amorphous carbon. After thermal treatment, half a gram of CNTs was dispersed into a flask containing 20 mL of 70% sodium hypochlorite solution (6 mL H2O + 14 mL NaOCl). The solution was then shaken in an ultrasonic cleaning bath for 20 min and heated at 85 °C in a water bath for 3 h, to remove metal species. After cooling, the CNTs were washed with deionized water until the pH of the solution reached 7. Finally, the solution was filtered through a 0.45 μm nylon fiber filter and purified functionalized CNTs were obtained.
NaOCl oxidized MWCNTs were selected as sorbents in an aqueous solution. This modification on the MWCNTs possesses a better sorption performance for the analytes. As it is done in the previous work, the MWCNTs (NaClO) appear to be the most effective sorbents, in comparison with the other ones such as MWCNTs (HNO3), MWCNTs (H2SO4) and untreated MWCNTs.
The sol solution was prepared as follows: 100 mg polyethylene glycol and 5 mg functionalized CNTs were added to 100 μL MTMOS in an Eppendorf tube and thoroughly dissolved by ultrasonic agitation for 10 min. Then approximately 70 μL TFA containing 1% water was sequentially added to the resulting solution with ultrasonic agitation for 3 min. Then treated fused silica was dipped vertically into the sol solution for different times (20 to 80 min.) —the optimal time was found to be 60 min. At this stage of the process, the desired thickness was obtained and repeating the process is not required. The aging and drying processes were carried out the same as non polar fiber.
Headspace SPME procedure
%10 NaCl (w/v) solution which was spiked with the appropriate amount of analytes in a standard 15 mL vial containing 10 mL water sample and a magnetic stir bar. To prevent sample evaporation, the vial was sealed. During the extraction, the film was pierced by protecting needle and the fiber was exposed to the gas phase. The evaporated molecules of analytes were adsorbed from the head space onto the fiber, and after the optimal extraction period adsorbed analytes were directly thermally desorbed by inserting the fiber into the injection port of the GC.Results and discussion
Factors affecting the extraction efficiency such as extraction temperature, extraction time, stirring speed and salt effect and some instrumental parameters such as initial temperature, initial time, velocity of carrier gas, desorption time and temperature of injection port were optimized. The optimization process was carried out on the solution contain 100 ng mL−1 of each of the BTEX compounds. The chromatographic peak area, which is related to the number of extracted moles of analytes, was used to evaluate the extraction efficiency under different experimental conditions. All of the optimization processes were carried out with PDMS (non-polar) fiber, because critical parameters are instrumental and the others such as; stirring speed, salt effect, etc… are related to the analytes and approximately independent of the fibers.Optimization of factors affecting the extraction efficiency
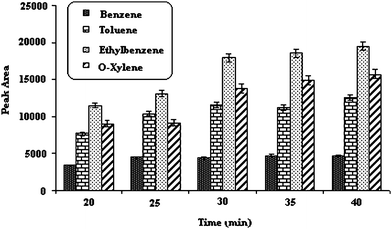 | ||
| Fig. 1 Effect of extraction time. Temperature of injection port; 250 °C, 5% (w/v) salt, desorption time; 15 Sec, stirring speed; 800 rpm, extraction temperature; 45 °C. | ||
Because SPME is not exhaustive extraction method and its adsorbent surface is so small, the time taken for extraction equilibration is fast. An extraction time of 30 min was finally chosen as the optimal time for the subsequent evaluations.
Temperature range of 30–65 °C was used to study the effect of this parameter on the extraction efficiency of analytes. As shown in Fig. 2, up to 40 °C, the extracted quantity of BTEX increased because of increasing diffusion rate of the analytes into the head space, but afterward the effect of analyte distribution between head space and fiber was dominant and the analyte distribution constant (Khf) was decreased which caused the desorption of the analytes from the fibers.
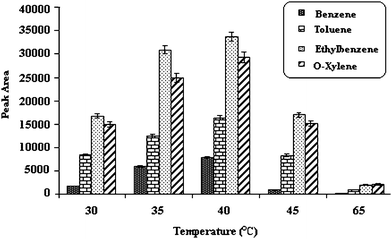 | ||
| Fig. 2 Effect of extraction temperature. Temperature of injection port; 250 °C, 5% (w/v) salt, desorption time; 15 Sec, stirring speed 800 rpm, time of extraction; 30 min. | ||
As, it was shown in Fig. 3 the peak area for all of the analytes increased when the stirring speed was increased to 700 rpm. It was also observed that at higher stirring speeds, the extraction efficiency decreased. It is probably due to the magnetic stirrer hitting the wall of the vial, leading to instability in the stirring of the solution and as a consequence changes in the position of the fiber. Hence, the stirring speed of 700 rpm was chosen as the optimal one.
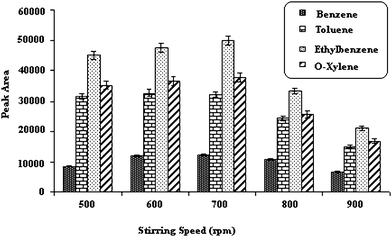 | ||
| Fig. 3 Effect of stirring speed. Temperature of injection port; 250 °C, 5% (w/v) salt, desorption time; 15 Sec, extraction temperature; 40 °C, time of extraction; 30 min. | ||
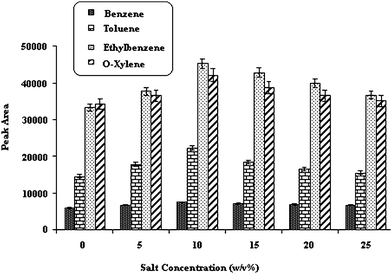 | ||
| Fig. 4 Effect of the salt. Temperature of injection port; 250 °C, desorption time; 15 Sec, extraction temperature; 40 °C, stirring speed; 700 rpm, Time of extraction; 30min. | ||
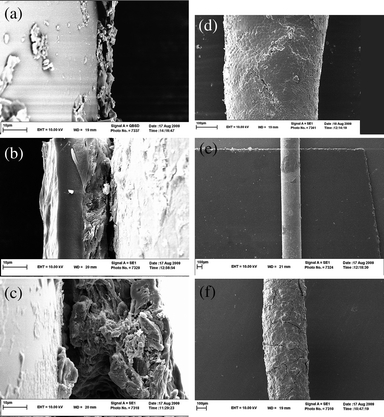 | ||
| Fig. 5 SEMs of three fibers; (a and d) PDMS with 10 and 100 μm scale, (b and e) PEG with 10 and 100 μm scale, (c and f) PEG/CNT with 10 and 100 μm scale respectively. | ||
| Analytes | Linear range a | LOD b | LOQ c | Correlation Coefficient (r2) | RSD (%) one fiber (Repeatability, n = 3) | RSD (%) batch to batch (Reproducibility, n = 3) | Fiber |
|---|---|---|---|---|---|---|---|
| a ng mL−1. b Limit of detection for S/N = 3 (ng mL−1). c Limit of quantification for S/N = 10 (ng mL−1). | |||||||
| Benzene | 20–2000 | 10 | 20 | 0.9992 | 3.12 | 6.67 | PDMS |
| 1–2000 | 0.8 | 1 | 0.9999 | 4.29 | 6.01 | PEG | |
| 1–2000 | 0.8 | 1 | 0.9999 | 7.06 | 8.42 | PEG/nano tube | |
| Toluene | 0.1–2000 | 0.05 | 0.1 | 0.9994 | 3.08 | 5.11 | PDMS |
| 0.02–2000 | 0.008 | 0.02 | 0.9997 | 4.31 | 9.04 | PEG | |
| 0.02–2000 | 0.005 | 0.02 | 0.9999 | 5.01 | 6.32 | PEG/nano tube | |
| Ethylbenzene | 0.05–2000 | 0.01 | 0.05 | 0.9997 | 2.96 | 2.26 | PDMS |
| 0.005–2000 | 0.002 | 0.005 | 0.9993 | 4.57 | 8.21 | PEG | |
| 0.002–2000 | 0.001 | 0.002 | 0.9997 | 4.68 | 5.87 | PEG/nano tube | |
| O-Xylene | 0.05–2000 | 0.02 | 0.05 | 0.9996 | 4.16 | 5.16 | PDMS |
| 0.005–2000 | 0.002 | 0.005 | 0.9991 | 3.44 | 8.35 | PEG | |
| 0.002–2000 | 0.001 | 0.002 | 0.9994 | 4.94 | 6.52 | PEG/nano tube | |
Of course, the sol–gel coatings possess porous structures which should significantly increase the surface area availability on the fibers. Consequently, even an apparently thinner coating will be able to provide enhanced analyte loading and, therefore, high sample capacity of fiber.
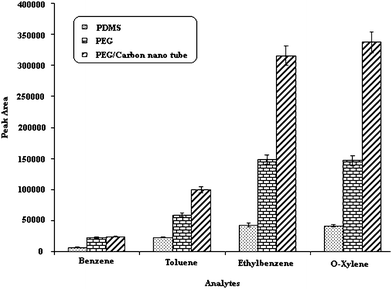 | ||
| Fig. 6 Comparison of three fibers. Temperature of injection port; 250 °C, desorption time; 15 Sec, extraction temperature; 40 °C, stirring speed; 700 rpm, Time of extraction; 30 min. | ||
Limits of detection (LODs) of the analytes were determined experimentally, by decreasing the concentration of spiked samples until signal to noise ratio (S/N) of 3 was obtained.
Three fibers have a good repeatability (lower than 5), but reproducibility (relative standard deviation between fiber or batch to batch) for the non polar fiber is better than the others, because formation of the gel on the fused silica for PDMS fiber is slower than with the PEG and PEG/CNTs coatings. The slower gel formation process allows greater control over the coating giving a more reproducible fiber across different batches for PDMS.
Pre-concentration factors for three fibers are also shown in Table 2. For the determination of these factors, peak area after extraction of 100 ng mL−1 of each BTEX compounds should be divided by the peak area before extraction, under the same conditions. For example both of them should be injected with same syringe and same volume. For doing this, after extraction of analytes onto the fibers, analytes were desorbed with 200 μL of methanol and 2 μL of this solution was injected into GC, then the peak area after extraction was divided by the peak area before extraction multiplied by the dilution factor. It can be seen that the polar fiber modified with carbon nanotubes has the highest extraction efficiency.
| Methods | Linear range/ng mL−1 | LOD/ng mL−1 | RSD | E.F. | References |
|---|---|---|---|---|---|
| IL-SDME | 0.020–0.091 | — | 3.00–5.20 | — | 15 |
| SDME | 10–20000 | 0.8–7 | 1.81–2.47 | 143–312 | 1 |
| HF-LPME | 20–20000 | 5–30 | 2.02–4.61 | 41–128 | 2 |
| HS-SPME | — | 0.0004–0.002 | 6.60–12.80 | — | 16 |
| Sol–Gel-SPME | 4.0–80 | 0.2–0.7 | 5.00–7.90 | — | 17 |
| HS-SPME | — | 0.02–1.1 | 2.60–8.50 | — | 18 |
| CNT-Sol–Gel-SPME | 0.01–5.0 | 0.01 | ≥ 0.992 | — | 19 |
| SPME with non polar fiber | 0.05–2000 | 0.01–10 | 2.96–4.16 | 628–733 | This study |
| SPME with polar fiber | 0.005–2000 | 0.002–0.8 | 3.44–4.57 | 1606–2310 | This study |
| SPME with polar fiber modified with CNT | 0.002–2000 | 0.001–0.8 | 4.68–7.06 | 2337–4701 | This study |
| Analytes | River water |
|---|---|
| Concentration/ng ml−1 | |
| Benzene | — |
| Toluene | — |
| Ethyl benzene | 3.21 |
| O-Xylene | 3.54 |
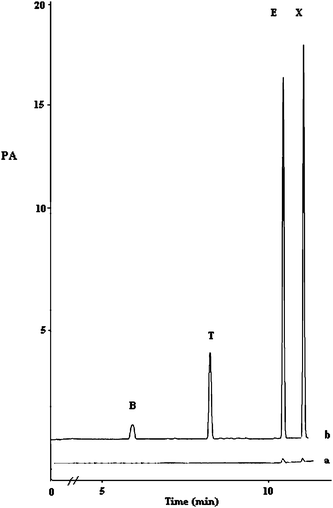 | ||
| Fig. 7 Chromatogram of BTEX compounds in river water spiked with 100 ng mL−1 of each analyte for non polar fiber. | ||
Conclusion
Fused-silica fiber coated by sol–gel technology has been shown to be a powerful coating for extracting trace amounts of BTEX dissolved in aqueous samples. Possessing sol–gel with three dimensional networks provide higher specific surface area and loading capacity. Due to formation of chemical bonds between solid support (fiber) and extractants some of the problems faced in conventional SPME, e.g. instability of analytes’ physical bonding with sorbent, were overcome using the sol–gel modified technology. Memory effect and thermal instability were reduced with these fibers and the life times of the fibers are increased to by than 100-fold. Also using CNTs as a sorbent modifier accompanied with other coating material such as PEG caused the significant extraction efficiency.Acknowledgements
The authors are grateful to Ferdowsi university of Mashhad, Iran for financial support.References
- A. Sarafraz-Yazdi, A. H. Amiri and Z. Es'haghi, Talanta, 2009, 78, 936–941 CrossRef CAS.
- A. Sarafraz-Yazdi, A. H. Amiri and Z. Es'haghi, Chemosphere, 2008, 71, 671–676 CrossRef CAS.
- Y. Hu, Y. Fu and G. Li, Anal. Chim. Acta, 2006, 567, 211–217 CrossRef CAS.
- J. Pawliszyn and C. L. Arthur, Anal. Chem., 1990, 62, 2145–2151 CrossRef CAS.
- J. Pawliszyn and Z. Zhang, Anal. Chem., 1993, 65, 1843–1852 CrossRef CAS.
- Y. Fan, M. Zhang and Y. Feng, J. Chromatogr., A, 2005, 1099, 84–91 CrossRef CAS.
- J. Pawliszyn, M. Ábalos and J. M. Bayona, J. Chromatogr., A, 2000, 873, 107–115 CrossRef CAS.
- J. Pawliszyn, D. Louch and S. Motlagh, Anal. Chem., 1992, 64, 1187–1199 CrossRef CAS.
- S. L. Chong, D. Wang, J. D. Hayes, B. W. Wilhite and A. Malik, Anal. Chem., 1997, 69, 3889–3898 CrossRef CAS.
- Z. Wang, C. Xiao, C. Wu and H. Han, J. Chromatogr., A, 2000, 893, 157–168 CrossRef CAS.
- J. Pawliszyn, R. Jiang, F. Zhu, T. Luan, Y. Tong and H. Liu, J. Chromatogr., A, 2009, 1216, 4641–4647 CrossRef.
- S. Iijima, Nature, 1991, 354, 56–58 CrossRef CAS.
- D. X. Wang, S. L. Chong and A. Malik, Anal. Chem., 1997, 69, 4566–4576 CrossRef CAS.
- L. Dai, P. He and S. Li, Nanotechnology, 2003, 14, 1081–1097 CrossRef CAS.
- J. Pawliszyn and R. Eisert, Crit. Rev. Anal. Chem., 1997, 27, 103–108 CrossRef.
- M. Valcárcel, E. Aguilera-Herrador, R. Lucena and S. Cárdenas, J. Chromatogr., A, 2008, 1201, 106–111 CrossRef CAS.
- K. Elke, E. Jermann, J. Begerow and L. Dunemann, J. Chromatogr., A, 1998, 826, 191–200 CrossRef CAS.
- K. Farhadi, M. Mamaghanian and R. Maleki, J. Hazard. Mater., 2008, 152, 677–682 CrossRef CAS.
- I. Arambarri, M. Lasa, R. Garcia and E. Millán, J. Chromatogr., A, 2004, 1033, 193–203 CrossRef CAS.
| This journal is © The Royal Society of Chemistry 2010 |
