Determination of EPA's priority pollutant polycyclic aromatic hydrocarbons in drinking waters by solid phase extraction-HPLC†
Maria Concetta
Bruzzoniti
*a,
Martino
Fungi
b and
Corrado
Sarzanini
a
aDepartment of Analytical Chemistry, University of Torino, Via P. Giuria, 5, 10125, Torino, Italy. E-mail: mariaconcetta.bruzzoniti@unito.it; Fax: +39 011 6707615; Tel: +39 011 6707844
bCentro Ricerche SMAT Società Metropolitana Acque di Torino S.p.A., Corso XI Febbraio 14, 10152, Torino, Italy
First published on 24th March 2010
Abstract
A solid phase extraction (SPE) coupled with a liquid chromatographic procedure with fluorimetric detection was established for the determination of PAHs, priority pollutants listed by EPA (acenaphthene, fluorene, phenanthrene, anthracene, fluoranthene, pyrene, benzo(a)anthracene, chrysene, benzo(b)fluoranthene, benzo(k)fluoranthene, benzo(a)pyrene, dibenzo(a,h)anthracene, benzo(g,h,i)perylene, indeno(1,2,3-c,d)pyrene) in waters intended for human consumption. Acting on wavelengths detection, significant improvements on limits of quantitation were achieved: worthy of note is the 40-fold enhancement of sensitivity obtained for benzo(g,h,i)perylene, whose concentration is regulated by the European Community (EC) Directives. The SPE procedure was optimized for some parameters including solvent volumes for cartridge conditioning, sample volumes, presence of methanol in the sample, obtaining significant recovery enhancement also for low-boiling PAHs, phenanthrene and anthracene, whose determination is hampered by their high vapor pressure and Henry's law constant values. Advantages of this procedure are low quantitation limits (0.04–1 ng L−1), reduced solvent volumes used (and disposed), reduced analysis times that enable the processing of 24 samples per day, and a lower cost of the whole analysis. The whole analysis protocol enabled the determination of PAHs in drinking waters at concentrations lower than 1 ng L−1, two orders of magnitude lower than what is currently required by the EC Directive. The protocol derived was validated for its accuracy inside an inter-laboratory study and it is now currently routinely applied for PAHs analysis by the laboratory in charge of monitoring drinking water in the Italian city of Torino.
1. Introduction
Polycyclic aromatic hydrocarbons (PAHs) are ubiquitous pollutants classified as carcinogenic compounds and consequently monitored worldwide in several environmental matrices, including drinking water where their presence is mainly due to the surface and/or groundwater used as raw water sources. In fact, owing to their high hydrophobicity, PAHs can be rapidly adsorbed by the organic matter of soils and sediments that in turn become the main sinks for PAHs in the environment and hence for waters.1 Due to their toxicity, EPA and WHO identified within the PAHs class, 16 compounds defined priority pollutants.The European Community Directive 98/83/CE states a maximum value of 0.1 μg L−1 for PAHs in drinking waters expressed as the sum of benzo(b)fluoranthene, benzo(k)fluoranthene, benzo(ghi)perylene and indeno(1,2,3-cd)pyrene. As far as Italian legislation is concerned, a limit of 0.01 μg L−1 is also set for benzo(a)pyrene.2
The determination of PAHs in aqueous samples, and especially in drinking waters, is rather difficult as their concentrations in water are extremely low due to their low solubility.
EPA methods for the determination of PAHs in water samples include gas chromatography with flame ionization detection (GC–FID) and high-performance liquid chromatography (HPLC) with either UV or fluorescence detection. A survey of the available methods, including the newest EPA report, published in 2007, is given by Wolska.3 Also in current research literature, the gas chromatographic and liquid chromatographic techniques have become the most widely spread modes of chromatography for PAHs.4,5
In recent decades, the implementation of preconcentration steps prior to the analytical determination of trace level PAHs has been explored in considerable depth6,7 and actually, the detection limits achievable greatly depend upon the methodology of extraction as well as upon separation and detection parameters. It is accepted that non polar compounds are preferably extracted by octadecylsiloxane-bonded silica sorbents rather than porous polymer sorbents8 due to the ease of cavity formation that favors retention. The effect of solvents in determining the selectivity of the sorbent towards analytes, as well as the developments in solid phase microextraction, have been extensively reviewed by Huck and Bonn.9Among the solid-phase extraction (SPE) methods, several sorbents like multiwalled carbon nanotubes,10 coordination polymers,11 and immunosorbents12 have been evaluated either in the on-line or off-line configurations allowing detection limits ranging between 0.005 μg L−1 (anthracene) and 0.06 μg L−1 (acenaphthylene),10 0.002 μg L−1 (naphthalene) and 0.014 μg L−1 (benzo(g,h,i)perylene),11 0.3 ng L−1 (benzo(k)fluoranthene) and 12 ng L−1 (benzo(g,h,i)perylene).12
It is important to emphasize that not all the published works included the 16 EPA priority PAHs or were able to carry out individual quantitation of all the compounds, as the chromatographic separation was not complete for some analytes; moreover, in several instances high background noise or drifts are present in highly disturbed chromatograms. Interesting approaches using microextraction techniques with detection limits ranging from 0.004–0.247 μg L−113 and 0.001–0.006 μg L−114 have been presented but only four or five selected analytes were considered.
The aim of this paper was to optimize an SPE method followed by HPLC separation with fluorescence detection for routine analysis of the PAHs priority pollutants listed by EPA in drinking water samples. Considerable improvements (in terms of detection limits, solvent wastes and number of samples processed) over current existing methods were achieved acting on the main parameters involved both in the detection and in the extraction conditions, with only naphthalene being unretained. The accuracy of the method was checked by an inter-laboratory study. The sensitivity of the procedure developed is successful for the monitoring of PAHs in drinking water, well below the maximum concentration levels set by the EC Directive.
2. Experimental
2.1 Instrumentation and apparatus
Chromatographic equipment from Dionex (Sunnyvale, CA, USA) consisting of a Solvent Rack SOR 100 degassing module, a P680 sequential pump with a Thermostatted Column Compartment TCC-100, an ASI-100 Automated Sample Injector autosampler (5 μL sample volume injected) and a RF-2000 fluorimetric detector was used. Chromatographic data were aquired by a Chromeleon Chromatography Management System (Dionex). The chromatographic column was a Supelcosil LC-PAH (2.1 × 250 mm, 5 μm) preceded by a guard column Supelguard LC-18 all by Supelco (Bellefonte, Pennsylvania, USA). The matrix of the column is silica gel (particle size 5 μm, pore size 120 Å); this column was specifically designed for analyses of the priority pollutant PAHs.15 During the elution, temperature was kept at 30 °C and flow rate at 0.4 mL min−1.2.2 Reagents and solutions
Gradient grade acetonitrile for HPLC (ProLabo, VWR International S.r.l., Milan, Italy), methanol Chromasolv (Sigma Aldrich), and dichloromethane (J.T. Baker) were used. For eluent preparation, ultrapure water (18.2 MΩ·cm resistivity at 25 °C) obtained by a Milli-Q (Millipore) filtered with 0.22-μm filters was used.Standard solutions were obtained by proper dilution of 200 mg L−1 solution in acetonitrile containing a mixture of the 16 PAHs listed by EPA (Fig. 1). This mixture was purchased from AccuStandard (USA). The diluted solutions were stored in dark vials at 4 °C to avoid photo-degradation of PAHs.
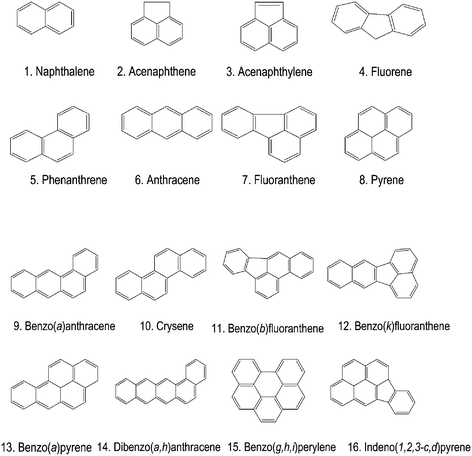 | ||
| Fig. 1 Chemical structure of EPA's 16 priority pollutant polycyclic aromatic hydrocarbons (PAHs). | ||
2.3 Preconcentration
Solid-phase extraction was performed using a Visiprep SPE Vacuum Manifold (Supelco). The Rotavapor used was from Buchi. The SPE cartridges were polypropylene BakerBond SPE C18 (1000 mg/6 mL) from J.T. Baker. Each conditioning step was performed at 5 mL min−1, whereas sample loading at 10 mL min−1. For each procedure investigated, a mixture containing 0.05 μg L−1 of each PAH was analyzed and six replicates were processed to assess reproducibility.3. Results and discussion
3.1 Separation and detection conditions
The separation of PAHs was obtained by the following gradient program: 0–6 min CH3CN–H2O (60![[thin space (1/6-em)]](https://www.rsc.org/images/entities/char_2009.gif) :
:![[thin space (1/6-em)]](https://www.rsc.org/images/entities/char_2009.gif) 40); 6–30 min from CH3CN–H2O (60
40); 6–30 min from CH3CN–H2O (60![[thin space (1/6-em)]](https://www.rsc.org/images/entities/char_2009.gif) :
:![[thin space (1/6-em)]](https://www.rsc.org/images/entities/char_2009.gif) 40) to 100% CH3CN; 30–34 min 100% CH3CN; 34.1 min CH3CN–H2O (60
40) to 100% CH3CN; 30–34 min 100% CH3CN; 34.1 min CH3CN–H2O (60![[thin space (1/6-em)]](https://www.rsc.org/images/entities/char_2009.gif) :
:![[thin space (1/6-em)]](https://www.rsc.org/images/entities/char_2009.gif) 40). The gradient composition, programmed to gradually increase the elution strength was optimized to elute the more retained analytes. At these conditions, the elution was accomplished within 32 min.
40). The gradient composition, programmed to gradually increase the elution strength was optimized to elute the more retained analytes. At these conditions, the elution was accomplished within 32 min.
The sensitivity of the method is greatly dependent on the detection conditions used; U.S. E.P.A. Method 550.116 only suggests using the fluorescence detector for excitation at 280 nm and emission greater than 389 nm cutoff. Preliminary measurements were performed at the wavelength conditions reported in Table 1. A typical chromatogram obtained is shown in Fig. 2(a) where it is possible to see that acenaphthylene does not fluoresce17,18 and that some analytes, i.e., naphthalene, fluorene, phenanthrene and benzo(g,h,i)perylene, exhibit low fluorescence that makes it difficult to quantitate at low concentration levels. This is an important drawback especially for the determination of benzo(g,h,i)perylene which is listed in the European Community Directive.
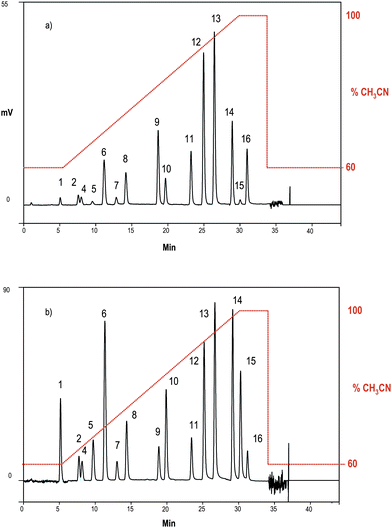 | ||
Fig. 2 The optimization of the detection conditions. Column: Supelguard LC-18, Supelcosil LC-PAH (2.1 × 250 mm), 5 μm; Gradient elution (dotted line, right-side axis): 0–6 min CH3CN–H2O (60![[thin space (1/6-em)]](https://www.rsc.org/images/entities/char_2009.gif) : :![[thin space (1/6-em)]](https://www.rsc.org/images/entities/char_2009.gif) 40); 6–30 min from CH3CN–H2O (60 40); 6–30 min from CH3CN–H2O (60![[thin space (1/6-em)]](https://www.rsc.org/images/entities/char_2009.gif) : :![[thin space (1/6-em)]](https://www.rsc.org/images/entities/char_2009.gif) 40) to 100% CH3CN; 30–34 min 100% CH3CN; 34.1 min CH3CN–H2O (60 40) to 100% CH3CN; 30–34 min 100% CH3CN; 34.1 min CH3CN–H2O (60![[thin space (1/6-em)]](https://www.rsc.org/images/entities/char_2009.gif) : :![[thin space (1/6-em)]](https://www.rsc.org/images/entities/char_2009.gif) 40); T = 30 °C; Flow rate: 0.4 mL min−1; Detection conditions: (a) see Table 1; (b) see Table 2. Loop: 5 μL; Peaks: 1. Naphthalene, 2. Acenaphtene, 4. Fluorene, 5. Phenanthrene, 6. Anthracene, 7. Fluoranthene, 8. Pyrene, 9. benzo(a)anthracene, 10. Crysene, 11. Benzo(b)fluoranthene, 12. Benzo(k)fluoranthene, 13. Benzo(a)pyrene, 14. Dibenzo(a,h)anthracene, 15. Benzo(g,h,i)perylene, and 16. Indeno(1,2,3-c,d)pyrene. 40); T = 30 °C; Flow rate: 0.4 mL min−1; Detection conditions: (a) see Table 1; (b) see Table 2. Loop: 5 μL; Peaks: 1. Naphthalene, 2. Acenaphtene, 4. Fluorene, 5. Phenanthrene, 6. Anthracene, 7. Fluoranthene, 8. Pyrene, 9. benzo(a)anthracene, 10. Crysene, 11. Benzo(b)fluoranthene, 12. Benzo(k)fluoranthene, 13. Benzo(a)pyrene, 14. Dibenzo(a,h)anthracene, 15. Benzo(g,h,i)perylene, and 16. Indeno(1,2,3-c,d)pyrene. | ||
To enhance the sensitivity, an optimization study was carried out aiming to find excitation and emission wavelengths specific for each analyte. This task was accomplished optimizing the excitation and emission wavelengths during the chromatographic run, in correspondence with the elution of the analytes. The λ values and the time program that ensured the best detection conditions are listed in Table 2. A typical chromatogram obtained at the optimized detection conditions is shown in Fig. 2(b), where it can be observed that the response for all analytes increased, especially for naphthalene, phenanthrene, fluorene and benzo(g,h,i)perylene. In particular, for benzo(g,h,i)perylene a 40-fold enhancement sensitivity was achieved. Quality parameters of the chromatographic method are reported in Table 3. The limits of detection (LOD) and quantitation (LOQ) for each analyte, which are expressed as the concentration of analyte which gives a signal that is respectively 3σ and 10σ above the mean blank signal (where σ is the standard deviation of the blank signal calculated over ten injections of the blank), are included within 0.01–0.2 μg L−1 and 0.03–0.5 μg L−1 (benzo(k)fluoranthene, anthracene, benzo(a)anthracene, benzo(a)pyrene, benzo(g,h,i)perylene), respectively.
| Time | Analyte | λ exc/λemiss |
|---|---|---|
| min | nm | |
| 0 | Naphthalene | 222/329 |
| 6.2 | Acenaphthene, fluorene | 265/360 |
| 8.8 | Phenanthrene | 246/370 |
| 10.4 | Anthracene | 250/406 |
| 12.1 | Fluoranthene | 280/450 |
| 13.6 | Pyrene | 270/390 |
| 16.6 | Benzo(a)anthracene, chrysene | 265/380 |
| 21.4 | Benzo(b)fluoranthene | 254/451 |
| 24.25 | Benzo(k)fluoranthene, benzo(a)pyrene | 288/406 |
| 28.0 | Dibenzo(a,h)anthracene, benzo(g,h,i)perylene | 289/422 |
| 30.5 | Indeno(1,2,3-c,d)pyrene | 300/500 |
| Analyte | Range/μg L−1n = 5 | R2 | Equation | LODa/μg L−1 | LOQb/μg L−1 |
|---|---|---|---|---|---|
| a Calculated according to the equation: 3·σB/m, where σB=standard deviation of area of blank (10 repetitions). b Calculated according to the equation: 10·σB/m. c A 0.1 μg L−1 maximum concentration level is established by the EC directive as the sum of the four PAHs. d A 0.01 μg L−1 maximum concentration level is established by the Italian legislation.2 | |||||
| Naphthalene | 5–50 | 0.9998 | y = 0.0167x + 0.0057 | 0.072 | 0.48 |
| Acenaphthene | 5–50 | 0.9997 | y = 0.03x−0.0004 | 0.060 | 0.21 |
| Fluorene | 5–50 | 0.9994 | y = 0.0299x + 0.0043 | 0.061 | 0.22 |
| Phenanthrene | 5–50 | 0.9968 | y = 0.0139x−0.0262 | 0.060 | 0.24 |
| Anthracene | 5–50 | 0.9999 | y = 0.2422x−0.0498 | 0.010 | 0.031 |
| Fluoranthene | 5–50 | 0.9956 | y = 0.0269x−0.0553 | 0.15 | 0.52 |
| Pyrene | 5–50 | 1.0000 | y = 0.0902x−0.0662 | 0.079 | 0.26 |
| Benzo(a)anthracene | 5–50 | 1.0000 | y = 0.2156x−0.0575 | 0.0094 | 0.031 |
| Crysene | 5–50 | 0.9982 | y = 0.086x−0.0557 | 0.077 | 0.24 |
| Benzo(b)fluoranthenec | 5–50 | 0.9998 | y = 0.1732x−0.1234 | 0.017 | 0.057 |
| Benzo(k)fluoranthenec | 5–50 | 0.9987 | y = 0.463x + 0.0689 | 0.010 | 0.031 |
| Benzo(a)pyrened | 2–50 | 1.0000 | y = 0.486x−0.2517 | 0.0082 | 0.027 |
| Dibenzo(a,h)anthracene | 5–50 | 0.9999 | y = 0.206x−0.1069 | 0.055 | 0.18 |
| Benzo(g,h,i)perylenec | 5–50 | 0.9932 | y = 0.318x−0.9134 | 0.17 | 0.51 |
| Indeno(1,2,3-c,d)pyrenec | 5–50 | 0.9961 | y = 0.580x-1.3384 | 0.043 | 0.13 |
It is worth mentioning that the limits so far achieved for some analytes are lower than those reported in literature after preconcentration steps.7,13,19,20
In Fig. 3 the determination of a PAHs mixture containing 0.5 μg L−1 of each analyte is shown. Analytes have signals distinguishable from the background noise and most of all benzo(b)fluoranthene, benzo(k)fluoranthene, benzo(a)pyrene and indeno(1,2,3-c,d)pyrene listed in the European Community list still exhibit significant intensities.
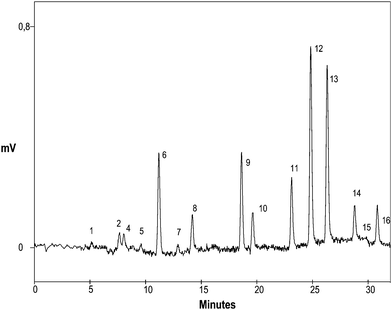 | ||
| Fig. 3 Separation and determination of PAHs (0.5 μg L−1 each) after the chromatographic optimization. Chromatographic conditions as for Fig. 2(b). Peaks as for Fig. 2. | ||
3.2 SPE Procedure
To fulfill the current legislation, a preconcentration technique is needed to reduce the detection limits of the method and to allow the detection of benzo(b)fluoranthene, benzo(k)fluoranthene, benzo(a)pyrene, benzo(g,h,i)perylene, indeno(1,2,3-c,d)pyrene at the limits required. Considering the hydrophobic nature of the PAHs, silica-based C18-based SPE cartridges were chosen and tested to the preconcentration of all PAHs.After some preliminary experiments, in which different kinds of solvents were tested for each of the above mentioned steps, the initial preconcentration conditions were set as indicated in Table 4 (Method A). After reconstitution with CH3CN, the solution was injected for HPLC analysis. Extraction recoveries for Method A ranged between 2.5 ± 0.1% (naphthalene) and 84.0 ± 0.5% (pyrene). In particular, for the majority of the analytes, recoveries higher than 70% were obtained, whilst for the first five eluting species—that is from naphthalene to anthracene—recoveries ranged from 2.5 ± 0.1% to 44.7 ± 2.3%. These latter compounds are characterized by the presence of two or three aromatic rings, lower molecular weights (152–178 g mol−1) and higher volatility (p° > 0.1 Pa,21 and Henry's law constants included between 10−3 and 10−5 atm m3 mol−1). We hypothesize that the relatively low recoveries obtained for these so-called low-boiling analytes are related to the evaporation step of the eluate. In fact, this step has been supposed to cause losses for these analytes as high as 70%.17 Further experiments were carried out to improve the performance of Method A.
| Steps | Method | |||||
|---|---|---|---|---|---|---|
| A | B | C | D | E | ||
| I | Washing of the cartridge (mL of CH2Cl2) | 20 | 10 | 8 | 5 | 8 |
| ii | Activation of the cartridge (mL of CH3OH) | 20 | 10 | 8 | 5 | 8 |
| iii | Washing (mL of H2O) | 20 | 10 | 8 | 5 | 8 |
| iv | Filtration (mL of sample) | 1000 | 1000 | 1000 | 1000 | 500 |
| v | Vacuum-drying of the cartridge (min) | 15 | 15 | 15 | 15 | 15 |
| vi | Evaporation of the eluate (T at Rotavapor for 2.5 min) | 40 °C | 30 °C | 30 °C | 30 °C | 30 °C |
| vii | Reconstitution (mL of CH3CN) | 1 | 1 | 1 | 1 | 0.5 |
3.2.2.1 Choice of conditioning volume. To decrease solvent consumption and disposal, and to speed up the whole procedure, steps (i), (ii) and (iii) of Method A (that used 20 mL of each solvent) were performed using 10 mL (Method B), 8 mL (Method C) and 5 mL (Method D) for each solvent (see Table 4). The other steps were kept constant with Method A, barring the use of Rotavapor at 30 °C in step (vii). This device was adopted to reduce the losses of the low-boiling analytes experienced with Method A. The results obtained for the procedures A–D are compared in Fig. 4. The data obtained point out that Methods B (10 mL of each conditioning solvent) and C (8 mL of each conditioning solvent) globally provided the best recovery and rsd% results which are included between 0.1–0.4% (Method B), 0.03–1.2% (Method C) and 0.1–3% (Method D).
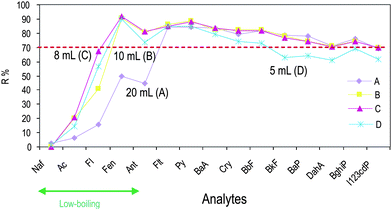 | ||
| Fig. 4 Effect of volumes of conditioning solvents (CH2Cl2, CH3OH, H2O) on PAH recoveries after SPE and HPLC injection. For methods details see Table 4. PAH abbreviations: Naf: naphthalene, Ac: acenaphtene, Fl: fluorene, Fen: phenanthrene, Ant: anthracene, Flt: fluoranthene, Py: pyrene, BaA benzo(a)anthracene, Cry: crysene, BbF: benzo(b)fluoranthene, BkF: benzo(k)fluoranthene, BaP: benzo(a)pyrene, DahA: dibenzo(a,h)anthracene, BghiP: benzo(g,h,i)perylene, and I123cdP: Indeno(1,2,3-c,d)pyrene. | ||
As hypothesized, the choice to operate Rotavapor at 30 °C reduced the losses of the low-boiling analytes, and improved the recoveries of +14% (acenaphthene) and +34% (fluorene). Despite this improvement, recovery for naphthalene did not change. No significant difference in the recoveries of the high-boiling analytes is observed for Methods B and C, whereas the slight decrease of recoveries for Method D indicates that 5 mL of each conditioning solvent does not ensure complete cartridge activation.
In light of these results, Method C—that employs a reduced amount of solvent (8 mL), leading to fewer disposals and to a more rapid procedure, with relative standard deviations included within 0.03% (fluoranthene) and 1.2% (acenaphthene)—was chosen for further optimization.
3.2.2.2 Choice of sample volume. In order to further reduce the time required for the analysis, the effect of the use of a decreased sample volume on recoveries was evaluated.
Extractions were performed using 8 mL of each solvent for steps (i), (ii) and (iii), Method C, as optimized and results were compared with those obtained by Method E (see Table 4) where 500 mL of sample are processed in step (iv) and 0.5 mL acetonitrile is used for reconstitution (step (viii)), to maintain the same preconcentration factor. As shown in Fig. 5, the recoveries are comparable for both the procedures (rsd% included within 0.02% for benzo(a)anthracene and 8% for naphthalene), but Method E obviously enables to process a double number of samples in the same working day. The experimental conditions so far optimized, allow us to process 24 samples per day.
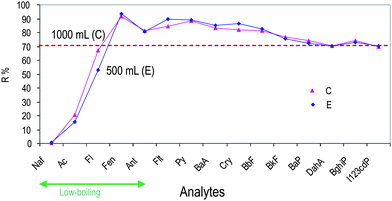 | ||
| Fig. 5 Effect of sample volume loaded during SPE procedures on PAHs recoveries: method C (1000 mL of sample in step (iv) and reconstitution with 1 mL CH3CN in step (viii)) is compared with method E (500 mL of sample in step (iv) and reconstitution with 0.5 mL CH3CN in step (viii)). PAH abbreviations as for Fig. 4. | ||
3.2.2.3 Effect of methanol in the sample. Decreased recovery of PAHs during extraction, whatever the technique is, is usually attributed by many authors to losses to glass. For preventing wall effects, Method E has been performed after the addition of 1% CH3OH to the sample. The results obtained (Fig. 6) showed that the presence of methanol enhanced the recovery for the five PAHs regulated by the European Community, especially for benzo(a)pyrene, but decreased the recovery of low-boiling analytes (e.g., fluorene, fenanthrene and anthracene). Many authors observed that the concentration of the organic modifier is a critical parameter influencing the quantitative recovery of PAHs,22 but our results suggest that the decreased recoveries for the low-boiling analytes can be ascribed to a decreased adsorption on the SPE cartridge, during step (iv). In light of the obtained results, we avoided the addition of the organic modifier to the sample.
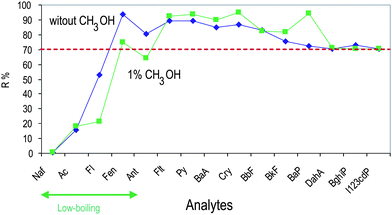 | ||
| Fig. 6 Effect of the addition of methanol in the sample on the recoveries of PAHs: recoveries of method E (no methanol addition) are compared with those obtained after the addition of 1% CH3OH in the sample. PAH abbreviations as for Fig. 4. | ||
The recoveries obtained under the optimized SPE conditions, method E (Table 5), are comparable, or higher for some compounds, of those reported by other authors using reversed-phase extraction cartridges,22–24 with the only exception of acenaphthene, for which we observed lower recovery, and naphthalene not retained. The quantitation limits achieved, are greatly improved in respect to current literature. To the best of our knowledge, detection limits of 0.012 ng L−1 for each PAH were reported by Cincinelli et al.,25 these limits being achieved with a preconcentration factor as high as 30000 after two repeated liquid–liquid extractions with n-hexane and fractionation into activated silica gel to separate from other class of compounds.
| Analyte | Recovery (%) n = 6 | LOQa/ng L−1 |
|---|---|---|
| a Calculated according to the equation: 10·σB/m, where σB=standard deviation of area of blank (n = 10). b A 0.1 μg L−1 maximum concentration level is established by the EC directive as the sum of the four PAHs. c A 0.01 μg L−1 maximum concentration level is established by the Italian legislation. | ||
| Acenaphthene | 20.5 ± 0.2 | 1.02 |
| Fluorene | 67.4 ± 0.3 | 0.33 |
| Phenanthrene | 91.5 ± 0.2 | 0.26 |
| Anthracene | 81.3 ± 0.1 | 0.038 |
| Fluoranthene | 84.8 ± 0.0 | 0.61 |
| Pyrene | 88.3 ± 0.1 | 0.29 |
| Benzo(a)anthracene | 83.5 ± 0.1 | 0.037 |
| Crysene | 81.9 ± 0.3 | 0.29 |
| Benzo(b)fluorantheneb | 81.5 ± 0.1 | 0.070 |
| Benzo(k)fluorantheneb | 76.7 ± 0.1 | 0.040 |
| Benzo(a)pyrenec | 74.4 ± 0.1 | 0.036 |
| Dibenzo(a,h)anthracene | 70.4 ± 0.3 | 0.26 |
| Benzo(g,h,i)peryleneb | 74.2 ± 0.2 | 0.69 |
| Indeno(1,2,3-c,d)pyreneb | 69.5 ± 0.1 | 0.19 |
3.3 Validation of the method
The method developed, preconcentration by method E and chromatographic separation and detection, was used inside an inter-laboratory study aimed at the determination of the analytes regulated by Italian and European laws, i.e., benzo(a)pyrene, benzo(b)fluoranthene, benzo(k)fluoranthene, indeno(1,2,3-c,d)pyrene and benzo(g,h,i)perylene in drinking water samples. The Inter-laboratory test (named DRINKING WATER-B) was organized and managed by CALITAX LABAQUA (Barcelona, Spain, http://www.labaqua.com). The composition of the samples is reported in Table 6 together with the z-scores obtained (defined as Xmj−XM)/σp). (The complete inter-laboratory results are shown in the ESI.†) Absolute values of z-scores (|z| values) are used for assessing the acceptability of the results as follows: |z| ≤ 2 acceptable result; 2 < |z| < 3 doubtful result; |z| ≥ 3 unacceptable result. From the data shown in Table 6, it can be observed that since |z| values are included between 0.19 and 0.96, the method developed performs satisfactorily.| Sample | Analyte | XM/μg L−1a | Std Dev. (σp) b | Xmj/μg L−1c | S d | Z-scoree | No. Lab f |
|---|---|---|---|---|---|---|---|
| a XM = assigned value. b (σp) = target standard deviation. c XmJ = value measured with the developed SPE-HPLC procedure. d S = standard deviation of the developed SPE-HPLC procedure. e Z = (Xmj-XM)/σp. f No. Lab = number of laboratories involved in the inter-laboratory study. | |||||||
| 1 | Benzo(a)pyrene | 0.018 | 0.005 | 0.015 | 0.0002 | −0.60 | 24 |
| 2 | Benzo(b)fluoranthene | 0.039 | 0.008 | 0.031 | 0.0006 | −0.96 | 25 |
| 2 | Benzo(k)fluoranthene | 0.044 | 0.012 | 0.037 | 0.0010 | −0.58 | 25 |
| 3 | Indeno(1,2,3-c,d)pyrene | 0.101 | 0.025 | 0.106 | 0.0068 | 0.19 | 21 |
| 3 | Benzo(g,h,i)perylene | 0.095 | 0.036 | 0.112 | 0.0035 | 0.47 | 22 |
3.4 Drinking water analyses
The protocol developed was applied to the determination of PAHs in waters intended for human consumption collected in the Torino (Italy) area. In the majority of the samples processed, none of the PAHs is present. In few samples, the presence of low concentrations of benzo(a)pyrene, benzo(k)fluoranthene and indeno(1,2,3-c,d)pyrene was detected. In Fig. 7, as an example, we show a chromatogram chosen for its highest concentration of PAHs found (1 ng L−1 pyrene, 3 ng L−1 benzo(a)anthracene, 1 ng L−1 crysene, 2 ng L−1 benzo(b)fluoranthene, 2 ng L−1 benzo(k)fluoranthene, 2 ng L−1 benzo(a)pyrene, 2 ng L−1 dibenzo(a,h)anthracene, 1 ng L−1 benzo(g,h,i)perylene, and 1 ng L−1 indeno(1,2,3-c,d)pyrene), which are nevertheless well below the maximum allowed levels.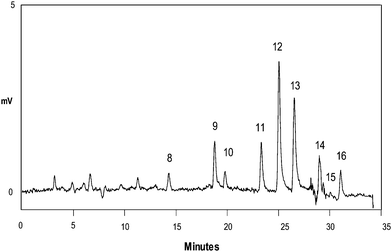 | ||
| Fig. 7 Determination of PAHs in a drinking water sample (Torino, Italy) with the developed SPE–HPLC protocol. Chromatographic and detection conditions as for Fig. 2(b). For SPE conditions, see method E. Peaks: 8. pyrene (1 ng L−1), 9. benzo(a)anthracene (3 ng L−1), 10. crysene (1 ng L−1), 11. benzo(b)fluoranthene (2 ng L−1), 12. benzo(k)fluoranthene (2 ng L−1), 13. benzo(a)pyrene (2 ng L−1), 14. dibenzo(a,h)anthracene (2 ng L−1), 15. benzo(g,h,i)perylene (1 ng L−1), and 16. indeno(1,2,3-c,d)pyrene (1 ng L−1). | ||
The method optimized is currently routinely used for the determination of PAHs by the laboratory in charge of the monitoring of the drinking water quality for the city of Torino.
4. Conclusions
A sensitive and accurate SPE–HPLC protocol was optimized for the determination of PAHs in drinking water samples. The improvements introduced in the whole method greatly enhanced its sensitivity allowing the determination of the low concentration levels involved in such a sample. The method does fulfill the detection limits required by the EC Directive. In addition, the optimization of the SPE step resulted in reduced use/disposal of solvents, and the speed-up of the whole procedure, that enables the analysis of a number of samples—up to 24 per day. At present, the method (validated inside an interlaboratory study) is routinely applied for the analysis of PAHs at the Laboratory of the Municipal Waterworks of Turin in charge of the control of drinking water quality in Torino.Acknowledgements
This study was supported by Centro Ricerche SMAT Società Metropolitane Acque di Torino. The authors would like to thank Dr G. Costantino (SMAT) and Dr A. Gringeri for their valuable assistance. Funding from Ministero dell'Università e della Ricerca (MIUR, Italy) is gratefully acknowledged.References
- S. Mitra, R. M. Dickhut, S. A. Kuehl and K. L. Kimbrough, Mar. Chem., 1999, 66, 113 CrossRef CAS.
- D.L. 2/2/2001 No. 31 “Attuazione della direttiva 98/83/CE relativa alla qualità delle acque destinate ad uso umano” (transposition from the 98/83/CE directive about the quality of potable waters), February 2001.
- L. Wolska, Anal. Bioanal. Chem., 2008, 391, 2647 CrossRef CAS.
- L. Zhu, Y. Chen and R. Zhou, J. Hazard. Mater., 2008, 150, 308 CrossRef CAS.
- M. A. Olivella, Chemosphere, 2006, 63, 116 CrossRef.
- M. C. Bruzzoniti, C. Sarzanini and E. Mentasti, J. Chromatogr., A, 2000, 902, 289 CrossRef CAS.
- B. Delgado, V. Pino, J. H. Ayala, V. Gonzalez and A. M. Afonso, Anal. Chim. Acta, 2004, 518, 165 CrossRef CAS.
- M. L. Mayer, S. K. Poole and C. F. Poole, J. Chromatogr., A, 1995, 697, 89 CrossRef CAS.
- C. W. Huck and G. K. Bonn, J. Chromatogr., A, 2000, 885, 51 CrossRef CAS.
- W. D. Wang, Y. M. Huang, W. Q. Shu and J. Cao, J. Chromatogr., A, 2007, 1173, 27 CrossRef CAS.
- Y. Y. Zhou, X. P. Yan, K. N. Kim, S. W. Wang and M. G. Liu, J. Chromatogr., A, 2006, 1116, 172 CrossRef CAS.
- M. Bouzige, V. Pichon and M. C. Hennion, J. Chromatogr., A, 1998, 823, 197 CrossRef CAS.
- Y. Wu, L. Xia, R. Chen and B. Hu, Talanta, 2008, 74, 470 CrossRef CAS.
- H. Bagheri and A. Salemi, Chromatographia, 2004, 59, 501 CrossRef.
- Application Note 138, Rapid HPLC analysis of PAH compounds, using porous 3 μm particles, Supelco.
- Method 550.1 “Determination of polycyclic aromatic hydrocarbons in drinking water by liquid-solid extraction and HPLC with coupled ultraviolet and fluorescence detection”, U.S. Environmental Protection Agency, July 1990.
- C. Miege, J. Dugay and M. C. Hennion, J. Chromatogr., A, 2003, 995, 87 CrossRef CAS.
- Dionex Application Note 95, Polycyclic aromatic hydrocarbon determination by reversed-phase high-performance liquid chromatography, 1994.
- L. Hou and H. K. Lee, J. Chromatogr., A, 2002, 976, 377 CrossRef CAS.
- V. Pino, J. H. Ayala, A. M. Afonso and V. Gonzalez, Anal. Chim. Acta, 2003, 477, 81 CrossRef CAS.
- J. J. H. Haftka, J. R. Parsons and H. A. J. Govers, J. Chromatogr., A, 2006, 1135, 91 CrossRef CAS.
- F. Busetti, A. Heitz, M. Cuomo, S. Badoer and P. Traverso, J. Chromatogr., A, 2006, 1102, 104 CrossRef CAS.
- N. E. Díaz-Moroles, H. J. Garza-Ulloa, R. Castro-Ríos, E. G. Ramírez-Villarreal, J. M. Barbarín-Castillo, M. de la Luz Salazar-Cavazos and N. Waksman-de Torres, J. Chromatogr. Sci., 2007, 45, 57 CAS.
- E. Martinez, M. Gros, S. Lacorte and D. Barcelo, J. Chromatogr. A, 2004, 1047, 181 CAS.
- A. Cincinelli, A. M. Stortini, L. Checchini, T. Martellini, M. Del Bubba and L. Lepri, J. Environ. Monit., 2005, 7, 1305 RSC.
Footnote |
| † Electronic supplementary information (ESI) available: Inter-laboratory results. See DOI: 10.1039/b9ay00203k |
| This journal is © The Royal Society of Chemistry 2010 |
