Fast voltammetric assay of water soluble phthalates in bottled and coolers water
Munawar
Saeed
*a,
Sirajuddin
a,
Abdul
Niaz
b,
Afzal
Shah
b,
Hassan Imran
Afridi
a and
Abdul
Rauf
a
aNational Centre of Excellence in Analytical Chemistry, University of Sindh, Jamshoro, 76080, Pakistan. E-mail: munwar_saeed@yahoo.com; Fax: +92 222 771560; Tel: +92 222 771379
bUniversity of Science and Technology, Bannu, NWFP, Pakistan
First published on 17th May 2010
Abstract
Detection of phthalic acid and phthalates esters is of growing interest due to their significant use and potential toxicity. A fast, simple and highly sensitive Square Wave Voltammetric (SWV) method developed for determination of total water soluble phthalates using a glassy carbon electrode (GCE) is demonstrated using di-n-butyl phthalate (95%) (DBP) as a test example. The study showed that 100 μmol L−1 aqueous solution of DBP gives the best response with 0.05 mol L−1 tetrabutylammonium bromide (TBAB), at stirring rate of 1400 rpm, deposition time, 20 s and pH 4.0 ± 0.1. The optimum frequency and scan rate was 100 Hz and 0.9 V s−1 respectively. Voltammetric response was linear over 3 ranges, 70–110 μmol L−1, 20–60 μmol L−1 and 2–10 μmol L−1 with regression coefficient of 0.9873, 0.9978 and 0.9935 respectively and limit of detection (LOD), 0.47 μmol L−1 for total water soluble phthalates in aqueous medium. The method was successfully applied to the determination of total phthalates in water samples taken from sources of water stored in PVC coolers and plastic bottles.
1. Introduction
Phthalates are a class of widely used industrial compounds, known as dialkyl or alkyl aryl esters of 1,2-benzenedicarboxylic acid. They are used in various products, however, the main area for phthalate esters is their use as plasticizing agents in poly(vinyl chloride) (PVC) products.1–4 Di-n-butyl phthalate (DBP) is used as a plasticizer in elastomers such as polyvinyl, as a textile lubricating agent, as a resin solvent, and in safety glass, printing inks, paper coatings, adhesives, cosmetics, aerosols, as an antifoamer, as a skin emollient, and as a plasticizer in nail polish, false fingernails and hair spray.4 There is concern towards some phthalates, especially diethylhexyl phthalate (DEHP) and DBP after the report of Earl Gray's laboratory at US Environmental Protection Agency according to which the male reproductive development was acutely sensitive to these phthalates and produced dramatic changes in male sexual properties when exposure occurred in utero, at levels far below those of earlier toxicological concern. The changes include increase in the rate of hypospadias and indication of demasculinization.5However, in terms of aquatic toxicity, the C6 or > C6 containing phthalates have been termed as non-toxic due to their limited solubility (< 1 mg L−1). Moreover, some in vivo and in vitro analyses proved that DBP and butylbenzyl phthalate (BBP) but not other phthalates were capable of interacting with estrogenic receptors.6 Among the many potential sources for exposure of living organisms especially humans to DBP and other water soluble phthalates is the drinking water stored in bottles and PVC coolers, due to their continuous aqueous solubility based transfer, as compared to higher phthalates. Hence, an efficient simple and sensitive method must be investigated for low level monitoring of water soluble phthalates. Several methods have been proposed by various researchers to quantify phthalates in different types of samples using different techniques. They include, high performance liquid chromatography (HPLC) related methods7–11 gas chromatography (GC) based,12–16 and multidimensional liquid chromatography tandem mass spectrometry (LC/LC-MS/MS) method.17 The use of polarography is rarely reported,18,19 for determining phthalates, because very close values of half wave potentials produce problem in handling of mixtures of phthalates19 and hence there have not been significant recent advancements in this area. The problems with the previously applied polarographic techniques for analysis of total phthalates include, the use of an organic solvent assisted medium and the use of a mercury electrode, both of which present toxicity20 issues and hence are objectionable from environmental point of view.
2 Experimental
2.1 Chemicals and instrumentation
A trace analyzer model 797, by Metrohm Version 1.1 was the main instrument used for voltammetric analysis of total phthalates present in various bottled and cooler waters. Three electrodes, consisting of glassy carbon (3 mm) as working electrode, platinum rod as counter electrode and calomel as reference electrode equipped with voltammetric cell and N2 capillary were used as voltammetric assembly.All chemicals used were of analytical grade ultra pure quality. Various phthalate esters such as dimethyl phthalate (DMP), diethyl phthalate (DEP), dipropyl phthalate (DPP), dibutyl phthalate (DBP), diethylhexyl phthalate (DEHP), dioctyl phthalates (DOP), dicyclohexyl phthalate (DCHP), di-isononyl phthalate (DINP) and electrolyte salts such as tetramethylammonium bromide (TMAB), tetraethylammonium iodide (TEAI) and tetrabutylammonium bromide (TBAB) were purchased from Merck Germany. Lithium perchlorate (LiClO4) and HCl were from BDH and NaOH was purchased from Acros chemicals. Stock solutions such as 0.1 mol L−1 DBP and 1 mol L−1 of electrolyte were prepared in HPLC grade methanol from Fisher Scientific Company while the working standards were made by dilution of stock solutions with de-ionized water. 1 mol L−1 solution of each HCl and NaOH was prepared in de-ionized water and used for pH adjustment.
2.2 Voltammetric procedure
All the measurements were performed at room temperature 25 ± 1 °C. Under optimized conditions, 10 ml aqueous solution containing 1 × 10⁻⁴ mol L−1 DBP and 0.05 mol L−1 TBAB as supporting electrolyte at pH 4.0 ± 0.1 was taken in the electrochemical cell. After applying all optimized parameters, SW voltammograms were recorded in the range of −1.2 V – −2.2 V, pulse amplitude, 0.1 V, frequency 100 Hz, scan rate 0.9 V s−1, stirring rate, 1400 rpm and deposition time, 20 s without nitrogen purging. A blank solution was also scanned under similar conditions. The peak potential for the DBP working standard was around −1.85 V. Calibration plots were obtained for a number of DBP standard solutions. The newly developed method performed well for recovery tests on tap water while the water samples from bottles and coolers were analyzed after pretreatment and the concentration of water soluble phthalates was calculated from a specific calibration plot.2.3 Recovery tests
A voltammetric recovery test was performed by spiking tap water samples with standard DMP, DEP, DPP and DBP in order to check the % recovery under the combined matrix effect of various ions such as, Na+, K+, Ca2+, Mg2+, Cl−, NO3−, CO32−, HCO3−, etc. (present at their natural percentages) on the peak current of phthalates following all optimized parameters.2.4 Pretreatment and preparation of water samples for voltammetric analysis
100 ml of water from a water storage bottle or water cooler was evaporated until the volume was reduced to 5 ml. To this was added 0.5 ml of 1 mol L−1 stock solution of TBAB pH adjusted to 4.0 ± 0.1 and this was made up to 10 ml with de-ionized water. The sample was then analyzed by SWV under the conditions discovered during the method development process.3 Results and discussion
In our work we chose the GCE as a stable, easily renewable and sensitive electrode for analysis of DBP as compared to other solid electrodes such as; gold, silver and graphite electrodes. In the initial sensitivity tests it was discovered that SWV produces a better current signal response to DBP at a GCE than other voltammetric modes. As a result, optimization studies were carried out for the SWV method using a standard solution of DBP. In all of the optimization studies the blank SWV peak current was ignored, but corrections were applied in the case of calibration plots and application for water samples3.1 Optimization of experimental parameters
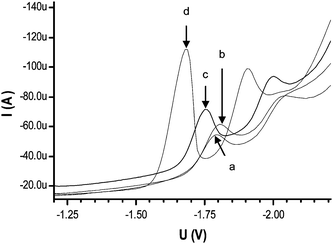 | ||
| Fig. 1 SW Voltammograms of 1 × 10⁻⁴ mol L−1 M DBP in the presence of 0.1 mol L−1 (a) LiClO4 (b) TMAB (c) TEAI and (d) TBAB. Amplitude 0.9 V, frequency 100 Hz, scan rate 0.9 V s−1, stirring rate, 2000 rpm, deposition time, 0 s, equilibration time, 10 s, pH, 5.0 ± 0.1. | ||
In Fig. 1, the enhanced response of DBP with TBAB may be due to the formation of a greater number of alkyl ions which can increase its adsorption properties on GCE surface and hence results in maximum current. The maximum current in case of TBAB also signifies greater interaction and hence maximum reduction of DBP at cathode.22 The shift of peak potential to the left for the cations follows the order; TBA+ > TEA+ > TMA+ and further proves the greater adsorption by bigger cations. The size of anions however, seems to play no role in such tendency. The use of TBAB has been cited in aqueous medium for acrylamide determination by differential pulse polarography (DPP)22 and in 5% water/dimethyl formamide medium for evaluation of 4,4′-bis[(4-phenylamino-6-methoxy-1,3,5-triazin-2-yl)amino]-stilbene-2,2′-disulfonic acid by DPP.23
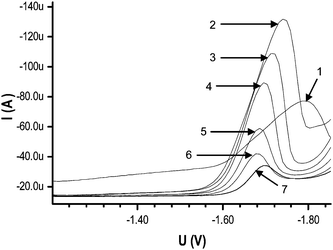 | ||
| Fig. 2 Effect of different concentration from (1) 0.01 mol L−1, (2) 0.05 mol L−1, (3) 0.1 mol L−1, (4) 0.15 mol L−1, (5) 0.2 mol L−1, (6) 0.25 mol L−1, (7) 0.3 mol L−1, of TBAB as supporting electrolyte with 1 × 10⁻⁴ mol L−1 DBP. | ||
This study shows that 0.05 mol L−1 TBAB was the optimized amount for maximum peak current and this concentration favors the maximum interaction of electrolyte with DBP. The effect of TBAB concentration has been reported for Brdieka and presidium currents of bovine-serum albumin.24
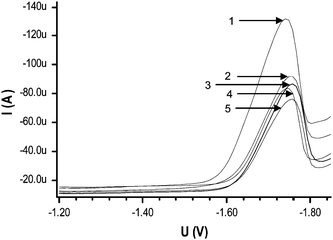 | ||
| Fig. 3 Effect of different solvents on SWV of 1 × 10⁻⁴ mol L−1 DBP solution containing 0.05 mol L−1 TBAB (1) working aqueous solution (actually 5% in methanol) (2) 10% methanol, (3) 10% ethanol, (4) 10% propanol and (5) 10% acetonitrile per 10 ml of aqueous solution. | ||
It can be seen that the best signal response for DBP is observed in water medium (5% in methanol) (because 0.5 ml methanol is added from 1 mol L−1 methanolic TBAB per 10 ml of solution) with less negative peak potential. The best peak current in aqueous medium may be due to its strong dielectric constant and more polar behavior as compared to other mixed solvents mixtures. Another reason may be the decrease in zeta potential after addition of organic solvent.25 In the case of water as solvent, hydrogen bonding between bromide ions and hydrogen atoms of water could lead to increased migration and hence results in greater deposition of phthalates at GCE.
So, 1400 rpm was selected as the optimum stirring speed for maximum peak current in further study.
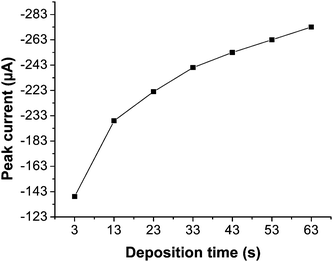 | ||
| Fig. 4 Effect of various deposition times (0–60 s) on the peak signal of a 1 × 10⁻⁴ mol L−1 solution of DBP under previously optimized parameters. | ||
It was observed that the peak signal of DBP increases with increase in deposition time and reaches a saturation value with maximum surface coverage. The peak was shifted with time towards more negative potential value due to significant gap between successive time intervals, the current was measurable anyhow. As the peak shape was getting broader with increasing time of deposition, 20 s with a peak current of 219 μA was selected as the optimum time for 1 × 10⁻⁴ mol L−1 solution of DBP giving a good shape and narrower peak for further applications. The deposition at zero time and nonlinear behavior of the plot proves that the process is adsorption controlled. The effect of deposition time on peak current in SWV studies has been reported elsewhere.27,28
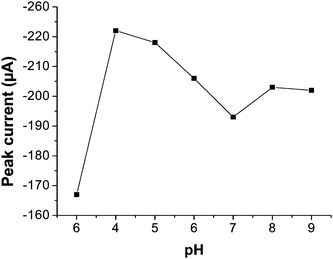 | ||
| Fig. 5 Effect of change in pH upon the peak current value of 1 × 10⁻⁴ mol L−1 DBP under all optimized conditions. | ||
It is evident that the value of pH 4 results in the best peak signal and hence this was selected as optimum pH for further study. A pH value of 3.3 has been reported19 for maximum peak current value for 1 × 10⁻⁴ mol L−1 phthalic acid by DP polarography in 0.1 mol L−1 KCl/HCl medium. They observed a linear time–current dependence of phthalic acid at this pH value in order to prove that the process was kinetically controlled. According to a very old report29 the biggest fraction of total phthalates was observed in the form of biphthalate ions at pH, 4.1. According to our opinion, the cationic part of TBAB interacts with biphthalate ion to give them a positive charge and these positive ions are then interacted/adsorbed at cathode for reduction purpose as evident from zero deposition potential. As equilibration time and 20 s deposition time is also applied after final optimization study we believe that the process follows a Chemical-Electrochemical (CE) route.
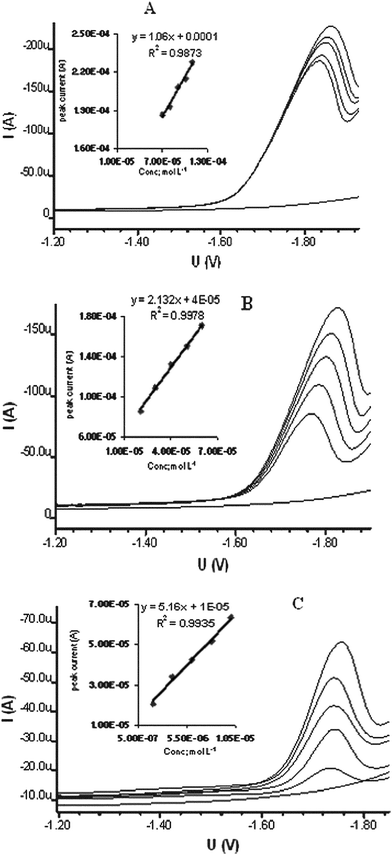 | ||
| Fig. 6 Calibration curves for aqueous solution of DBP as representative of total water soluble phthalates in the range of 70–110 μmol L−1 (A), 20–60 μmol L−1 (B) and 2–10 μmol L−1 (C). | ||
The linear ranges were true for 70–110 μmol L−1, 20–60 μmol L−1 and 2–10 μmol L−1 DBP solution with regression coefficients of 0.9873, 0.9978 and 0.9935 respectively. The highest range was not defined well as the middle and lower ranges were. It means that the method has excellent validity in the middle and lower range and using this method for higher phthalate contents it is advisable to dilute the sample to desired range. The limit of detection (LOD) for total phthalates was 0.47 μmol L−1 as calculated by the previously described method.22 This pre-concentration method in case of samples containing low concentrations of phthalates can bring the lower range and LOD ten times below. The reproducibility of the developed method was judged by 15 successive SWV measurements of 1 × 10⁻⁴ mol L−1 DBP solution in 0.05 mol L−1 TBAB. The mean peak current value at a peak potential around −1.85 V was found to be 221 μA with RSD of 0.5%. This proves that the developed method has excellent reproducibility. The use of a GCE in SWV mode with LOD 0.47 μmol L−1 is quite comparable with the reported method19 showing LOD of 0.5 μmol L−1 using DME. So the use of GCE is very advantageous from an environmental point of view, is easy to use in aqueous medium and requires only simple treatment of sample. In addition the faster scan and N2 free analysis make the method favourable for evaluation of total water soluble phthalates.
| Phthalate ester | Peak currenta/μA | % of DBP peak current | Decreased response (%) |
|---|---|---|---|
| a Average of 3 values; N.R., negligible response; do, peak current and peak potential of different water soluble phthalate esters each at a concentration of 10 μM. | |||
| DMP | 62.9 | 98.9 | −1.1 |
| DEP | 63.1 | 99.2 | −0.8 |
| DPP | 63.4 | 99.7 | −0.3 |
| DBP | 63.6 | 100.0 | 0.0 |
| DEHP | N.R. | — | ≈−92 |
| DCHP | do | — | ≈−95 |
| DOP | do | — | ≈−96 |
| DINP | do | ≈−95 |
The similarity of the values for peak current for DBP and the other water soluble phthalates is due to the fact that after dissolution of these phthalates into water [pH 4.0] they are hydrolyzed to phthalic acid where all the phthalates have similar type of reduction into bi-phthalate ions due to same number of carboxylate ions. It has been already reported that the diffusion currents are directly proportional to the carboxylate content of the molecule.21 So this study confirms that the newly developed method is only suitable for water soluble phthalate determination in aqueous medium.
The closer current value for each type of phthalate further confirms the evidence of application of this method to total water soluble phthalates as described. Tap water contains a number of ions as mentioned earlier and all the values of recovered phthalates are around 100% recovery. It means that the common ions such as Na+, K+, Ca2+, Mg2+, Cl−, CO32−, HCO3−, etc. present even at elevated concentration produce no significant effect on the determination of soluble phthalates in tap water.
The method was also applied to the determination of trace levels of total water soluble phthalates in 10-fold pre-concentrated water samples taken from PVC coolers' and bottled mineral water which were stored for 10 days. In case of cooler, the sample was collected in the form of clean filtered water already stored in each cooler of specific manufacturer company for desired time before testing. The samples of bottled water were collected from local mineral water suppliers factories with different brand names at the time of bottling and analyzed 10 days after the bottling date.
The reproducibility of the peak current shows that the method is well suited for determination of total soluble phthalates at trace levels in aqueous samples. Values obtained for this and other samples were divided by a factor of 10 because each sample was pre-concentrated from a 100 ml to final 10 ml (required volume for voltammetric cell). The results are given in Table 3 and Table 4.
| Total water soluble phthalates/μmol L−1 | |||
|---|---|---|---|
| Sample No. | Cooler Brand | Actual concentration | |
| Developed Method | Reported Method | ||
| a means standard deviation of triplicate sample in each case. | |||
| 1 | Eagle star | 0.580 ± 0.007 | 0.581 ± 0.008 |
| 2 | Star | 0.560 ± 0.007 | 0.570 ± 0.007 |
| 3 | Igloo | 0.531 ± 0.003 | 0.533 ± 0.006 |
| 4 | Galaxy | 0.512 ± 0.004 | 0.521 ± 0.007 |
| 5 | Arass | 0.492 ± 0.004 | 0.496 ± 0.006 |
| Average | 0.5350 ± 0.005 | 0.5402 ± 0.007 | |
| Total water soluble phthalates/μmol L−1 | |||
|---|---|---|---|
| Sample No. | Water company | Actual concentration | |
| Developed Method | Reported Method | ||
| a means standard deviation of triplicate sample in each case. | |||
| 1 | Hash | 0.649 ± 0.003 | 0.646 ± 0.004 |
| 2 | MAZA | 0.937 ± 0.005 | 0.939 ± 0.005 |
| 3 | VEY | 0.591 ± 0.003 | 0.594 ± 0.006 |
| 4 | VITAL | 0.780 ± 0.003 | 0.780 ± 0.005 |
| 5 | Sprinkle | 0.682 ± 0.003 | 0.684 ± 0.005 |
| Average | 0.727 ± 0.003 | 0.728 ± 0.005 | |
This pre-concentration technique for each water sample brings the quantification limit as well as detection limit of this method 10 times further down of the calculated values. Therefore after applying the concentration procedure, the detection limit of the method becomes 0.047 μmol L−1 (instead of original 0.47 μmol L−1) regarding the total soluble phthalates in aqueous samples. Pre-concentration technique has been reported earlier19 where 800 ml of sample was reduced to a final 5 ml for quantification. Employing pre-concentration technique, they were able to achieve a range of 0.3–30 μg L−1 for determination of total phthalates in crude and treated waste-waters. The relative samples in Table 3 were also tested by a reported method in order to see the correlation and validity of the developed method. The data of both methods were correlated by applying t-test and one-tailed f-test calculated as 95% confidence limit at P value of 0.05 according to procedure cited elsewhere.30 According to the observations, the null hypothesis was retained as the values obtained in each case were non-significant. This proved the validity and precision of the current method.
The data in Table 3, describes an overall average of 0.535 μmol L−1 (0.149 ppm) for all samples studied as total water soluble phthalates in coolers' waters in terms of DBP. As stated18 the phthalate esters are used as plasticizers in the manufacture of poly(vinyl chloride) plastics, with three main constituents, such as, DEHP, DBP and diheptyl phthalate (DHP). So the DBP which is the most soluble among all the phthalates present and contribute as smaller portion of total plasticizers used in PVC coolers, is not a level of concern because the permissible exposure limit (PEL) of DBP or other phthalate is 5 mg m−3 (or 0.44 ppm).31 In comparison, the other two (high molecular weight) phthalates, DEHP and DHP play no role due to their insolubility in water and hence insensitivity by the current method. Due to higher cost of water filters, some poor people store phthalate contaminated river or stream water in PVC coolers for drinking purpose which can result in higher phthalate contents and hence possible health complications.
The data in Table 4 reveals the overall average content of total water soluble phthalates as of 0.728 μmol L−1 (0.203 ppm) in case of bottled mineral water samples. The data in Table 4 was also compared with the reported method19 by applying t-test and f-test. The results in this case were true at 95% confidence limit and showing good precision of the proposed method. These values may be contributed by DBP and/or other water soluble phthalates. According to a report,32 the acute and chronic toxicity to microorganisms and other species living in water are limited to lower molecular weight phthalate esters while higher molecular weight phthalate esters are not acutely or chronically toxic to aquatic organisms. Therefore, water soluble phthalates are of special interest and their assay in drinking water is essential for environmental monitoring.
4 Conclusion
This newly developed SWV method focuses on the use of GCE as a green alternative to toxic DME previously used for determination of phthalates at trace levels at an optimum pH 4.00. The method is quicker, sensitive and simpler and specific for assay of total water soluble phthalates in drinking waters. The analysis of soluble phthalates in the absence of N2 free medium provides economy, better sensitivity and shorter analysis time. The recovery test for tap water samples confirms its applicability for use in an ion rich medium and proves its validity for assay of all types of water samples regarding the quantification of water soluble phthalates. The pre-concentration technique lowers the limit of quantification as well as the LOD for the evaluation of water soluble phthalates in water samples. The data obtained by the developed method for drinking water stored in coolers and plastic bottles show that water stored in this way does not pose a threat to health from phthalate content, as the observed levels are below the PEL.Acknowledgements
We are thankful to the Director, National Center of Excellence in Analytical Chemistry, University of Sindh, Jamshoro, for technical assistance and Higher Education Commission of Pakistan Islamabad for financial support in this project.References
- G. Latini, A. Del Vecchio, M. Massaro, A. Verrotti and C. De Felice, Toxicology, 2006, 226, 90 CrossRef CAS.
- Z. Y. Xie, R. Ebinghaus, C. Temme, R. Lohmann, A. Caba and W. Ruck, Environ. Sci. Technol., 2007, 41, 4555 CrossRef CAS.
- T. Berman, D. Hochner-Celnikier, A. M. Calafat, L. L. Needham, Y. Amitai,, U. Wormser and E. Richter, Environ. Int., 2009, 35, 353 CrossRef CAS.
- M. Ema, E. Miyawakia and K. Kawashima, Reprod. Toxicol., 2000, 14, 13 CrossRef CAS.
- L. E. Gray, C. Wolf, C. Lambright, P. Mann, M. Price, R. L. Cooper and J. Ostby, Toxicol. Indus. Health, 1999, 15, 94 Search PubMed.
- A. B. Christopher and T. Paul, Aquatic Toxicity of Phthalate Esters, The Handbook of Environmental Chemistry, Vol. 3, Part Q 2003: pp. 263 Search PubMed.
- P. Cocco, N. Kazerouni and S. Hoar Zahm, Environ. Health Perspect., 2000, 108, 1 CrossRef.
- K. Mitani, S. Narimatsu, F. Izushi and H. Kataoka, J. Pharm. Biomed. Anal., 2003, 32, 469 CAS.
- K. Kambia, T. Dine, B. Gressier, A. F. Germe, M. Luyckx, C. Brunet, L. Michaud and F. Gottrand, J. Chromatogr., B: Biomed. Sci. Appl., 2001, 755, 297 CrossRef CAS.
- H. M. Koch, H. Drexler and J. Angerer, Int. J. Hyg. Environ. Health, 2004, 207, 15 CrossRef CAS.
- K. Kato, M. J. Silva, L. L. Needham and A. M. Calafat, J. Chromatogr., B: Anal. Technol. Biomed. Life Sci., 2005, 814, 355 CrossRef CAS.
- H. M. Chen, C. Wang,, X. Wang, N. Hao and J. Liu, Int. J. Cosmet. Sci., 2005, 27, 205 CrossRef CAS.
- D. D. Orsi, L. Gagliardi, R. Porra, S. Berri, P. Chimenti, A. Granese, I. Carpani and D. Tonelli, Anal. Chim. Acta, 2006, 555, 238 CrossRef CAS.
- P. W. Albro, S. Jordan, J. T. Corbett and J. L. Schroeder, Anal. Chem., 1984, 56, 247 CrossRef CAS.
- W. Qian and S. K. Birgit, Polym. Test, 2005, 3, 290.
- A. O. Earls, I. P. Axford and J. H. Braybrook, J. Chromatogr., A, 2003, 983, 237 CrossRef CAS.
- M. J. Silva, N. A. Malek, C. C . Hodge, J. A. Reidy, K. Kato, D. B. Barr, L. L. Needham and J. W. Brock, J. Chromatogr., B: Anal. Technol. Biomed. Life Sci., 2003, 789, 393 CrossRef CAS.
- A. F. Williams and D. Kenyon, Talanta, 1959, 2, 79 CrossRef CAS.
- K. Tanaka and M. Takeshita, Anal. Chim. Acta, 1985, 166, 153 CrossRef.
- J. Fischer, L. Vanourkova1, A. Danhel1, V. Vyskocil1, K. Cizek1, J. Barek, K. Peckova, B. Yosypchuk and T. Navratil, Int. J. Electrochem. Sci., 2007, 2, 226 Search PubMed.
- G. C. Whitnack, J. Reinhart and E. St. C. Gantz, Anal. Chem., 1955, 27, 359 CrossRef CAS.
- A. Niaz, Sirjuddin, S. Afzal, M. I. Bhanger, M. Saeed, M. K. Jamali and M. B. Arain, Talanta, 2008, 74, 1608 CrossRef CAS.
- J. Barek and R. Hrncir, Collect. Czech. Chem. Commun., 1994, 59, 1018 CrossRef CAS.
- I. M. Kolthoff and K. Yamashita, Proc. Natl. Acad. Sci. U. S. A., 1975, 72, 2863 CrossRef CAS.
- V. Virtanen, G. Bordin and A. R. Rodriguez, Chromatographia, 1998, 48, 637 CAS.
- H. Parham and B. A. Esfahani, J. Iran. Chem. Soc., 2008, 5, 453 Search PubMed.
- N. A. El-Maali, J. C. Vibe, G. J. Patriarche, M. A. Ghandour and G. D. Christian, Anal. Sci., 1990, 6, 245.
- D. Abd El-Hady, M. Ibrahim Abdel-Hamid, M. Mahmoud Seliem and N. Abo E-Maali, Arch. Pharmacal Res., 2004, 27, 1161 Search PubMed.
- N. H. Furman and C. E. Bricker, J. Am. Chem. Soc., 1942, 64, 660 CrossRef CAS.
- J. C. Miller and J. N. Miller, Statistics for Analytical Chemistry, 2nd edn, 1988, Publisher, John Wiley & Sons, New York, Chichester, Brisbane, Toranto Search PubMed.
- Mallinckrodt Baker. Inc. Material Safety Data Sheet (MSDS) 2001, pp 1–5 Search PubMed.
- C. A. Staples, W. J. Adams, T. F. Parkerton, J. W. Gorsuch, G. R. Biddinger and K. H. Reinert, Environ. Toxicol. Chem., 1997, 16, 875 CrossRef CAS.
| This journal is © The Royal Society of Chemistry 2010 |
