Enhanced sensitivity in a Hg2+ sensor by photonic crystals†
Liying
Cui
,
Wen
Shi
,
Jingxia
Wang
,
Yanlin
Song
*,
Huimin
Ma
* and
Lei
Jiang
Beijing National Laboratory for Molecular Sciences (BNLMS), Laboratory of New Materials, Key Laboratory of Organic Solids, Institute of Chemistry, Chinese Academy of Sciences, Beijing, 100190, P.R. China. E-mail: ylsong@iccas.ac.cn; mahm@iccas.ac.cn; Fax: (+86) 10-82672719; Tel: (+86)10-62529284
First published on 13th April 2010
Abstract
The photonic crystal (PC)-based light-amplification method has been demonstrated for Hg2+ detection. A Hg2+ detection limit of ca. 10 nM was achieved via the amplification effect of a blue band edge of the PC film.
Mercury is widely spread in the environment and results from various natural and anthropogenic sources, such as fossil-fuel power plants, gold mining and biomass burning.1–3 Thus, monitoring mercury pollution has attracted globally increasing concern, because concentrated mercury has adverse impact on human health, for example, the bioaccumulation of mercury within the brain and kidneys could result in neurological diseases.2–4 Generally, the detection methods for Hg2+ include the traditional instrument and fluorescence (FL) approaches.4–6 However, most of the methods are complex, time-consuming and expensive. Thus, developing a simple and highly sensitive method for Hg2+ analysis is of great importance for practical applications in both environment and food samples. Recently, much effort has been directed toward this goal based on conventional FL enhancement approaches or by designing new probe materials.7–9 Xu et al. reported a highly sensitive and selective Hg2+ detection method based on optical amplification properties of conjugated polymers via Föster resonance energy transfer in aqueous media.7 Ye et al. achieved highly sensitive detection of Hg2+ depending on the FL polarization enhanced by gold nanoparticles.8 Ma et al. developed a simple chemosensor towards Hg2+ in neutral aqueous media with high selectivity, which can directly detect Hg2+ in the presence of the other species in biosystems.9 Herein, the Hg2+ detection sensitivity of the above system was further improved by introducing photonic crystals (PCs) into the detection system, which can greatly broaden its practical application.
PCs have been utilized to improve the FL intensity in many optical devices and lower the detection limit in the FL based sensor due to their special light manipulation properties.10–14 For example, Klimov et al. reported the amplified spontaneous emission at the band edge of PCs in a synthetic polystyrene opal infiltrated with a CdSe sol–gel/nanocrystals composite.10a Cunningham et al. successfully utilized PCs to achieve the 4 times enhancement of the FL signal and the 3 times decrease of the detection limit in a cytokine immunoassay.14a Thus, it is interesting to see whether detection sensitivity of Hg2+ will be further improved if introducing PCs into a conventional FL detection system, which however has never been reported. In this article, we make such an attempt by introducing PCs into the Hg2+ detection system of rhodamine B thiolactone,9 and a Hg2+ detection limit of ca. 10 nM was achieved via the amplification effect of PCs. This simple and low-cost approach of increasing sensitivity via PCs will be of great significance for developing highly sensitive Hg2+ monitoring in the environment, water and food samples.
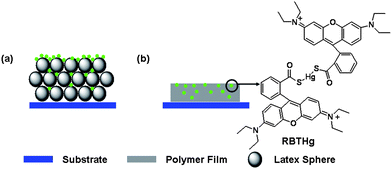
The PC film was assembled from poly(styrene-methyl methacrylate-acrylic acid) (P(St-MMA-AA)) latex spheres with the diameters of 210, 220, 230 and 280 nm, which were synthesized via batch emulsion polymerization according to our previous literature.15–18 A Hg2+ detection PC film in Scheme 1 was fabricated by immersing the PC film into a Hg2+ detection system9 (RBTHg in Na2HPO4-NaH2PO4 buffer (pH = 7) containing 1,4-dioxane) for 30 min and then the film was taken out and dried for 2 h at room temperature; this procedure coats the FL molecules of RBTHg upon the PC film. Meanwhile, the control sample was obtained by treating an as-prepared Hg2+ detection PC film with toluene; this dissolution procedure can destroy the periodic structure of PCs. If a suitable amount of toluene is vertically dropped on the Hg2+ detection PC film, the treatment will destroy the periodic structure. It should be noted that the treatment procedure needs to ensure the invariance of RBTHg density and prevent RBTHg from aggregation. Thus, the polymer film in Scheme 1(b) corresponds to the PC film after toluene treatment, the films having lost the optical property of PCs as demonstrated in Fig. S2.†
 | ||
| Scheme 1 A schematic illustration of (a) the Hg2+ detection PC sample and (b) the control sample. | ||
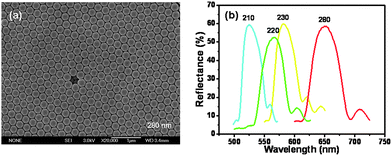
Fig. 1(a) shows the typical top-view SEM image of as-prepared Hg2+ detection PC films assembled from P(St-MMA-AA) latex spheres with the diameter of 280 nm. Compared with the PC film before coating RBTHg in Fig. S3(d),† there is little change in the film morphology: latex spheres are still arranged in a well-ordered close-packed fashion with their (111) plane oriented parallel to the surface of the substrate, which indicates that the procedure of immersing a PC film in the Hg2+ detection system doesn’t destroy the PC structure. Fig. 1(b) shows the reflectance spectra of four typical Hg2+ detection PC films, and the films have good optical properties. And there is a bathochromic shift for the stopband of PCs with increasing the size of the latex spheres. Additionally, it also indicates that immersing PC films in the Hg2+ detection system has little effect on PC structure, which is in good agreement with the results in Fig. 1(a) and Fig. S4.†
 | ||
| Fig. 1 Typical top-view SEM image (a) and reflectance spectra (b) of Hg2+ detection PC films. The inserted numbers in (a) and (b) are the diameters of the latex spheres used. | ||
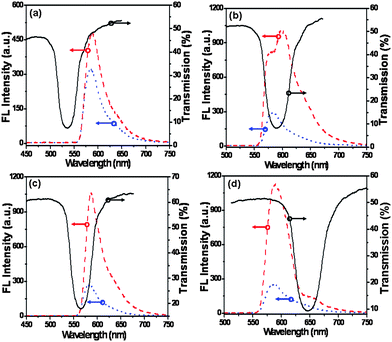
The influence of the stopband on the FL intensity of Hg2+ detection is investigated in Fig. 2. Fig. 2(a) shows that the detected FL intensity can be improved when the stopband of PCs overlaps with the excitation light wavelength of RBTHg at 532 nm. The ratio of the FL intensity of a Hg2+ detection PC film to that of the control sample is 1.4. The FL enhancement could be attributed to enhanced excitation in the FL excitation process.11a In detail, when excitation light interacted with a periodically modulated structure, the resulting high-intensity near field could efficiently excite RBTHg and contribute to the improvement of FL. Otherwise, the emitted light could be enhanced in preferred directions by means of enhanced extraction in Fig. 2(b), when the stopband of PCs overlapped with the emission wavelength of RBTHg. In detail, the ratio of the FL intensity of the Hg2+ detection PC film to that of the control sample turned to 3.4 when the stopband of 580 nm overlapped with the emission wavelength of RBTHg. In this case, the FL could couple to the overlapping local resonance mode and Bragg scatter out the structure. Thus, direct emission of FL was greatly enhanced and the amount of light trapped was reduced compared to the control sample.11a,19,20 More interestingly, the band edge of the stopband of PCs played a more important role on FL enhancement of the detection PC films. It has been theoretically demonstrated that the local density of optical states was reduced within the stopband and strongly enhanced near the band edge frequencies.21–29 The effect of red and blue edge of the stopband on the Hg2+ detection signal is further investigated in Fig. 2(c) and 2(d); it is observed that the Hg2+ detection signal is enhanced at the band edge and suppressed inside the stopband (Fig. 2(b)). As a result, the ratio changes to 3.9 when the FL peak position is at the red edge of the stopband in Fig. 2(c), while the corresponding ratio is 4.3 when the FL peak position is at the blue edge of the stopband in Fig. 2(d). And, the red-edge enhancement is attributed to the slowing and localization of light in the high index portion of PCs and indicates that some of the RBTHg is on the surfaces of the latex spheres.26,27 The blue-edge enhancement could be related to the high-intensity resonance field localized in low index material, which enhanced the interaction of light and matter. Similar phenomena for laser dyes and fluorescent protein emission in PCs have been reported by Vos and coworkers.28,29 Meanwhile, it also indicated that some of the RBTHg was in the void space of PCs.
 | ||
| Fig. 2 Fluorescence spectra of Hg2+ detection PC films (dash curve) and the control sample (dot curve) λex = 532 nm, and the transmission spectra of as-prepared PC films (solid curve); the diameters of latex spheres were (a) 210, (b) 230, (c) 220 and (d) 280 nm, respectively. Arrows indicate the relevant axis for each spectrum. | ||
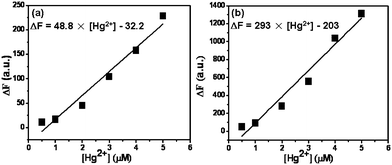
To investigate the Hg2+ detection sensitivity, a series of Hg2+ detection experiments were carried out, where the Hg2+ detection PC film with the stopband of 650 nm is used due to its biggest FL enhancement in Fig. 2(d). The concentration of probe molecule (rhodamine B thiolactone) was 5 μM and the Hg2+ concentration in detection system varied from 0.5 to 5 μM. Fig. 3 presents the relationship between the FL intensity and the Hg2+ concentration on the Hg2+ detection PC film and control sample respectively. Clearly, there is a good linearity in the FL intensity (peak position: 585 nm) for a concentration range of 0.5–5 μM Hg2+. The correlation coefficients in Fig. 3(a) and 3(b) are 0.9612 and 0.9601, respectively. The detection limit with the Hg2+ detection PC films is 10 nM (S/N = 3), which is calculated as three times the standard deviation of the background noise,30 which is 4 times lower than that of the control sample (Fig. 3(a)) and even 2 times lower than that reported in the corresponding literature.9 It should be mentioned that suitable PCs were crucial for significant improvement of the sensor sensitivity. The enhancement resulted from the combination of both large surface area of the PC samples and the optical manipulation property of PCs, while the large surface area contributed to the high adsorption of FL molecules on the PC sample compared to that on the control sample.11a In our case, the fluorescence enhancement was mainly attributed to the optical control property of PCs due to the similar adsorption of FL molecules on the Hg2+ detection PC film and control sample.
 | ||
| Fig. 3 The relationship between the fluorescence intensity and the Hg2+ concentration from 0.5 to 5 μM in (a) the control sample and (b) as-prepared Hg2+ detection PC films. | ||
In summary, a PC-based light-amplification method has been demonstrated for Hg2+ detection. The effect of different stopband on the detection signal has been investigated. The method can achieve the detection limit of ca. 10 nM via the amplification effect of blue band edge of PCs films, which was 4 times lower than that from the control sample. The amplification approach via PCs provides a low-cost and simple method to further increase the detection sensitivity of spectroscopic probes.
The authors thank the National Nature Science Foundation of China (Grant Nos. 50625312, 20421101, U0634004, 50973117), and 973 Program (No. 2006CB806200, 2006CB932100, 2006CB921706, 2007CB936403 and 2009CB930404) and Special Research Program (No. 08JK491) of the Education Office of Shaanxi Province for continuous financial support. The Chinese Academy of Sciences (No. KJCX-2-YW-M11) is gratefully acknowledged.
Notes and references
- N. Zheng, Q. C. Wang, X. W. Zhang, D. M. Zheng, Z. S. Zhang and S. Q. Zhang, Sci. Total Environ., 2007, 387, 96–104 CrossRef CAS.
- Q. Wan, X. B. Feng, J. Lu, W. Zheng, X. J. Song, S. J. Han and H. Xu, Environ. Res., 2009, 109, 201–206 CrossRef CAS.
- H. H. Harris, I. J. Pickering and G. N. George, Science, 2003, 301, 1203–1203 CrossRef CAS.
- P. D. Selid, H. Y. Xu, E. M. Collins, M. S. Face-Collins and J. X. Zhao, Sensors, 2009, 9, 5446–5459 CrossRef CAS.
- H. Wang, Y. X. Wang, J. Y. Jin and R. H. Yang, Anal. Chem., 2008, 80, 9021–9028 CrossRef CAS.
- W. F. Fitzgerald, C. H. Lamborg and C. R. Hammerschmidt, Chem. Rev., 2007, 107, 641–662 CrossRef CAS.
- X. S. Ren and Q. H. Xu, Langmuir, 2009, 25, 29–31 CrossRef CAS.
- B. C. Ye and B. C. Yin, Angew. Chem. Int. Ed., 2008, 47, 8386–8389 CrossRef CAS.
- W. Shi and H. M. Ma, Chem. Commun., 2008, 1856–1858 RSC.
- (a) G. R. Maskaly, M. A. Petruska, J. Nanda, I. V. Bezel, R. D. Schaller, H. Htoon, J. M. Pietryga and V. I. Klimov, Adv. Mater., 2006, 18, 343–347 CrossRef CAS; (b) Y. J. Zhao, X. W. Zhao, J. Hu, J. Li, W. Y. Xu and Z. Z. Gu, Angew. Chem. Int. Ed., 2009, 48, 7350–7352 CrossRef CAS; (c) J. Li, X. W. Zhao, Y. J. Zhao and Z. Z. Gu, Chem. Commun., 2009, 2329–2331 RSC; (d) J. P. Ge, J. Goebl, L. He, Z. D. Lu and Y. D. Yin, Adv. Mater., 2009, 21, 4259–4264 CrossRef CAS.
- (a) N. Ganesh, W. Zhang, P. C. Mathias, E. Chow, J. A. N. T. Soares, V. Malyarchuk, A. D. Smith and B. T. Cunningham, Nat. Nanotechnol., 2007, 2, 515–520 CrossRef; (b) W. Zhang, N. Ganesh, P. C. Mathias and B. T. Cunningham, Small, 2008, 4, 2199–2203 CrossRef CAS.
- (a) Y. Q. Zhang, J. X. Wang, Z. Y. Ji, W. P. Hu, L. Jiang, Y. L. Song and D. B. Zhu, J. Mater. Chem., 2007, 17, 90–94 RSC; (b) A. Blanco, E. Chomski, S. Grabtchak, M. Ibisate, S. John, S. W. Leonard, C. Lopez, F. Meseguer, H. Miguez, J. P. Mondia, G. A. Ozin, O. Toader and H. M. van Driel, Nature, 2000, 405, 437–440 CrossRef CAS.
- (a) M. Z. Li, F. He, Q. Liao, J. Liu, L. Xu, L. Jiang, Y. L. Song, S. Wang and D. B. Zhu, Angew. Chem. Int. Ed., 2008, 47, 7258–7262 CrossRef CAS; (b) A. Arsenault, F. Fleischhaker, G. von Freymann, V. Kitaev, H. Miguez, A. Mihi, N. Tétreault, E. Vekris, I. Manners, S. Aitchison, D. Perovic and G. A. Ozin, Adv. Mater., 2006, 18, 2779–2785 CrossRef CAS.
- (a) P. C. Mathias, N. Ganesh and B. T. Cunningham, Anal. Chem., 2008, 80, 9013–9020 CrossRef CAS; (b) J. P. Ge, Y. X. Hu and Y. D. Yin, Angew. Chem. Int. Ed., 2007, 46, 7428–7431 CrossRef CAS; (c) R. W. J. Scott, S. M. Yang, D. E. Williams and G. A. Ozin, Chem. Commun., 2003, 688–689 RSC.
- J. X. Wang, Y. Q. Wen, J. P. Hu, Y. L. Song and L. Jiang, Adv. Funct. Mater., 2007, 17, 219–225 CrossRef CAS.
- (a) J. X. Wang, J. P. Hu, Y. Q. Wen, Y. L. Song and L. Jiang, Chem. Mater., 2006, 18, 4984–4986 CrossRef CAS; (b) J. X. Wang, Y. Q. Wen, H. L. Ge, Z. Sun, Y. Zheng, Y. Song and L. Jiang, Macromol. Chem. Phys., 2006, 207, 596–604 CrossRef CAS.
- L. Y. Cui, Y. Z. Zhang, J. X. Wang, Y. B. Ren, Y. L. Song and L. Jiang, Macromol. Rapid Commun., 2009, 30, 598–603 CrossRef CAS.
- L. Y. Cui, Y. F. Li, J. X. Wang, E. T. Tian, X. Y. Zhang, Y. Z. Zhang, Y. L. Song and L. Jiang, J. Mater. Chem., 2009, 19, 5499–5502 RSC.
- S. H. Fan, P. R. Villeneuve, J. D. Joannopoulos and E. F. Schubert, Phys. Rev. Lett., 1997, 78, 3294–3297 CrossRef.
- M. Zelsmann, E. Picard, T. Charvolin, E. Hadji, M. Heitzmann, B. Dal'zotto, M. E. Nier, C. Seassal, P. Rojo-Romeo and X. Letartre, Appl. Phys. Lett., 2003, 83, 2542–2544 CrossRef CAS.
- (a) X. Wang, R. Wang, B. Gu and G. Yang, Phys. Rev. Lett., 2002, 88, 093902-1–093902-4; (b) P. Lodahl, A. F. Van Driel, I. S. Nikolaev, A. Irman, K. Overgaag, D. Vanmaekelbergh and W. L. Vos, Nature, 2004, 430, 654–657 CrossRef CAS.
- E. Yablonovitch, J. Phys.: Condens. Matter, 1993, 5, 2443–2460 CrossRef.
- R. Z. Wang, X. H. Wang, B. Y. Gu and G. Z. Yang, Phys. Rev. B, 2003, 67, 155114-1–155114-7.
- T. Quang, M. Woldeyohannes and S. John, Phys. Rev. Lett., 1997, 79, 5238–5241 CrossRef CAS.
- S. John and J. Wang, Phys. Rev. Lett., 1990, 64, 2418–2421 CrossRef CAS.
- (a) J. I. L. Chen, G. von Freymann, S. Y. Choi, V. Kitaev and G. A. Ozin, J. Mater. Chem., 2008, 18, 369–373 RSC; (b) J. I. L. Chen, G. von Freymann, S. Y. Choi, V. Kitaev and G. A. Ozin, Adv. Mater., 2006, 18, 1915–1919 CrossRef CAS; (c) A. C. Arsenault, T. J. Clark, G. Von Freymann, L. Cademartiri, R. Sapienza, J. Bertolotti, E. Vekris, S. Wong, V. Kitaev, I. Manners, R. Z. Wang, S. John, D. Wiersma and G. A. Ozin, Nat. Mater., 2006, 5, 179–184 CrossRef CAS.
- S. Nishimura, N. Abrams, B. A. Lewis, L. I. Halaoui, T. E. Mallouk, K. D. Benkstein, J. van de Lagemaat and A. J. Frank, J. Am. Chem. Soc., 2003, 125, 6306–6310 CrossRef CAS.
- L. Bechger, P. Lodahl and W. L. Vos, J. Phys. Chem. B, 2005, 109, 9980–9988 CrossRef CAS.
- C. Blum, A. P. Mosk, I. S. Nikolaev, V. Subramaniam and W. L. Vos, Small, 2008, 4, 492–496 CrossRef CAS.
- M. H. Ha-Thi, M. Penhoat, V. Michelet and I. Leray, Org. Lett., 2007, 9, 1133–1136 CrossRef CAS.
Footnote |
| † Electronic supplementary information (ESI) available: Details of the fabrication of PC films, characterization, the reflectance spectra of the Hg2+ detection PC film and the corresponding control sample, SEM images of PC films and Hg2+ detection PC films, reflectance and transmission spectra of as-prepared PC films. See DOI: 10.1039/c0ay00154f |
| This journal is © The Royal Society of Chemistry 2010 |
