DOI:
10.1039/C0AY00062K
(Paper)
Anal. Methods, 2010,
2, 1043-1050
Sildenafil and N-desmethyl sildenafil quantification in human plasma by HPLC coupled with ESI-MS/MS
detection: Application to bioequivalence study
Received
26th January 2010
, Accepted 10th May 2010
First published on 6th July 2010
Abstract
The present study aims at developing a simple, sensitive and specific liquid chromatography-tandem mass spectrometry (LC–MS/MS) method for simultaneous
quantification of sildenafil and its metabolite
N-desmethyl sildenafil in human plasma using
sildenafil-d8, N-desmethyl sildenafil-d8 as internal standards (IS). Chromatographic separation was performed on Zorbax SB C18,
4.6 × 75 mm, 3.5 μm column with an isocratic mobile phase
composed of 10 mM ammonium acetate and acetonitrile (5/95 v/v), at a flow-rate of 0.6 ml
min−1. Sildenafil, sildenafil-d8, N-desmethyl sildenafil and N-desmethyl sildenafil-d8 were detected with proton adducts at m/z 475.2 → 283.4, 483.4 → 283.4, 461.3 →
283.4 and 469.4 → 283.4 in multiple reaction monitoring (MRM) positive mode respectively. Both drug,
metabolite and internal standards were extracted by
liquid–liquid extraction. The method was validated over a
linear concentration range of 1.0–1000.0 ng ml−1 for sildenafil and 0.5–500.0 ng ml−1 for N-desmethyl sildenafil with correlation coefficient
(r2) ≥ 0.9998 for sildenafil and
(r2) ≥ 0.9987 for N-desmethyl
sildenafil. This method demonstrated intra and inter-day precision within 1.5
to 5.1 and 2.2 to 3.4% for sildenafil and within 1.3
to 3.1 and 2.8 to 4.3% for N-desmethyl
sildenafil. This method demonstrated intra and inter-day accuracy for
sildenafil within 97.3 to 98.3 and 96.7 to 97.2% and
for N-desmethyl sildenafil within 95.3 to
96.3 and 95.0 to 97.2%. Both analytes were found to be
stable throughout three freeze/thaw cycles, bench top and postoperative stability studies.
This method was used successfully for the analysis of plasma samples following oral
administration of 100 mg in 43 healthy Indian male human volunteers under fasting
conditions.
Introduction
Sildenafil is 1-[4-ethoxy-3-(6, 7-dihydro-l-methyl-7-oxo-3-propyl-lH-pyrazolo[4,3-d]pyrimidin-5-yl)phenylsulfonyl]-4-methylpiperazine
citrate. The empirical formula is C22H30N6O4S
and its free molecular weight is 474.6. Sildenafil
citrate is sold as viagra, revatio and as well as under various other trade
names. It is used to treat erectile dysfunction and pulmonary arterial hypertension
(PAH). The mechanism of action of phosphodiesterase
(PDE5) leading to smooth muscle relaxation (vasodilation)
of the intimal cushions of the helicine arteries results
in increased inflow of blood and an erection. Sildenafil is metabolized by liver enzymes and excreted by both the liver
and kidney. If taken with a high-fat meal absorption is reduced.1
The majority of the methods were developed for quantification of sildenafil alone from pharmaceutical,11,16 biological samples9,10,12–15,17–19,22 and ayurvedic products20
by using LC-MS/MS,9–20
capillary electrophoresis21 and ion mobility spectrophotometry.22 A literature survey reveals that only a few methods were
reported for quantification of sildenafil and its main
metabolite
N-desmethyl sildenafil from biological
samples by LC-MS/MS,2–6 capillary zone electrophorsis-ion trap mass spectrometry7 and
micellar electrokinetic capillary chromatography.8 Most of the reported methods2–6 show that extraction of sildenafil and its main
metabolites are made using solid
phase extraction.
In the present study, we have reported a highly sensitive, selective and reproducible
analytical method for the determination of sildenafil,
and its metabolite
N-desmethyl sildenafil in plasma samples
utilizing liquid chromatography coupled to electrospray
(ES) tandem mass
spectrometry by using liquid–liquid extraction
methods. Deuterated compounds sildenafil-d8, N-desmethyl sildenafil-d8 were used as an internal
standards. We have developed and validated the method as per the FDA guidelines over a concentration range of 1.0–1000.0 ng ml−1 for
sildenafil and 0.5–500.0 ng ml−1 for
N-desmethyl sildenafil using 250 μL plasma
sample followed by a simple liquid–liquid extraction
technique for extraction of drug and internal standards. The retention
times of sildenafil, sildenafil-d8 were 1.6 ± 0.2 min, for N-desmethyl sildenafil 1.7 ± 0.2 min, and 1.8 ± 0.2 min for
N-desmethyl sildenafil-d8 with total
runtime of 5.0 min. This method was fully validated as per FDA guidelines and was successfully employed in the analysis of plasma
samples following oral administration of Sildenafil
tablets (100 mg) in healthy human volunteers.23,24
Materials and methods
Chemicals
Sildenafil, sildenafil-d8, N-desmethyl
sildenafil, N-desmethyl
sildenafil-d8 were obtained from Apotex Torronto, Canada. All other chemicals obtained
from SD- fine chemicals, Mumbai, India.
Instrumentation
HPLC system (Agilent Technologies 1200 series,
Waldbronn, Germany) equipped with MS/MS. Mass
spectrometric detection was performed using Applied bio systems API 4000 model
(ABI-SCIEX, Toronto, Canada). Data processing was
performed on Analyst 1.4.1 software package.
Turbo ion spray source (API) positive mode with unit resolution, MRM was used for the detection. For sildenafil, N-desmethyl
sildenafil the [M + H]+ monitored
precursor ions were m/z 475.2 and m/z 461.3
respectively. For internal standards sildenafil-d8
and N-desmethyl sildenafil-d8, the
monitored [M + H]+ precursor ions were
m/z 483.4 and m/z 469.4. As the fragment ions, the
m/z 283.4 was used for all of the four compounds. The source
temperature was maintained at 500 °C and the ion source
consisted of gas channels, nebulizer gas 20 psi, heater gas/desolvation gas 30 psi and
collisionally-activated dissociation (CAD) gas 4 psi (nitrogen). The
electrospray source was operated in the positive (ES+) at 5500 V. Source flow rate 600 μL min−1 without
split, entrance potential 10 V, collision cell exit
potential (CXP) 7V, declustering potential (DP) 103 V, and collision energy (CE) 40 V
for sildenafil similarly for sildenafil-d8, N-desmethyl sildenafi, N-desmethyl sildenafil-d8, declustering potential (DP) 110V and
collision energy 39 V, 37 V and 38 V respectively.
Chromatographic conditions
Zorbax SB C18, 4.6 mm × 75 mm, 3.5 μm, was selected as the analytical column. The
mobile phase was 10 mM ammonium acetate and acetonitrile
(5/95, v/v). The flow rate of the mobile phase was set at
0.6 ml min−1. The column temperature was set at 45 °C. Sildenafil-d8,
N-desmethyl sildenafil-d8 were found to
be appropriate internal standards in terms of chromatography and extractability. The retention times of sildenafil, sildenafil-d8 were 1.6 ± 0.2 min, for N-desmethyl sildenafil 1.7 ± 0.2 min, and 1.8 ± 0.2
min for N-desmethyl sildenafil-d8 with
total runtime of 5.0 min.
Preparation of calibration standards and quality control (QC) samples
Standard stock solutions of sildenafil, N-desmethyl sildenafil (100μg ml−1) and
sildenafil-d8, N-desmethyl sildenafil-d8 (100μg ml−1) were prepared
using methanol. IS
spiking solutions for sildenafil-d8 (750 ng
ml−1) and N-desmethyl
sildenafil-d8 (250 ng ml−1) were prepared in methanol from respective standard stock solutions and IS spiking solutions were stored in refrigerator conditions
(2–8 °C) until analysis. Standard stock solutions were added to drug-free human plasma to obtain sildenafil/N-desmethyl
sildenafil concentration levels of 1.0/0.5, 2.0/1.0, 10.0/5.0, 50.0/25.0,
100.0/50.0, 200.0/100.0, 400.0/200.0, 600.0/300.0, 800.0/400.0, and 1000.0/500.0 ng
ml−1 for analytical standards and 1.0/0.5, 3.0/1.5, 40.0/20.0, 300.0/150.0,
700.0/350.0 ng ml−1 for quality control standards and stored in a −30 °C set
point freezer until analysis. The aqueous standards were prepared in reconstitution
solution (10 mM ammonium acetate and acetonitrile (5/95, v/v), for validation exercises until
analysis
Liquid–liquid extraction was used to isolate sildenafil/N-desmethyl
sildenafil and its respective IS from human
plasma. 50 μL of IS (750.0/250.0 ng ml−1) and
250 μl of plasma sample (respective concentration) were added into labeled polypropylene
tubes or ria vials placed in an ice bath and vortexed briefly. Then 2.5 ml of extraction
solvent (methyl t-butyl
ether) were added. The vials were closed with tight
caps and vortexed for 10 min following centrifugation at
4000 rpm and 20 °C for 10 min. The samples were flash frozen by using dry-ice/acetonitrile and the supernatant was transferred into
labeled polypropylene tubes or ria vials. The samples were then evaporated to dryness at
40 °C under nitrogen. Finally the dried residue samples
were reconstituted with 250 μl of reconstitution solution and vortexed briefly. The
sample was then transferred into auto sampler vials for injection
Recovery
Recoveries of sildenafil and N-desmethyl sildenafil were evaluated by comparing
the mean peak area of six extracted low, medium and high quality control samples
(3.0/1.5, 300.0/150.0 and 700.0/350.0 ng ml−1) to mean peak area of six
extracted-spiking drug free plasma samples with the same
amount of low, medium and high sildenafil/N-desmethyl sildenafil quality control samples.
Similarly recovery of sildenafil-d8 and N-desmethyl sildenafil-d8 were evaluated by
comparing the mean peak area of six extracted quality control samples to mean peak area
of sildenafil-d8/N-desmethyl
sildenafil-d8 in samples prepared by spiking
extracted drug free-plasma samples with the same amount
of sildenafil-d8/N-desmethyl sildenafil-d8.
Limit of quantification (LOQ)
Limit of quantification was estimated in accordance with baseline noise method. The LOQ
was estimated at a signal-to-noise ratio (S/N) of
5. LOQ was experimentally performed by six injections of sildenafil and N-desmethyl
sildenafil at LOQ concentration Fig. 2b.
Calibration curve, regression model, precision and accuracy
The analytical curves were constructed using values ranging from 1.0 to 1000.0 ng
ml−1 for sildenafil and 0.5–500.0 ng
ml−1 for N-desmethyl
sildenafil in human plasma. Calibration curves were obtained by weighted
1/conc2 quadratic regression analysis. The ratio of sildenafil peak area to sildenafil-d8 peak area was plotted against the ratio of sildenafil concentration to that of sildenafil-d8 concentration in ng ml−1. Similarly the ratio of
N-desmethyl sildenafil peak area to
N-desmethyl sildenafil-d8 peak area was
plotted against the ratio of N-desmethyl
sildenafil concentration to that of N-desmethyl sildenafil-d8 concentration in ng ml−1.
Calibration curve standard samples and quality control samples were prepared in
replicates (n = 6) for analysis. The correlation coefficient >0.9998 and
>0.9987 was obtained for sildenafil and N-desmethyl sildenafil respectively. Precision and
accuracy for the back calculated concentrations of the calibration points should be
within ±15% of their nominal values. However, for LLOQ the precision and accuracy must
be within ±20%.
Stability (freeze- thaw, auto sampler, bench top, long term)
Low quality control and high quality control samples (n = 6) were retrieved
from the deep freezer after three freeze–thaw cycles according to the clinical
protocols. Samples were stored at −30 °C in three cycles of 24, 36 and 48 h. In addition
long-term stability of sildenafil/N-desmethyl sildenafil in quality control samples
were also evaluated by analysis after 80 days of storage
at −30 °C. Autosampler stability was studied following
31 h storage period in the autosampler tray. Bench top stability was studied for 45 h period with
control concentrations. Stability samples were processed and extracted along with the
freshly spiked calibration curve standards. The precision and accuracy for the stability
samples must be within ±15% respectively of their nominal concentrations.
Analysis of patient samples
The bioanalytical method described above was applied to determine sildenafil/N-desmethyl
sildenafil concentrations in plasma following oral administration of
healthy human volunteers. These volunteers were contracted in APL Research Pvt. Ltd.,
Hyderabad, India and to each one of the 43 healthy volunteers were administered a 100 mg
dose (one 100 mg tablet) orally with 240 ml of drinking
water. The product viagra tablets (Pfizer, UK) 100
mg, the product viagra tablets (Pfizer, Australia) 100 mg and test product sildenafil citrate tablet (test tablet) 100 mg were used.
Study protocol was approved by IEC (Institutional
Ethical committee) and by ICMR (Indian Council of
Medical Research). Blood samples were collected as pre-dose(0) hr 5 min prior to dosing followed by further samples at 0.25,
0.5, 0.75, 1.0, 1.333, 1.667, 2.0, 2.5, 3.0, 4.0, 5.0, 6.0, 8.0, 10.0, 12.0, 14.0, 18.0,
20.0 and 24.0 h. After dosing, 6 ml blood sample was collected each pre-established time
in vaccutainers containing K2EDTA. A total of 60 (20 time points for
reference-1, 20 for reference-2, and 20 for test) time points were collected and
centrifuged at 3200 rpm, 10 °C, 10 min. Then they were kept frozen at −30 °C until
sample analysis. Test and reference were administered to the same human volunteers under
fasting conditions separately with proper washing periods as per protocol approved by
IEC.
Pharmacokinetics and statistical analysis
Pharmacokinetics parameters from human plasma samples were calculated by a
non-compartmental statistics model using WinNon-Lin5.0 software (Pharsight, USA). Blood
samples were taken for a period of 3 to 5 times the terminal elimination half-life
(t1/2) and it was considered as the area under the concentration time curve
(AUC) ratio higher than 80% as per FDA guidelines.
Plasma sildenafil, N-desmethyl sildenafil concentration-time profiles were
visually inspected and Cmax and Tmax values were
determined. The AUC0–t was obtained by trapezoidal method. AUC0–∞
was calculated up to the last measureable concentration and extrapolations were obtained
using the last measureable concentration and the terminal elimination rate constant
(Ke). The terminal
elimination rate constant (Ke),
was estimated from the slope of the terminal exponential phase of the plasma of
sildenafil, N-desmethyl sildenafil concentration-time curve (by means of the
linear regression method). The terminal elimination half-life t1/2
was then calculated as 0.693/Ke. Regarding AUC0–t and Cmax
bioequivalence was assessed by means of analysis of variance (ANOVA) and calculating the standard 90% confidence intervals (90% CIs) of the ratios test/reference (logarithmically transformed
data). The bioequivalence was considered when the ratio of averages of log transformed
data was within 80–125% for AUC0–t, AUC0–∞ and
Cmax.24,25
Results and discussion
Method development and validation
LC-MS/MS has been used as one of the most powerful
analytical tool in clinical pharmacokinetics for its selectivity, sensitivity and
reproducibility. The goal of this work is to develop and validate a simple, rapid and
sensitive assay method for the quantitative determination of sildenafil, N-desmethyl
sildenafil from plasma samples. A simple extraction technique was utilized in the extraction of drug, metabolite and internal standards from plasma samples. Chromatographic
conditions, especially the composition and nature of the mobile
phase were optimized through several trials to achieve best resolution and
increase the signal of analytes and respective IS. The MS optimization was
performed by direct infusion of solutions into ESI
source of the mass spectrometer. One of the
most critical parameters in the ESI technique is the needle voltage, which is directly
related to the charged droplet formation and to the amount of gaseous ions formed.
Capillary voltage was related to the gaseous ion guidance to the inside of the MS and is the last barrier between the atmospheric pressure
and the high vacuum of the mass spectrometer.
Other parameters, such as the nebulizer and the desolvation gases were optimized to
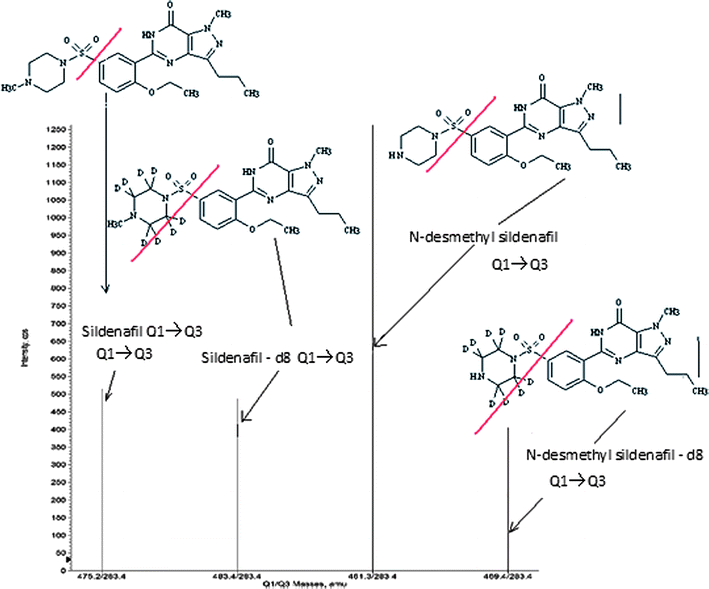
obtain a better spray shape, resulting in better ionization. A CAD product ion spectrum for sildenafil, N-desmethyl
sildenafil and sildenafil-d8, N-desmethyl sildenafil-d8 yielded high-abundance
fragment ions of m/z 283.4 for all (Fig.
1). After the MRM channels were tuned, the
mobile phase was changed from an aqueous phase to more
organic phase to obtain a fast and selective LC method. A
good separation and elution were achieved using 10 mM ammonium
acetate/acetonitrile (5/95 v/v) as the
mobile phase, at a flow-rate of 0.6 ml min−1
and injection volume of 10 μl. Validation was proved as per FDA guidelines23
Specificity
The analysis of sildenafil, N-desmethyl sildenafil and sildenafil-d8, N-desmethyl
sildenafil-d8 using MRM function was highly
selective with no interfering compounds (Fig. 2a).
Chromatograms obtained from plasma spiked with
sildenafil (1000.0 ng ml−1), N-desmethyl sildenafil (500.0 ng ml−1)
and sildenafil-d8 (750 ng ml−1) and
N-desmethyl sildenafil-d8 (250 ng
ml−1) are shown in Fig. 2c.
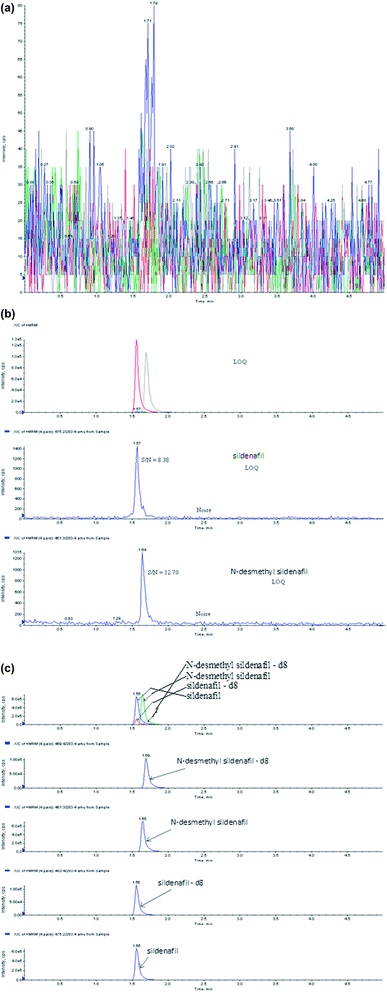 |
| | Fig. 2 MRM
chromatograms of (a) blank, (b) sildenafil and N-desmethyl sildenafil at LOQ concentration and (c) sildenafil, N-desmethyl
sildenafil, sildenafil-d8 and
N-desmethyl sildenafil-d8 at ULQ concentrations. | |
Limit of quantification (LOQ)
The LOQ signal-to-noise (S/N) values found for six
injections of sildenafil/N-desmethyl sildenafil at LOQ concentration were 8.38 and 12.30
respectively.
Linearity, precision and accuracy
Calibration curves were plotted against the peak area ratio (sildenafil/sildenafil-d8)
versus (sildenafil) concentration for
sildenafil and the peak area ratio (N-desmethyl sildenafil/N-desmethyl sildenafil-d8) versus (N-desmethyl
sildenafil) concentration for N-desmethyl sildenafil. Calibration was found to be
linear over the concentration range of 1.0–1000.0 ng ml−1 for sildenafil and 0.5–500.0 ng ml−1 for N-desmethyl sildenafil. The RSDs for sildenafil, N-desmethyl sildenafil were less than 2.1% and 4.2%
respectively. The accuracy ranged from 97.4 to 101.6% for sildenafil and 98.6 to 101.7% for N-desmethyl sildenafil. The determination coefficients
(r2) for sildenafil, and
N-desmethyl sildenafil were greater than
0.9998 and 0.9987, respectively for all curves (Table
1). Precision and accuracy for this method was controlled by calculating
the intra and inter-batch variations of QC samples
in six replicates at three concentrations (3.0, 300.0 and 700.0 ng ml−1) for
sildenafil, (1.5, 150.0 and 350.0 ng
ml−1) for N-desmethyl
sildenafil as shown in Table 2. The
intra-batch RSDs were less than 5.1% for sildenafil and less than 2.3% for N-desmethyl sildenafil. These results indicate the adequate
reliability and reproducibility of this method within the analytical range. This method
demonstrated intra and inter-day accuracy within 97.3% to 98.3% and 96.7% to 97.2% for
sildenafil and accuracy within 95.8% to 96.3% and
95% to 97.2% for N-desmethyl
sildenafil.
Table 1 Spiked plasma, concentration and RSD for
sildenafil, and N-desmethyl sildenafil
| Spiked plasma, concentration/ng ml−1 |
Concentration measured (mean)/ng ml−1 ± SD |
RSDa (%)
(n = 6) |
Accuracy % |
|
[Standard deviation/mean concentration measured] ×
100.
|
|
sildenafil
|
| 1.0 |
1.01 ± 0.02 |
2.0 |
101.0 |
| 2.0 |
1.98 ± 0.06 |
3.0 |
99.0 |
| 10.0 |
10.14 ± 0.12 |
1.2 |
101.4 |
| 50.0 |
49.92 ± 0.45 |
0.9 |
99.8 |
| 100.0 |
97.42 ± 1.37 |
1.4 |
97.4 |
| 200.0 |
201.93 ± 2.53 |
1.3 |
101.0 |
| 400.0 |
406.01 ± 4.88 |
1.2 |
101.5 |
| 600.0 |
609.76 ± 6.64 |
1.1 |
101.6 |
| 300.0 |
790.69 ± 16.63 |
2.1 |
98.8 |
| 1000.0 |
991.31 ± 13.48 |
1.4 |
99.1 |
|
N-desmethyl sildenafil
|
| 0.5 |
0.504 ± 0.010 |
2.0 |
100.8 |
| 1.0 |
0.986 ± 0.041 |
4.2 |
98.6 |
| 5.0 |
4.976 ± 0.087 |
1.7 |
99.5 |
| 25.0 |
25.435 ± 0.128 |
0.5 |
101.7 |
| 50.0 |
49.464 ± 0.382 |
0.8 |
98.9 |
| 100.0 |
99.937 ± 1.409 |
1.4 |
99.9 |
| 200.0 |
202.205 ± 2.539 |
1.3 |
101.1 |
| 300.0 |
299.982 ± 4.386 |
1.5 |
100.0 |
| 400.0 |
397.694 ± 11.488 |
2.9 |
99.4 |
| 500.0 |
500.313 ± 7.555 |
1.5 |
100.1 |
Table 2 Within-run and between-run data
| Spiked plasma concentration/ng
ml−1 |
Within-run |
Between-run |
| Concentration measured (n = 6)/ng ml−1
(mean ±S.D.) |
RSD.a (%) |
Accuracy (%) |
Concentration measured (n = 36)/ng ml−1
(mean ± S.D.) |
RSD.a (%) |
Accuracy (%) |
|
[Standard deviation/mean concentration measured] ×
100.
|
| Precision and accuracy for sildenafil |
| 3.0 |
2.92 ± 0.15 |
5.1 |
97.3 |
2.90 ± 0.10 |
3.4 |
96.7 |
| 300.0 |
294.77 ± 6.14 |
2.1 |
98.3 |
291.72 ± 9.15 |
3.1 |
97.2 |
| 700.0 |
684.65 ± 10.02 |
1.5 |
97.8 |
678.96 ± 15.10 |
2.2 |
97.0 |
| Precision and accuracy for N-desmethyl sildenafil |
| 1.5 |
1.441 ± 0.044 |
3.1 |
96.1 |
1.425 ± 0.061 |
4.3 |
95 |
| 150.0 |
144.460 ± 1.887 |
1.3 |
96.3 |
145.747 ± 4.558 |
3.1 |
97.2 |
| 350.0 |
335.250 ± 7.578 |
2.3 |
95.8 |
340.129 ± 9.572 |
2.8 |
97.2 |
Stability (freeze–thaw, auto sampler, bench top, long term)
The Quantification of the sildenafil, N-desmethyl sildenafil in plasma subjected to 3
freeze-thaw cycles (−30 °C to room temperature) showed the stability of the analytes. The concentrations ranged from 97.0 to 103.0% for
sildenafil and 98.0 to 103.0% for N-desmethyl sildenafil. No significant degradation was observed even after 31 h storage period in the autosampler tray and the final concentrations of sildenafil, N-desmethyl
sildenafil were between 98.0 to 107.0% and 97.0 to 102.0%. The room
temperature stability of sildenafil, N-desmethyl sildenafil in QC samples after 45 h was also evaluated. The concentrations ranged from
95.0 to 103.0% for sildenafil and 96.0 to 104.0% for
N-desmethyl sildenafil. In addition, the
long-term stability in low, high QC samples after
80 days of storage at −30 °C was also evaluated. The
concentrations ranged from 90.0 to 104.0% for sildenafil and 95.0 to 103.0% for N-desmethyl sildenafil. These results confirmed the stabilities
of sildenafil, N-desmethyl sildenafil in human plasma for at least 80 days at
−30 °C. (Table 3)
Table 3 Stabilities of sildenafil, N-desmethyl sildenafil in human plasma
| Spiked plasma concentration/ng
ml−1 |
Room temperature stability |
Processed sample stability |
Long term stability |
Freeze and thaw stability |
| 45 h |
31 h |
80 days |
Cycle 3 (48 h) |
| Concentration measured (n = 6)/ng ml−1
(mean ± S D) |
RSD.a (n = 6) (%) |
Concentration measured (n = 6)/ng ml−1
(mean ± S D) |
RSD.a (n = 6) (%) |
Concentration measured (n = 6)/ng ml−1
(mean ± S D) |
RSD.a (n = 6) (%) |
Concentration measured (n = 6)/ng ml−1
(mean ± S D) |
RSD.a (n = 6) (%) |
|
[Standard deviation/mean concentration measured] ×
100.
|
| Stability of the samples for sildenafil |
| 3.0 |
2.94 ± 0.06 |
1.99 |
2.99 ± 0.11 |
3.52 |
2.89 ± 0.10 |
3.56 |
2.93 ± 0.03 |
0.89 |
| 700.0 |
659.5 ± 22.91 |
3.47 |
690.17 ± 16.04 |
2.32 |
660.2 ± 15.39 |
2.79 |
666.53 ± 7.83 |
1.17 |
| Stability of the samples for N-desmethyl sildenafil |
| 1.5 |
1.41 ± 0.04 |
2.75 |
1.48 ± 0.03 |
2.03 |
1.49 ± 0.05 |
3.13 |
1.40 ± 0.03 |
2.19 |
| 350.0 |
334.17 ± 9.64 |
2.89 |
350.83 ± 3.43 |
0.98 |
343.6 ± 13.07 |
3.80 |
341.83 ± 3.92 |
1.15 |
Recovery
The extraction recoveries of sildenafil and N-desmethyl
sildenafil determined at three different concentrations (3.0/1.5,
300.0/150.0 and 700.0/350.0 ng ml−1) were found to be 71.37, 73.85, 75.46%
and 60.0, 65.38, 66.52% respectively.The overall average recoveries of sildenafil/N-desmethyl
sildenafil were found to be 73.45 and 63.97% respectively. The overall
average recoveries of sildenafil-d8 and N-desmethyl sildenafil-d8 were found to be 77.54
and 69.57% respectively. Recoveries of the analyte and
IS were high and were consistent precise and
reproducible.
Application to biological samples
The above validated method was used in the determination of sildenafil and N-desmethyl
sildenafil in plasma samples for establishing the bioequivalence of a
single 100 mg dose (one 100 mg tablet) in 43 healthy volunteers. Typical plasma
concentration versus time profiles are shown in Fig.
3 and Fig. 4. All the plasma concentrations of
sildenafil and N-desmethyl sildenafil were in the standard curve region and
retained above LLOQ for the entire sampling period. The observed values were reported in
Table 4 and Table
5 for sildenafil and for N-desmethyl sildenafil. Therefore, it can be
concluded that the three analyzed formulations (ref. 1, ref.
2 and test) are bioequivalent.
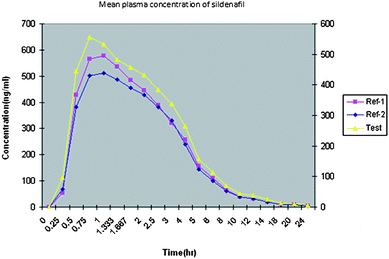 |
| | Fig. 3 Typical plasma concentration versus time profiles for sildenafil. | |
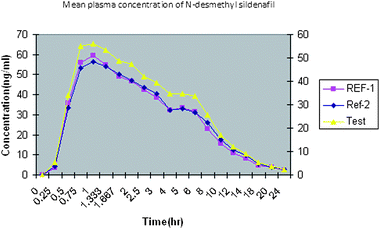 |
| | Fig. 4 Typical plasma concentration versus time profiles for N-desmethyl sildenafil. | |
Table 4 Pharmacokinetic details for Sildenafil and
N-Desmethyl Sildenafil
| Pharmacokinetic parameter |
Ref. 1
|
Ref. 2
|
Test |
| Pharmacokinetic details for Sildenafil |
| Cmax ng ml−1 |
577.48 ± 218.77 |
510.40 ± 199.41 |
556.33 ± 206.61 |
| Tmax hr |
1 |
1 |
1 |
| AUC
0-t ng hr/ml |
2374.23 ± 75.58 |
2254.88 ± 72.19 |
2421.15 ± 73.85 |
| AUC
0-∞ ng hr/ml |
2416.67 ± 83.43 |
2297.15 ± 79.76 |
2469.67 ± 80.54 |
| t1/2 hr |
5.02 |
5.00 |
4.90 |
| Kel |
0.13813 |
0.13870 |
0.14156 |
| Pharmacokinetic data for N-Desmethyl Sildenafil |
| Cmax ng ml−1 |
59.47 ± 20.18 |
56.52 ± 19.52 |
56.07 ± 19.52 |
| Tmax hr |
1 |
1 |
1 |
| AUC
0-t ng hr/ml |
412.58 ± 13.01 |
431.49 ± 13.90 |
431.76 ± 14.33 |
| AUC
0-∞ ng hr/ml |
432.99 ± 14.74 |
450.33 ± 14.93 |
450.49 ± 15.26 |
| t 1/2 hr |
5.63 |
5.15 |
5.00 |
| Kel |
0.12317 |
0.13853 |
0.13853 |
Table 5 Bioequivalence of analyzed formulations
| Test/Reference |
Sildenafil
|
N-Desmethyl Sildenafil
|
| Cmax (T/R1) |
96.42 |
94.29 |
| AUC 0-t (T/R1) |
101.97 |
104.S9 |
| AUC 0-inf (T/R1) |
102.19 |
104.04 |
| Cmax (T/R2) |
109.09 |
99.21 |
| AUC 0-t (T/R2) |
107.37 |
100.30 |
| AUC 0-inf (T/R2) |
107.51 |
100.03 |
Conclusions
In this article we have reported the use of LC-MS/MS for
the accurate, precise and reliable measurement of sildenafil and N-desmethyl
sildenafil concentrations in human plasma after oral administration of 100 mg
to healthy volunteers. The method described here is fast, robust, and sensitive. Each
sample requires less than 5 min run time. The assay method is also highly specific due to
the inherent selectivity of tandem mass spectrometry and
has significant advantages over other techniques previously described for measuring
sildenafil and N-desmethyl sildenafil in biological fluids. The sensitivity of the
assay is sufficient to follow accurately the pharmacokinetics of sildenafil and N-desmethyl
sildenafil following oral administration.
Acknowledgements
Authors wish to thank the support received from IICT (Indian institute of chemical
technology) Hyderabad India for providing Literature survey and APL Research Pvt. Ltd.,
Hyderabad, India for helping this Research work.
References
-
http://en.wikipedia.org/wiki/Sildenafil
.
- C. Pistos, I. Papoutsis, A. Dona, M. Stefanidou, S. Athanaselis, C. Maravelias and C. Spiliopoulou, Forensic Sci. Int., 2008, 178(2–3), 192 CrossRef CAS.
- R. J. Lewis, R. D. Johnson and C. L. Blank, J Anal Toxico!, 2006, 30(1), 14 Search PubMed.
- V. Dumestre-Toulet, V. Cirimele, S. Gromb, T. Belooussoff, D. Lavault, B. Ludes and P. Kintz, Forensic Sci. Int., 2002, 126(1), 71–6 CrossRef CAS.
- W. Weinmann, M. Bohnert, A. Wiedemann, M. Renz, N. Lehmann and S. Pollak, Int. J. Legal Med., 2001, 114(4–5), 252 CrossRef CAS.
- H. Y. Ku, J. H. Shon, K. H. Liu, J. G. Shin and S. K. Bae, J Chromatogr B Analyt Technol Biomed Life Sci, 2009, 877(1–2), 95 CrossRef CAS.
- W. Qin and S. F. Li, Electrophoresis, 2002, 23(24), 4110 CrossRef CAS.
- J. J. Berzas Nevado, J. Rodriguez Flores, G. Castaneda Penalvo and N. Rodriguez Farinas, Electrophoresis, 2001, 22(10), 2004 CrossRef CAS.
- K. M. Alkharfy, J. Sep. Sci., 2009, 32(22), 3866 CrossRef CAS.
- G. Teng, Y. Wang, Y. Tang, R. Wang, Y. Fang, J. P. Fawcett and J. Gu, J. Chromatogr., B: Anal. Technol. Biomed. Life Sci., 2007, 859(2), 256 CrossRef CAS.
- Y. Xu, G. Xu and Se Pu, Chinese, 2005, 23(6), 633–5 Search PubMed.
- W. Z. Shou and W. Naidong, J. Chromatogr., B: Anal. Technol. Biomed. Life Sci., 2005, 825(2), 186 CrossRef CAS.
- Y. Wang, J. Wang, Y. Cui, J. P. Fawcett and J. Gu, J Chromatogr B Analyt Technol Biomed Life Sci, 2005, 828(1–2), 118 CrossRef CAS.
- R. J. Lewis, R. D. Johnson and C. L. Blank, J Anal Toxicol, 2006, 30(1), 14 CAS.
- H. A. Toque, C. E. Teixeira, R. Lorenzetti, C. E. Okuyama, E. Antunes and G. De Nucci, Eur. J. Pharmacol., 2008, 591(1–3), 189 CrossRef CAS.
- A. C. Spinola, S. Almeida, A. Filipe, M. Tanguay and M. Yritia, Arzneimittelforschung, 2008, 58(3), 122 CAS.
- S. K. Lee, Y. Kim, T. K. Kim, G. J. Im, B. Y. Lee, D. H. Kim, C. Jin and H. H. Yoo, J. Pharm. Biomed. Anal., 2009, 49(2), 513 CrossRef CAS.
- W. Weinmann, N. Lehmann, C. Muller, A. Wiedemann and M. Svoboda, Forensic Sci. Int., 2000, 113(1–3), 339 CrossRef CAS.
- M. Thevis, Y. Schrader, A. Thomas, G. Sigmund, H. Geyer and W. J. Schanzer, Anal Toxico, 2008, 32(3), 232 Search PubMed.
- S. R. Gratz, C. L. Flurer and K. A. Wolnik, J. Pharm. Biomed. Anal., 2004, 36(3), 525 CrossRef CAS.
- R. K. Li, T. Bo, H. W. Liu, K. A. Li and P. Se, Chinese, 2002, 20(4), 335 Search PubMed.
- C. M. Gryniewicz, J. C. Reepmeyer, J. F. Kauffman and L. F. Buhse, J. Pharm. Biomed. Anal., 2009, 49(3), 601 CrossRef CAS.
-
Guidance for industry bioanalytical method validation, U.S.Department of Health and Human Services, Food and Drug
Administration, Center for Drug Evaluation and Research (CDER), Center for Biologics
Evaluation and Research (CBER), May 2001 Search PubMed.
-
Guidance for industry Food- effect bio availability and Fed Bio equivalence
studies. U.S.Department of Health and Human services Food and Drug
Administration Centre for Drug Evaluation and research (CDER) December
2002 Search PubMed.
-
Guidance for industry Bio availability and Fed Bio equivalence Studies for
Orally Administered Drug Products-General considerations.U.S.Department of Health and Human services Food and Drug
Administration Centre for Drug Evaluation and research (CDER) March
2003 Search PubMed.
|
| This journal is © The Royal Society of Chemistry 2010 |
Click here to see how this site uses Cookies. View our privacy policy here.