DOI:
10.1039/C0AY00005A
(Paper)
Anal. Methods, 2010,
2, 479-483
Electrochemiluminescence of tris(2,2′-bipyridyl)ruthenium(II)/pyruvate system in the absence of cerium(III)†
Received
5th January 2010
, Accepted 9th February 2010
First published on
23rd February 2010
Abstract
It has been reported that electrogenerated chemiluminescence (ECL) of the tris(2,2′-bipyridyl)ruthenium(II) (Ru(bpy)32+)/pyruvate system cannot be observed unless cerium(III) is employed to oxidize pyruvate since it is difficult to oxidize pyruvate either directly on the electrode or by electrogenerated Ru(bpy)33+. In this study, we find that ECL of the Ru(bpy)32+/pyruvate system can be observed in the absence of cerium(III) at gold, platinum, glassy carbon, and carbon paste electrodes by using slow scan rate. The slow scan rate may favor the oxidation of more pyruvate and reduce background signal, and thus leads to generation of ECL of the Ru(bpy)32+/pyruvate system. This finding provides an alternative approach for the determination of pyruvate. Under the optimum conditions, the plots of the ECL versus the concentration of pyruvate is linear in the range of 5.0 × 10⁻⁶ M∼1.0 × 10⁻⁴ M with the detection limit of 5.0 × 10⁻⁶ M. The relative standard deviation is 5.08% for nine consecutive measurements of 5.0 × 10⁻⁵ M pyruvate.
Introduction
A number of pathological states result in increases in the organic acid levels in organisms. The increase in the level of some organic acids can lead to a decrease in blood pH, to acidotic coma and even to death.1 Pyruvate is one kind of organic acid which is a biologically important molecule involved in a variety of biochemical reactions.2 Its determination in physiological media is an important clinical assay for the diagnosis of numerous human disease conditions. For example, raised levels of pyruvate in cerebral spinal fluid are observed in patients with pyruvate dehydrogenase deficiency and other brain abnormalities. It also serves as an aid for diagnosing diabetic acidosis, alcohol polynephritis, hypovitaminosis and can also be used to optimise respiratory monitoring. The measurement of pyruvate concentrations also can provide an indication of bacterial contamination of various media, such as dairy product in the food industry.3
Many methods for the determination of pyruvate have been reported over the past decade years, such as enzyme electrode biosensor,4–14 electrochemical analysis,15–18 UV-Visible spectroscopy,19–21 colorimetric method,22 fluorescence,23–28 chemiluminescence.1,3,29,30 Pyruvate is usually assayed by means of fluorescence or absorbance measurements via one or several enzyme reactions.23,31–36
In 1981, Rubinstein and Bard published a pioneering paper on aqueous Ru(bpy)32+ ECL systems.37 In this paper, they found that Ru(bpy)32+ can electrochemically react with oxalate to emit light, but can not electrochemically react with pyruvate to emit light since it is difficult to oxidize pyruvate either directly on electrode or by electrogenerated Ru(bpy)33+. Upon addition of Ce3+, they achieved ECL of the Ru(bpy)32+/pyruvate system as a result of the electrogeneration of a stronger oxidant Ce4+ from Ce3+. The electrogenerated Ce4+ can oxidize pyruvate to form a strong reducing intermediate CH3CO˙ that react with electrogenerated oxidant Ru(bpy)33+ to produce light (eqn (1)–(8)). Fourteen years later, Andrew W. Knight and Gillian M. Greenway first described the ECL determination of pyruvate using Ru(bpy)32+ in the presence of cerium(III) nitrate.2,38
| | | CH3COCOO− + Ce4+ → CH3COCOO˙ + Ce3+ | (2) |
| | | CH3COCOO˙ → CH3CO˙ + CO2 | (3) |
| | | Ru(bpy)32+–e → Ru(bpy)33+ | (4) |
| | | Ru(bpy)33+ + CH3CO˙ + H2O → Ru(bpy)32+* + CH3COOH + H+ | (5) |
| | | Ru(bpy)32+ + CH3CO˙ + H2O → Ru(bpy)3+ + CH3COOH + H+ | (6) |
| | | Ru(bpy)33+ + Ru(bpy)3+ → Ru(bpy)32+* + Ru(bpy)32+ | (7) |
| | | Ru(bpy)32+* → Ru(bpy)32+ + hν | (8) |
In this paper, the ECL behavior of Ru(bpy)32+/pyruvate system was investigated in the absence of cerium(III) on gold, platinum, glassy carbon, and carbon paste electrodes. We found that Ru(bpy)32+ and pyruvate can produce ECL effectively at slow scan rate. The mechanism for the ECL of Ru(bpy)32+/pyruvate system was proposed, and the application of this ECL system for determination of pyruvate was demonstrated.
Experimental
Reagents
Tris(2,2′-bipyridyl)ruthenium(II) chloride hexahydrate was obtained from Sigma-Aldrich. Sodium pyruvate and graphite powder were purchased from Sinopharm Chemical Reagent Co. Ltd. All other compounds used in the study were of analytical reagent grade and used as received without further purification. The buffer solution was phosphate buffer solution (PBS).
Apparatus
Electrochemical measurements were carried out in a conventional three-electrode cell with a 800B electrochemical workstation. The working electrodes were gold, platinum, glassy carbon, and carbon paste electrodes. The diameters of all working electrodes were 3 mm. An Ag/AgCl reference electrode (saturated KCl) and a platinum wire counter electrode were used for all experiments. The ECL signals (IECL) were measured with a BPCL-1-KIC luminescence analyzer. A voltage of −1100V was supplied to the photomultiplier tube (PMT), unless otherwise stated.
Results and discussion
Electrochemical and ECL behavior of the Ru(bpy)32+/pyruvate system on gold, platinum, glassy carbon, and carbon paste electrodes
Fig. 1 shows the typical cyclic voltammograms of 1.0 mM Ru(bpy)32+ in the absence and presence 1.0 mM pyruvate on gold, platinum, glassy carbon, and carbon paste electrodes. By comparison, the oxidation currents increase significantly in the presence of pyruvate. The oxidation currents contain the oxidation of both pyruvate and Ru(bpy)32+. The inset in Fig. 1 show the corresponding ECL profiles recorded during cyclic voltammogram experiments. The ECL signals are very weak in the absence of pyruvate, and increase dramatically upon the addition of 1.0 mM pyruvate. The ECL signals increase about 18 times, 17 times, 23 times, and 21 times on gold, platinum, glassy carbon, and carbon paste electrodes, respectively.
 |
| | Fig. 1 Cyclic voltammograms of 1.0 mM Ru(bpy)32+ on (A) gold, (B) platinum, (C) glassy carbon, and (D) carbon paste electrodes in 0.1 M pH 1.62 PBS in the (a) absence and (b) presence of 1.0 mM pyruvate at a scan rate of 5 mV s−1. Inset: The corresponding ECL behavior of 1.0 mM Ru(bpy)32+ solution in the (a) absence and (b) presence of 1.0 mM pyruvate. The arrow indicates the initial scan direction. | |
Taking into consideration of the proposed mechanism of the Ru(bpy)32+/pyruvate/Ce(III) system in the previous papers and the new phenomena observed in this study,2,37,38 we suppose that ECL involves the following reactions (eqn (9)–(15)). As the electrode potential is scanned to enough positive potential, Ru(bpy)32+ is oxidized to Ru(bpy)33+ (9). Concurrently, pyruvate is oxidized to CH3COCOO˙ on the working electrode surface (10) and undergoes a chemical reaction generating the strong reducing intermediate CH3CO˙ (11). This strong reducing species then either reduces the Ru(bpy)33+ back to Ru(bpy)32+* (12) or reduces Ru(bpy)32+ to form Ru(bpy)3+ (13) that reacts with Ru(bpy)33+ to generate the excited state Ru(bpy)32+* (14). While the excited state Ru(bpy)32+* falls to the ground state Ru(bpy)32+, light is emitted (15). 2,45
| | | Ru(bpy)32+–e → Ru(bpy)33+ | (9) |
| | | CH3COCOO−–e → CH3COCOO˙ | (10) |
| | | CH3COCOO˙ → CH3CO˙ + CO2 | (11) |
| | | Ru(bpy)33+ + CH3CO˙ + H2O → Ru(bpy)32+* + CH3COOH + H+ | (12) |
| | | Ru(bpy)32+ + CH3CO˙ + H2O → Ru(bpy)3+ + CH3COOH + H+ | (13) |
| | | Ru(bpy)33+ + Ru(bpy)3+ → Ru(bpy)32+* + Ru(bpy)32+ | (14) |
| | | Ru(bpy)32+* → Ru(bpy)32+ + hν | (15) |
Optimum conditions of pyruvate with ECL detection
Variables affecting the ECL intensity of the Ru(bpy)32+/pyruvate system were studied by altering each variable in turn while keeping all others constant.
Effect of pH of PBS
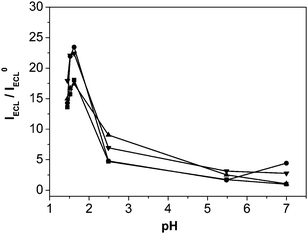
For the determination of the effect of pH value on the ECL intensity ratio of Ru(bpy)32+/pyruvate solution to Ru(bpy)32+ solution different pH values are investigated. Obtained results are shown in Fig. 2. The ECL intensity of the Ru(bpy)32+ luminescence reaction is very dependent on the pH.39–43 The ECL intensity of 1.0 mM Ru(bpy)32+ and 1.0 mM pyruvate solution increases with increasing pH. The ECL intensity of 1.0 mM Ru(bpy)32+ also increases with increasing pH. The rate of increase of the latter is much faster than that of the former. So the ratio of ECL intensity decreased remarkably with increasing pH value. Therefore, pH 1.62 is chosen as the optimum pH value in following experiments.2 Because the ratio of ECL intensity on the glassy carbon electrode is the largest (Fig. 2), the glassy carbon electrode is chosen as the working electrode in the follow experiments.
 |
| | Fig. 2 Influence of pH on the ratio of ECL intensity in 0.1 M PBS containing 1.0 mM Ru(bpy)32+ and 1.0 mM pyruvate solution to that in 0.1 M PBS containing 1.0 mM Ru(bpy)32+ solution (IECL/IECL0) on (■) gold, (▲) platinum, (●) glassy carbon, and (▼) carbon paste electrodes. Other conditions are the same as Fig. 1. Each point as shown in Fig. 2 is a mean of three ECL signals obtained by three successive measurements. | |
Effect of the scan rate
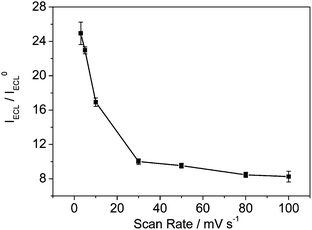
The ECL intensity of pyruvate increases with increasing scan rate; however, the ratio of the ECL intensity of pyruvate to the background ECL intensity increases remarkably with decreasing the scan rate, as shown in Fig. 3. If we continue decreasing the scan rate, the time consumption of experiments will too long. So the lowest scan rate we studied is 3 mV s−1. Fig. S1, ESI† shows the effect of scan rate on cyclic voltammograms of pyruvate. The oxidation current increases with increasing scan rate. Therefore, the increase in the ECL ratio at slower scan rate is probably attributed to the slower oxidation rate of pyruvate than the oxidation rate of water.45 This result indicates that the intensity of ECL depends on the ECL reaction rate of pyruvate and Ru(bpy)32+. Thus, the scan rate of 5 mV s−1 is selected for pyruvate determination considering the experiment time. The ECL signal increases about 23 times.
 |
| | Fig. 3 Influence of the scan rate on the ratio of ECL intensity in 0.1 M pH 1.62 PBS containing 1.0 mM Ru(bpy)32+ and 1.0 mM pyruvate solution to that in 0.1 M pH 1.62 PBS containing 1.0 mM Ru(bpy)32+ solution (IECL/IECL0) on the glassy carbon electrode. Other conditions are the same as Fig. 1. Each point as shown in Fig. 3 is a mean of three ECL signals obtained by three successive measurements. | |
 |
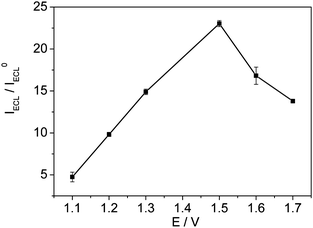
| | Fig. 4 Influence of the applied high end potential on the ratio of ECL intensity in 0.1 M pH 1.62 PBS containing 1.0 mM Ru(bpy)32+ and 1.0 mM pyruvate solution to that in 0.1 M pH 1.62 PBS containing 1.0 mM Ru(bpy)32+ solution (IECL/IECL0) on the glassy carbon electrode. Other conditions are the same as Fig. 1. Each point as shown in Figure 4 is a mean of three ECL signals obtained by three successive measurements. | |
Linear range, limit of detection, and reproducibility
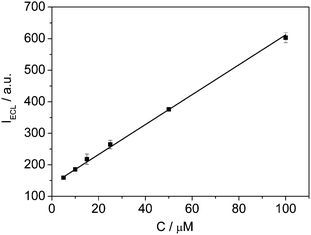
After optimization of the working conditions a good linear relationships of pyruvate is achieved (Fig. 5). The plot of ECL intensity versus the concentration of pyruvate with 1.0 mM Ru(bpy)32+ is linear over a concentration range 5.0 × 10⁻⁶ M∼1.0 × 10⁻⁴ M with correlation coefficient 0.999 (n = 6). The detection limit (S/N = 3) was 5 × 10⁻⁶ M. The 5.0 × 10⁻⁵ M of pyruvate at 1.0 mM level of Ru(bpy)32+ is used as testing samples. Obtained relative standard deviation (n = 9) is 5.08%. From examination results, it can be seen that the accuracy of this method is satisfactory. Compared with the other methods, the proposed method was observed to be more sensitive with a lower detection limit.10,17,23,44
 |
| | Fig. 5 The ECL peak intensity as a function of pyruvate concentration. Other conditions are the same as Fig. 1. The error bars indicate RSDs of three replicate experiments. | |
Conclusions
In previous works, the ECL reaction between Ru(bpy)32+ and pyruvate need the presence of Ce(III) and Pt electrodes. In our study, we found that ECL of Ru(bpy)32+/pyruvate system can be initiated on gold, platinum, glassy carbon, and carbon paste electrodes by using slow scan rate. It seems that the slow scan rate favors the oxidation of more pyruvate because of sluggish oxidation of pyruvate on the electrode surface, and thus leads to generation of ECL of Ru(bpy)32+/pyruvate system. The study may be helpful in search of new ECL systems with relatively slow reaction rate.
Acknowledgements
This project was supported by the National Natural Science Foundation of China (No. 20505016 & 20875086), the Ministry of Science and technology of the People's Republic of China (No. 2006BAE03B08), the Hundred Talents Program of Chinese Academy of Sciences, and the Department of Sciences & Technology of Jilin Province (20070108 and 20082104).
References
- X. Y. Li, L. S. Ling, Z. K. He, G. W. Song, S. F. Lu, L. J. Yuan and Yun'E. Zeng, Microchem. J., 2000, 64, 9–13 CrossRef CAS.
- A. W. Knight and G. M. Greenway, Analyst, 1995, 120, 2543–2547 RSC.
- T. Pérez-Ruiz, C. Martínez-Lozano, V. Tomás and J. Fenoll, Anal. Chim. Acta, 2003, 485, 63–72 CrossRef CAS.
- J. Kulys, L. Z. Wang and N. Daugvilaite, Anal. Chim. Acta, 1992, 265, 15–20 CrossRef CAS.
- F. Mizutani, S. Yabuki, Y. Sato, T. Sawaguchi and S. Iijima, Electrochim. Acta, 2000, 45, 2945–2952 CrossRef CAS.
- L. A. Abayomi, L. A. Terry, S. F. White and P. J. Warner, Biosens. Bioelectron., 2006, 21, 2176–2179 CAS.
- N. Gajovic, G. Binyamin, A. Warsinke, F. W. Scheller and A. Heller, Anal. Chem., 2000, 72, 2963–2968 CrossRef CAS.
- N. Gajovic, K. Habermuller, A. Warsinke, W. Schuhmann and F. W. Scheller, Electroanalysis, 1999, 11, 1377–1383 CrossRef CAS.
- W. Bergmann, R. Rudolph and U. Spohn, Anal. Chim. Acta, 1999, 394, 233–241 CrossRef CAS.
- M. E. Ghica and C. M. A. Brett, Electroanalysis, 2006, 18, 748–756 CrossRef CAS.
- E. Akyilmaz and E. Yorganci, Electrochim. Acta, 2007, 52, 7972–7977 CrossRef CAS.
- L. A. Dang, J. Haccoun, B. Riro and M. C. Pham, Electrochim. Acta, 2006, 51, 3934–3943 CrossRef CAS.
- T. Yao, M. Satomura and T. Nakahara, Electroanalysis, 1995, 7, 395–397 CAS.
- R. Marsh and N. D. Danielson, Analyst, 1995, 120, 1091–1096 RSC.
- J. Kim, T. D. Chung and H. Kim, J. Electroanal. Chem., 2001, 499, 78–84 CrossRef CAS.
- M. Gilis, H. Durliat and M. Comtat, Anal. Chim. Acta, 1997, 355, 235–240 CrossRef CAS.
- M. L. Jin, Q. Dong, R. Dong and W. R. Jin, Electrophoresis, 2001, 22, 2793–2796 CrossRef CAS.
- X. Lu, W. H. Huang, F. Ai, Z. L. Wang and J. K. Cheng, J. Chromatogr., B: Anal. Technol. Biomed. Life Sci., 2007, 857, 347–351 CrossRef CAS.
- G. E. Anthon and D. M. Barrett, J. Sci. Food Agric., 2003, 83, 1210–1213 CrossRef CAS.
- P. Marcos, M. P. Lue-Meru, R. Ricardo, G. Maximo, V. Maribel, B. J. Luis and B. Marcela, Talanta, 2004, 64, 1299–1303 CrossRef CAS.
- A. Horowitz, R. Meller and G. K. Moortgat, J. Photochem. Photobiol., A, 2001, 146, 19–27 CrossRef CAS.
- K. S. Yoo, L. M. Pike and B. K. Hamilton, Hortscinece, 1995, 30, 1306–1306 Search PubMed.
- Y. Y. Zhao, X. F. Gao, Y. S. Li, X. Ju, J. Zhang and J. Zheng, Talanta, 2008, 76, 265–270 CrossRef CAS.
- S. DeMarcos, J. Galban, C. Alonso and J. R. Castillo, Analyst, 1997, 122, 355–359 RSC.
- C. Olsen, Clin. Chim. Acta, 1971, 33, 293–300 CrossRef CAS.
- P. T. Ozand, R. L. Hawkins, R. M. Collins, J. T. Tildon and M. Cornblath, Biochem. Med., 1975, 14, 170–183 CrossRef CAS.
- Q. F. Xue and E. S. Yeung, J. Chromatogr., A, 1994, 661, 287–295 CrossRef CAS.
- U. G. A. Sattlar, S. Walenta and W. Mueller-Klieser, Lab. Invest., 2007, 87, 84–92 Search PubMed.
- F. Q. Wu, S. W. Hu, Y. M. Huang, W. B. Shi, J. Pan, Q. Li, G. F. Tang and C. Z. Huang, Anal. Lett., 2006, 39, 1823–1836 CrossRef.
- M. L. Feng, G. F. Zhang and Z. J. Zhang, Fresenius J. Anal. Chem., 1999, 363, 320–322 CrossRef CAS.
- A. P. Zhu, R. Romero and H. R. Petty, Anal. Biochem., 2010, 396, 146–151 CrossRef CAS.
- B. Lloyd, J. Burrin, P. Smythe and K. G. M. M. Alberti, Clin. Chem., 1978, 24, 1724–1729 CAS.
-
N. Gau, in Methods in Clinical Chemistry, ed. A. Pesce and L. Kaplann, C.V. Mosby Co., St. Louis, MO, 1987, pp. 83–85 Search PubMed.
- K. Koike, Y. Urata and N. Hiraoka, J. Clin. Biochem. Nutr., 1990, 9, 151–161 Search PubMed.
- L. D. Buckberry, S. D. Gallagher and P. N. Shaw, J. Liq. Chromatogr. Relat. Technol., 1993, 16, 3073–3081 CrossRef CAS.
- T. Tsukatani and K. Matsumoto, Talanta, 2006, 69, 637–642 CrossRef CAS.
- I. Rubinstein and A. J. Bard, J. Am. Chem. Soc., 1981, 103, 512–516 CrossRef CAS.
-
W. J. Miao and J. P. Choi, in Electrogenerated Chemiluminescence, ed. A. J. Bard, Marcel Dekker, Inc., USA, 2004, ch. 5, pp. 249–251 Search PubMed.
- H. N. Choi, S. H. Cho and W. Y. Lee, Anal. Chem., 2003, 75, 4250–4256 CrossRef CAS.
- S. Workman and M. M. Richter, Anal. Chem., 2000, 72, 5556–5561 CrossRef CAS.
- Y. B. Zu and A. J. Bard, Anal. Chem., 2001, 73, 3960–3964 CrossRef CAS.
- X. B. Yin, S. J. Dong and E. K. Wang, TrAC, Trends Anal. Chem., 2004, 23, 432–441 CrossRef CAS.
- A. W. Knight and G. M. Greenway, Analyst, 1996, 121, 101R–R106 RSC.
- J. B. Ewaschuk, J. M. Naylor, W. A. Barabash and G. A. Zello, J. Chromatogr., B: Anal. Technol. Biomed. Life Sci., 2004, 805, 347–351 CrossRef CAS.
-
L. Eberson and K. Nyberg, in Encyclopedia of electrochemistry of the elements, ed. A. J. Bard, Marcel Dekker, Inc., USA, 1978, Vol. XII. Pp. 261–329 Search PubMed.
|
| This journal is © The Royal Society of Chemistry 2010 |
Click here to see how this site uses Cookies. View our privacy policy here. 


