Determination of Estriol 16-glucuronide in human urine with surface plasmon resonance and lateral flow immunoassays
Xiuqian
Jiang
ab,
Mark
Waterland
ab,
Len
Blackwell
b and
Ashton
Partridge
*ab
aMacDiamid Institute for Advanced Materials and Nanotechnology, Private Bag, 11222, Palmerston North, New Zealand. E-mail: A.Partridge@massey.ac.nz; Fax: +64-6-350-5682; Tel: +64-6-350-5918
bInstitute of Fundamental Science, Massey University, Private Bag, 11222, Palmerston North, New Zealand
First published on 8th February 2010
Abstract
A rapid quantitative immunoassay for estriol-16-glucuronide by Surface Plasmon Resonance (SPR) sensing has been developed and applied to urine samples from non-pregnant and pregnant subjects. The assay was based on a partially-purified polyclonal antibody (pAb) raised in sheep, which showed negligible cross-reactivity with estrone-3-glucuronide and estriol-17-glucuronide. Colloidal gold coated by the pAb was used as the signal generator in the SPR-based inhibition immunoassay. An estriol-16-glucuronide-ovalbumin conjugate with an oligoethylene glycol (OEG) as linker was used to immobilize the steroid on the biosensor chip surface. The SPR assay had a limit of detection of 0.016 ng/mL, and could be performed rapidly giving results in two minutes. The assay can be carried out directly on any urine samples without complicated sample pretreatment. A one-step lateral flow strip test was also developed using the same pAb nanogold conjugates and bovine serum albumin estriol-16-glucuronide conjugates as the capture agent spotted onto a nitrocellulose membrane as the test line. A sensitive and repeatable lateral flow assay was achieved with a limit of detection of 0.49 ng/mL in time-diluted urine using a low coating concentration of the polyclonal antibody. Despite the strip sensor displaying adequate sensitivity in a standard curve generated by exposure to estriol-16-glucuronide in a spiked urine blank, the application of the strip sensors to real urine samples was not so successful due to matrix effects.
Introduction
Surface plasmon resonance (SPR) sensing is a highly sensitive label-free analytical technique, in which the sensor response is based on changes in refractive index that occur at the sensor surface upon binding of the target analyte. The high sensitivity, speed of response and the requirement for minimal sample highlights the applicability of SPR for immunoassays. Lateral flow immunoassays (LFIA) are cost-effective, relatively easy to perform and provide a more user-friendly analysis than most laboratory based assays. They can be stored for long periods without refrigeration, making them suitable alternatives for use in off-laboratory or resource-poor settings. Moreover, compared to SPR biosensor-based assays they can be rapidly brought to market with a relatively small investment.Estriol-16-glucuronide (E3-16G) is a steroid derived from ovarian estradiol by hepatic hydroxylation and conjugation and has been proposed as an alternative urinary metabolite to estrone glucuronide for the monitoring of ovarian function.1 Metabolism of estradiol produces three estriol glucuronides, one conjugated at position 3, one at position 17 and one at position 16. Of the three, E3-16G is the preferred metabolite for monitoring fertility, since it is excreted rapidly whereas the estriol-3-glucuronide undergoes a complex entero-hepatic re-circulation before excretion and hence is delayed with respect to E3-16G.2 E3-16G is also produced by the feto-placental unit during pregnancy and is the predominant estrogen in the urine of pregnant women increasing in parallel with the healthy growth of the foetus.3 It has also been associated with breast cancer.4 Much work has been done on development of assays for the measurement of estriols in the urine of pregnant women,5 but there are few direct assays with the sensitivity to measure E3-16G levels in the urine of non-pregnant women. Detection methods for E3-16G have traditionally been based on radioimmunoassay (RIA),6,7 high pressure liquid chromatography (HPLC),8 and liquid chromatography (LC) coupled with fluorescence measurement,9 mass spectrometry (MS) or UV spectrophotometry.10,11 However, these analytical methods require many clean-up steps, are time-consuming and may be expensive.
An accurate nanoparticle-enhanced SPR biosensor-based assay suitable for measurement of E3-16G in liquid samples has been described and validated in a previous study with a sensitivity close to 0.1 nmol/24 h (14 pg/mL).12 Baker (1979) showed that the mean value of the mid cycle peak of E3-16G excretion using a direct radioimmunoassay method was approximately 75 nmol/24 h.13 Therefore, the sensitivity of the SPR assay is more than sufficient to measure the low levels of E3-16G encountered in urine samples during the human menstrual cycle. A direct assay such as the SPR assay and LFIA is simpler and cheaper to perform than methods which need extraction or derivation but it introduces the possibility of matrix effects. All immunoassays are subject to matrix effects which can interfere with antibody binding reactions and hence give rise to false values. Measurement of a physiological marker such as E3-16G, which is present in low levels in a bodily fluid such as urine, makes the acquisition of a blank sample very difficult to obtain since there is always some analyte present, even in a child's urine.14 However, the sensitivity of the enhanced SPR assay is sufficient to allow for dilution of the urine samples and hence minimization of matrix effects.15
Despite widespread use, a LFIA for E3-16G suitable for use with urinary samples obtained during the normal menstrual cycle has not been reported. The aim of this work is to apply the SPR assay to detect low levels of E3-16G in clinical samples for use as a reference assay. This paper describes the validation and application of a SPR assay and attempts to develop a LFIA, with the use of a common colloidal gold-labeled anti-E3-16G pAb reagent, for the determination of E3-16G in human female urine.
Experimental
Chemicals and instruments
Polyvinylpyrrolidone (PVP), ovalbumin (OVA), bovine serum albumin (BSA), estriol 3-(β-D-glucuronide), estriol-17-(β-D-glucuronide) sodium salt (E3-17G) and rabbit anti-sheep IgG (whole molecule) were all purchased from Sigma-Aldrich (St. Louis, MO, USA). Tween 20 and di-sodium hydrogen orthophosphate were obtained from BDH Laboratory Supplies (Poole, England) and sodium azide was from Serva Electrophoresis (Heidelberg, Germany), Hi-Flow plus 75 membrane cards (60 mm × 301 mm) and cellulose fiber sample pads (17 mm × 300 mm) were from Millipore (Massachusetts, USA). U-bottom microtiter 96 well plates were from Greiner Bio-One GmbH (Frickenhasen, Germany). The E3-16G-BSA conjugates, estrone-3-glucuronide (E1-3G) were obtained from Science Haven Limited (Palmerston North, New Zealand). The E3-16G-OEG-OVA conjugates were from Hort Research (Hamilton, New Zealand).A BIAcore X-100 system (GE Healthcare Uppsala, Sweden) was used to monitor the real-time binding performance of polyclonal anti-E3-16G antibodies and gold conjugates of a polyclonal anti-E3-16G antibodies to an E3-16G-OEG-OVA coated surface. Reagents for SPR work, including the CM5 chip, amine coupling kit (0.1 M NHS, 0.4 M EDC and 1 M ethanolamine) and HBS-EP running buffer (0.01 M HEPES pH = 7.4, 0.15 M NaCl, 3 mM EDTA and 0.005% surfactant P20) were purchased from GE healthcare (Uppsala, Sweden). An IsoFlow™ Reagent Dispenser (Imagenetechnology, Hanover, USA) was used to dispense control and test lines on a nitrocellulose membrane. The strips were cut with an M-70 cutter (advanced Sensor System Ltd, Ambala, India). An HP scanjet 3500c photo scanner and dedicated software were used to obtain images of the strips.
Software
The intensity of the control and test lines on the strips was quantified with a strip reader system (version 2.00, Simon Brown2 Ltd, Launceston, Tasmania, Australia). For statistical analysis, all assay standard curves were fitted to a four-parameter logistic equation using Graph Pad Prism 5 (La Jolla, CA, USA). All IC50 values (defined as the concentration that gives half-maximal effect) were presented as a parameter from the curve fitting. The sensitivities of the assays were given by the Limit of Detection (LOD), defined as the lowest concentration that can be distinguished from background noise,16 were computed with OriginPro 7.0 (OriginLab, Northampton, MA, USA).Urinary samples
Urine collected from a young girl (aged 2 years and 11 months) was used as a blank standard with low concentrations of endogenous steroids (“blank” urine) for assessing and correcting the urinary matrix effects. All human urine samples (pregnancy or non-pregnancy) were collected from healthy female volunteers. The urine samples were collected overnight or at any convenient time during a day as discussed by Cooke et al.,15 but the collection period was intervals of a minimum of 3 h. Depending on the duration of the collection period and the volume of urine passed over this period, all urine samples were time-diluted to the equivalent of 3.6 L/24 h using Milli.Q water and stored in a freezer (−20 °C).15Gold-anti-E3-16G-polyclonal Antibody conjugates
The strategy used for synthesis of the antibody-gold conjugates has been described in a previous paper.12 In the current work, two sets of pAb gold conjugates were prepared in triplicate containing two different concentrations of semi-purified pAb (187 μg/mL for set A: used for both SPR biosensor work and the lateral flow test, and 73 μg/mL for set B: used only for the lateral flow test).SPR immunoassay
The procedure for carrying out the SPR immunoassay including the methodology for activating the chip surface and immobilising E3-16G-OEG-OVA onto the chip surface have been described in a previous publication.12![[thin space (1/6-em)]](https://www.rsc.org/images/entities/char_2009.gif) :5 dilution of 10 mM TM buffer, pH = 7.10), E3-17G or E1-3G standards, and pAb (15 μg/mL) according to a volume ratio of 1:1:1 and incubating for 5 min at room temperature. Then the samples (15 μl) were injected for 90 s. The surface was regenerated using a mixture of 100 mM NaOH and 10% acetonitrile in Milli.Q water (5 μl for 30 s). Each sample was performed in triplicate and the calculations of the IC50 values were performed using Graph Pad Prism.
:5, 1:10, and 1:30) of TM buffer (10 mM) or time-diluted blank urine were pre-incubated with an equivalent volume of a zero standard (HBS-EP buffer) and Au-pAb conjugates (1:100 dilution in HBS-EP buffer) at room temperature and the SPR response measured (20 μl/120 s at a flow rate of 10 μl/min) in triplicate. The chip surface was regenerated using NaOH (100 mM) and 20% acetonitrile in Milli.Q water (10 μl for 60 s).
:30 dilution of each spiked urine specimen was incubated with an equivalent volume of a 1:30 diluted TM buffer (10 mM) and a 1:100 dilution of Au-pAb conjugates for which the nominal pAb concentration was 1.87 μg/mL (187 μg/mL was divided by the dilution factor of 100). The SPR response for the mixture (20 μl for 120 s) was tested in triplicate at a flow rate of 10 μl/min. Between exposures the biosensor surface was regenerated with NaOH of 100 mM and 20% acetonitrile in Milli.Q water (10 μl for 60 s).
:30 from volunteer A or further diluted as shown in Table 1 from volunteer B), a 1:30 dilution of 10 mM TM buffer and a 1:100 dilution of the gold conjugates (CpAb = 1.87 μg/mL) flowed through the chip in 120 s at a flow rate of 10 μl/min. The chip surface was cleaned with 100 mM NaOH and 20% acetonitrile in Milli.Q water (10 μl for 60 s).
:5 dilution of 10 mM TM buffer, pH = 7.10), E3-17G or E1-3G standards, and pAb (15 μg/mL) according to a volume ratio of 1:1:1 and incubating for 5 min at room temperature. Then the samples (15 μl) were injected for 90 s. The surface was regenerated using a mixture of 100 mM NaOH and 10% acetonitrile in Milli.Q water (5 μl for 30 s). Each sample was performed in triplicate and the calculations of the IC50 values were performed using Graph Pad Prism.
:5, 1:10, and 1:30) of TM buffer (10 mM) or time-diluted blank urine were pre-incubated with an equivalent volume of a zero standard (HBS-EP buffer) and Au-pAb conjugates (1:100 dilution in HBS-EP buffer) at room temperature and the SPR response measured (20 μl/120 s at a flow rate of 10 μl/min) in triplicate. The chip surface was regenerated using NaOH (100 mM) and 20% acetonitrile in Milli.Q water (10 μl for 60 s).
:30 dilution of each spiked urine specimen was incubated with an equivalent volume of a 1:30 diluted TM buffer (10 mM) and a 1:100 dilution of Au-pAb conjugates for which the nominal pAb concentration was 1.87 μg/mL (187 μg/mL was divided by the dilution factor of 100). The SPR response for the mixture (20 μl for 120 s) was tested in triplicate at a flow rate of 10 μl/min. Between exposures the biosensor surface was regenerated with NaOH of 100 mM and 20% acetonitrile in Milli.Q water (10 μl for 60 s).
:30 from volunteer A or further diluted as shown in Table 1 from volunteer B), a 1:30 dilution of 10 mM TM buffer and a 1:100 dilution of the gold conjugates (CpAb = 1.87 μg/mL) flowed through the chip in 120 s at a flow rate of 10 μl/min. The chip surface was cleaned with 100 mM NaOH and 20% acetonitrile in Milli.Q water (10 μl for 60 s).
| Time-diluted sample | DF in SPR format |
|---|---|
| Week 4 | 1:300 |
| Week 6 | 1:60 |
| Week 8 | 1:300 |
| Week 10 | 1:1500 |
| Week 12 | 1:4000 |
| Week 14 | 1:12000 |
| Week 18 | 1:12000 |
| Week 24 | 1:25000 |
Colloidal gold-based lateral flow immunoassay
Unit conversion
In the lateral flow experiments, the unit used to describe concentration of time-diluted urinary samples is nmol/24 h which includes information of time, volume, and concentration. A common unit used in SPR experiments is g/L. The unit of nmol/24 h is converted to g/L by converting it firstly to nM by dividing by 3.6 L/24 h, and then multiplying by the molecular weight of E3-16G (464.15 g/mol), namely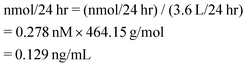
Results and discussion
In developing any biological assay one must first consider the matrix effects on the response, and in examples like E3-16G, the extent of the cross-reactivity of other estradiol metabolites for the antibody (pAb).SPR immunoassays
The metabolites, such as E1-3G, E3-3G and E3-17G, could potentially interfere with the determination of E3-16G levels since all of them have similar chemical structures related to E3-16G. Table 2 shows the responses of the E1-3G and E3-17G estradiol metabolites for the polyclonal E3-16G antibody, compared to that for E3-16G. The low cross-reactivity values confirmed that neither E1-3G nor E3-17G would interfere to any significant extent with E3-16G binding. Unfortunately, E3-3G was not available for testing, and introduces some uncertainty into the assay results since E3-3G is produced in approximately twice the concentration of E3-16G throughout the menstrual cycle. However, given the extremely low cross reactivity for E1-3G, and the structural similarity between the E3-3G and E1-3G metabolites, it seems unlikely that E3-3G would significantly interfere in the assay.| Compounds | IC50 (ng/mL) | Cross-reactivity (%) |
|---|---|---|
| E3-16G | 0.93 12 | 100 |
| E3-17G | 5.15E4 | 1.80E-2 |
| E1-3G | 1.75E9 | 5.30E-8 |
In order to enhance the sensitivity of the SPR assay for E3-16G, Au nanoparticle-pAb conjugate (Au-pAb) was used according to the method of Jiang et al.12 The matrix effect of the urine samples was established in the SPR by measuring the binding response of E3-16G in different dilutions of time-diluted blank urine (Table 3) compared with buffer controls. The results for the 1:5 dilution showed a decrease in binding of approximately 50% when compared to the control, and indicated the extent of interference by the matrix. Further dilution to 1:10 and 1:30 showed the lowering of the matrix effects down to 36.9% and 4.2%, respectively. Subsequent assays were carried out using a dilution factor of at least 1:30.
| Samples | Response of samples (RU) | ||
|---|---|---|---|
| 1:5 dilution |
1:10 dilution |
1:30 dilution |
|
| Control | 115.2 ± 4.4 | 129.1 ± 2.7 | 144.3 ± 3.0 |
| Urine sample | 57.7 ± 2.8 | 81.5 ± 0.4 | 138.3 ± 0.5 |
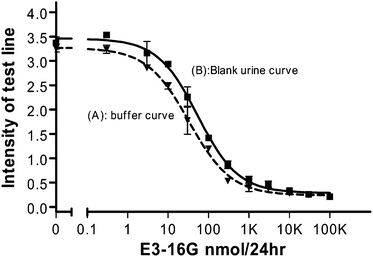
A reference calibration curve (standard curve, Fig. 1) was generated using the Au-pAb conjugates (1:100 dilution), time-diluted blank urine (1:30 dilution) and a series of E3-16G standards prepared in HEP-BS buffer. The sensitivity (LOD) of the curve was 16 pg/mL and the IC50 value was 49 pg/mL. These were similar to the values reported previously for the buffer-only standard curve (LOD of 14 pg/mL)12 and the intra-assay coefficient of variation (CV) was ≤ 3.8%. Thus, there was no discernible matrix effect in the presence of the diluted blank urine standard.
 | ||
| Fig. 1 Normalized SPR reference calibration curves performed in the presence of the time-diluted blank urine (■) and TM buffer (▼). All values are mean ± SD from triplicate measurements of each sample. | ||
To determine the accuracy of the assay, E3-16G standards of 1.29, 3.87, and 6.45 ng/mL (10, 30, and 50 nmol/24 h) spiked in blank urine were diluted 1:30 with HBS-EP buffer, and the recoveries were measured in triplicate based on the reference curve (Fig. 1). The recoveries ranged from 92% to 108% with the highest CV being 0.71% (Table 4). The acceptable recovery of the standard samples spiked in blank urine indicated the high level of repeatability and accuracy of the SPR assay.
| Spiked E3-16G (ng/mL or nmol/24 h) | SPR | Lateral flow test | ||||
|---|---|---|---|---|---|---|
| Mean ± SD (ng/mL) | Recovery (%) | Intra-assay CV (%) | Mean ± SD (nmol/24 h) | Recovery (%) | Intra-assay CV (%) | |
| 1.29 ng/mL (10 nmol/24 h) | 1.191 ± 0.008 | 92 | 0.71 | 12.04 ± 1.91 | 120 | 15.88 |
| 3.87 ng/mL (30 nmol/24 h) | 4.172 ± 0.014 | 108 | 0.34 | 29.23 ± 3.33 | 97 | 11.40 |
| 6.45 ng/mL (50 nmol/24 h) | 6.960 ± 0.039 | 108 | 0.56 | 49.16 ± 3.14 | 98 | 6.39 |
Lateral flow immunoassays
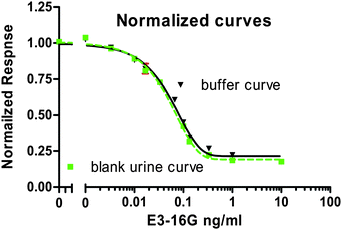
The LFIA format has similarities with that of the SPR assay. Both systems utilise a hapten conjugate immobilized onto a surface, and the signal is generated upon binding of the appropriate antibody. In both assays, nanoparticles attached to the antibody have been used for both visualization and signal enhancement. In this current study, the SPR assay served as a reference platform for the development and validation of the attachment chemistry for application to the LFIA. The immobilized hapten conjugate comprised of three distinct areas: the E3-16G hapten, a linker moiety and a surface binding protein. In the SPR assay, the linker-surface binding protein combination was OEG-OVA. The OEG acted as a spacer to allow the hapten to bind the antibody and lower the non-specific binding onto the chip surface.17,18 In the LFIA, BSA was used as the surface binding protein for attachment of the hapten onto the nitrocellulose membrane as the test line.Fig. 2 shows two standard curves performed with spiked E3-16G standards in 10 mM TM buffer (pH = 7.10) and blank urine (pH = 6.77). Both curves were plotted with the mean ± SD for duplicate measurements. Surprisingly, the presence of the blank urine led to a higher intensity on the test strips. For the buffer curve, the working range was from 5.2 nmol/24 h to 153.7 nmol/24 h (R2 = 0.99) with an IC50 value of 33.10 nmol/24 h. For the urine curve, the working range was between 11.1 nmol/24 h and 266.81 nmol/24 h (R2 = 0.99) with an IC50 of 54.22 nmol/24 h. The intra-assay CVs were lower than 15% for the buffer curve, and 13.7% for the blank urine curve. To investigate the observed results, a series of experiments were carried out over a range of pH values indicated that the higher intensity of the blank urine samples was independent of the pH.
 | ||
| Fig. 2 Buffer (▼) and urine blank (■) standard curves obtained from test strips, calibrated with duplicate measurements. Error bars represent the SD of the measurements. | ||
To evaluate the reproducibility of the test strips and reliability of the synthesis of the Au-pAb conjugates, two sets of conjugates were prepared in triplicate and deposited with different concentration of pAb (Set A (CpAb = 187 μg/mL) and Set B (CpAb = 73 μg/mL)). Standard curves were generated for each set and the LOD, IC50 and the inter-assay CVs were determined as shown in Table 5. For the conjugates of set A, the highest intra-assay CV (not shown) was 9.6%, the inter-assay CV of the LOD (40.7 ± 2.8 nmol/24 h) and IC50 (119.7 ± 3.2 nmol/24 h) were 2.7% and 6.9%, respectively. For the tests carried out with the conjugates of set B, the intra-assay CV was in the range of 0.18% to 11.9% (not shown), the inter-assay CV of the LOD (3.8 ± 1.3 nmol/24 h) and IC50 (26.1 ± 2.4 nmol/24 h) were 9.00% and 34.89%. The results demonstrated the high stability and reproducibility of the LFIA format using the Au-pAb conjugates as signal generators. The lower LOD and IC50 for set B showed that the assay sensitivity was improved by applying a lower concentration of the pAb coating. Thus subsequent LFIA analysis of the urine samples used the lower concentration of pAb in the conjugates.
| Conjugates | Set A (CpAb = 187 μg/mL) | Set B (CpAb = 73 μg/mL) | ||||||
|---|---|---|---|---|---|---|---|---|
| Conj A1 | Conj A2 | Conj A3 | Inter-CV | Conj B1 | Conj B2 | Conj B3 | Inter-CV | |
| IC50 (nmol/24 h) | 121.9 | 121.1 | 116.0 | 2.67% | 24.37 | 25.12 | 28.78 | 9.04% |
| LOD (nmol/24 h) | 43.44 | 37.87 | 40.83 | 6.85% | 2.55 | 3.69 | 5.20 | 34.86% |
The accuracy of the strip assay was determined by measuring the recoveries of the same three control samples (10, 30, and 50 nmol/24 h E3-16G spiked in blank urine). The recoveries ranged from 97% to 120% (Table 4). The higher recovery (120%) and variance (16%) values for the 10 nmol/24 h control was thought to correspond to the absorption value being close to the lower end of the straight-line portion of the calibration curve.
Determination of E3-16G in urinary samples
In order to validate the use of both the SPR and LFIA assays with clinical samples, urinary samples were collected and measured from volunteers A (non-pregnant woman) and B (pregnant woman). Volunteer A contributed daily urine samples for a complete menstrual cycle. The E3-16G excretion rates were determined each day using both SPR and LFIA (Fig. 3A). For comparison, Fig. 3B depicts the corresponding excretion rates of pregnanediol glucuronide (PdG), determined with the Ovarian Monitor as described by Cooke et al.15 against that of E3-16G obtained via the SPR. The PdG curve was used to help us confirm the ovulate day from the E3-16G profile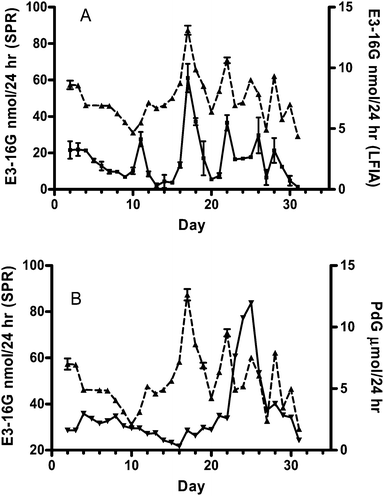 | ||
| Fig. 3 A) E3-16G concentration obtained using the SPR biosensor (▲, left Y axis) and LFIA strips (■, right Y axis). The mean intra-assay CV of strip pattern was 11.7 ± 8.8%. All values are mean ± SD from triplicate measurements of each sample. B) Excretion pattern of PdG (▼, right Y axis) compared with E3-16G concentration values obtained from the SPR biosensor (▲, left Y axis). | ||
The measured range of E3-16G excretion rates (from 27 nmol/24 h (day 5) to 90 nmol/24 h (day 17)) shown by the SPR assay was consistent with the results reported by Baker et al.13 However the excretion rates determined using the test strips were much lower than anticipated, being in the range of 0.2 nmol/24 h to 9.2 nmol/24 h. This was presumed to be due to the matrix effects of the adult urine sample. Although the absolute values of E3-16G obtained using the two techniques were in a different range, the profiles were remarkably similar. Both patterns showed that the E3-16G excretion rate reached a maximum (around 90 nmol/24 h in SPR pattern and 10 nmol/24 h in LFIA pattern) on day 17. Moreover, several common smaller peaks occurred after the main peak. The rise in E3-16G excretion rate on day 12 that led to the pre-ovulatory peak on day 17 identified the beginning of the fertile window.13 The PdG excretion rate exceeded the threshold value of 7 μmol/24 h identifying the end of the fertile window on day 23 giving a fertile period of 11 days.19 This threshold also confirms that the E3-16G peak on day 17 is the ovulatory estrogen peak. The smaller post-ovulatory peaks are consistent with the fact that the excretion levels of E3-16G in the luteal phase are usually lower than that in the follicular phase.13 The decline in E3-16G levels for the first 3 days is consistent with the observation that in some cycles the levels are still declining after bleeding commences as a continuation of the previous luteal phase.13 The luteal phase length defined as the number of days from the mid-cycle estrogen peak to the day before the next bleed was 14 days, and is in agreement with the fact that the mean luteal phase length in normal menstrual cycles is 14 ± 2 days.20 The likely day of ovulation is the day after the E3-16G peak, thus the direct assay for E3-16G identifies the key cycle parameters equally as well as measurements of E1-3G.21
The excretion rates for a second menstrual cycle (not shown in Fig. 3) were also measured with the strip assay and gave a maximum excretion rate on the peak day of 11 nmol/24 h. The excretion rates obtained with the strip assay were mainly out of the linear regression range (4.2 to 198.2 nmol/24 h) of the calibration curve, and therefore the intra-assay CV was high. The comparison of the SPR and strip results reveal that the matrix effect of the adult urine sample is different from that in the “blank” child's urine, and highlights the difficulties associated with acquiring a truly blank adult urine sample. The question of why the matrix effects were more predominant in the strip assay resulted from the high sensitivity of the SPR assay giving a reliable response at a greater dilution factor. As a consequence, the matrix effect of the adult urine in LFIA format was not removed.
Besides the application of the direct E3-16G assay to urinary samples from a normal menstrual cycle, eight weekly urine samples from the first two trimesters of a pregnant woman (volunteer B) were tested using the SPR biosensor. The daily production of E3-16G before delivery is some 2000 fold greater than normal cycle luteal-phase excretion.13 Thus the analyte concentration of urine samples from pregnant women vastly exceeds the working range of the calibration curve shown in Fig. 1 (0.12 to 1.13 nmol/24 h). The determination of E3-16G in these samples necessitated pre-dilution (see Table 1) and Fig. 4 shows the patterns of E3-16G excretion throughout the first and second trimester of the pregnancy. The insert in Fig. 4 displays the patterns for weeks 4 to week 12, since the output of E3-16G in the first trimester was much lower than that in the second trimester and hence a separate scale is necessary for these data. The data clearly show how the output of E3-16G rises steadily from near the end of the first trimester (week 8) to almost doubling every 2 weeks.
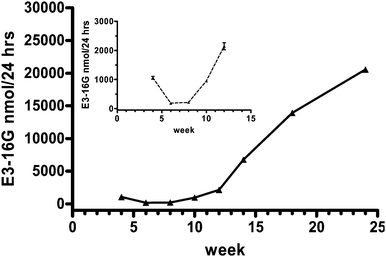 | ||
| Fig. 4 Excretion of E3-16G during the first and second trimester determined using the SPR biosensor (▲). All values are mean ± SD from triplicate measurements of each sample. The intra-assay CV of 3 measurements was lower than 4.9%. | ||
The present work demonstrates that the SPR biosensor-based assay can be applied to the measurement of E3-16G in urine, to give a rapid, precise and accurate analytical tool that requires minimal sample preparation. It has the potential to be used as a reference assay for E3-16G, however, a larger sample set of menstrual cycles would need to be analysed for complete validation of the system. No estriol assay for the menstrual cycle levels of E3-16G is available for a comparison of the present results with a reference assay.
Conclusions
Two colloidal gold-based immunoassays (SPR and LFIA) were developed and optimized for the rapid detection of E3-16G in adult female urinary samples. The SPR-based enhanced inhibition immunoassay allowed for the highly sensitive detection of E3-16G in human female urine without the need for prior clean-up and minimal sample preparation. The reported concentrations of E3-16G during a menstrual cycle agreed with those previously reported.13 Currently, the SPR method appears to be one of the few efficient ways to accurately analyse the E3-16G production rates in urinary samples of a normal menstrual cycle. In addition, although only samples of the first two trimesters were measured, the rapidly increasing levels of E3-16G in pregnancy urine were observed starting from the end of the first trimester. The matrix effect of urine in the SPR-based assay was reduced to insignificant levels with increasing pre-dilution of the urinary samples. For the LFIA format, a LOD of 3.8 ± 1.3 nmol/24 h in time diluted urine was obtained, which has not been reported before in this format. However, the unavoidable matrix effect of the adult female urine samples masked the response to E3-16G, and precluded its application to monitoring menstrual cycle levels of E3-16G. The high sensitivity, accuracy and the low degree of sample preparation in the SPR assay highlighted its advantages over the more traditional techniques, with the levels measured being relevant to environmental monitoring and the monitoring of steroidal metabolites in veterinary science.Acknowledgements
The authors wish to acknowledge the financial support from the MacDiarmid Institute for Advanced Materials and Nanotechnology.References
- S. Z. Cekan, M. S. Beksac, E. Wang, S. Shi, B. Masironi, B. M. Landgren and E. Diczfalusy, Contraception, 1986, 33, 327–345 CrossRef CAS.
- U. Goebelsm., I. Cooke, N. Wiqvist and E. Diczfalu., Acta Endocrinol., 1966, 52, 30 Search PubMed.
- S. Y. Kim, S. K. Kim, J. S. Lee, I. K. Kim and K. Lee, Yonsei Medical Journal, 2000, 41, 226–229 Search PubMed.
- P. E. Lonning and P. Skulstad, Journal of Steroid Biochemistry and Molecular Biology, 1989, 33, 565–571 Search PubMed.
- J. B. Brown and N. A. Beischer, Obstet Gynecol Surv, 1972, 27, 205–235 CAS.
- R. V. Haning, K. P. Satin, M. T. Lynskey, R. M. Levin and L. Speroff, American Journal of Obstetrics and Gynecology, 1977, 128, 793–802 Search PubMed.
- F. Z. Stanczyk, I. Miyakawa and J. R. Soares, Journal of Steroid Biochemistry and Molecular Biology, 1979, 10, 443–448 Search PubMed.
- M. Farre, M. Kuster, R. Brix, F. Rubio, M. J. L. de Alda and D. Barcelo, J. Chromatogr., A, 2007, 1160, 166–175 CrossRef CAS.
- G. G. Ying, R. S. Kookana and Z. L. Chen, Journal of Environmental Science and Health Part B-Pesticides Food Contaminants and Agricultural Wastes, 2002, 37, 225–234 Search PubMed.
- S. Rodriguez-Mozaz, M. J. L. de Alda and D. Barcelo, Anal. Chem., 2004, 76, 6998–7006 CrossRef CAS.
- M. Schoneshofer, T. K. Dhar and D. Ioanides, Clinical Chemistry, 1986, 32, 1948–1950 Search PubMed.
- X. Q. Jiang, M. Waterland, L. Blackwell, Y. Wu, K. P. Jayasundera and A. Partridge, Steroids, 2009, 74, 819–824 CAS.
- T. S. Baker, K. M. Jennison and A. E. Kellie, Biochemical Journal, 1979, 177, 729–738 CAS.
- J. B. Brown, P. Harrisson and M. A. Smith, J Biosoc Sci Suppl, 1978, 43–62 Search PubMed.
- D. G. Cooke, J. E. Binnie and L. F. Blackwell, Steroids, 2007, 72, 580–591 CrossRef CAS.
- M. F. Reis, P. Aniceto, P. Aguiar, F. Simao and S. Segurado, Int. J. Hyg. Environ. Health, 2007, 210, 419–427 CrossRef CAS.
- Y. Q. Wu, J. Mitchell, C. Cook and L. Main, Steroids, 2002, 67, 565–572 CrossRef CAS.
- J. Yuan, R. Oliver, J. Li, J. Lee, M. Aguilar and Y. Wu, Biosens. Bioelectron., 2007, 23, 144–148 CrossRef CAS.
- L. F. Blackwell, J. B. Brown and D. Cooke, Steroids, 1998, 63, 5–13 CrossRef CAS.
- R. J. Fehring and M. Schneider, Fertil. Steril., 2008, 90, 1232–1235 CrossRef CAS.
- L. F. Blackwell, J. B. Brown, P. Vigil, B. Gross, S. Sufi and C. d'Arcangues, Steroids, 2003, 68, 465–476 CrossRef CAS.
| This journal is © The Royal Society of Chemistry 2010 |