Importance of mobile phase and injection solvent selection during rapid method development and sample analysis in drug discovery bioanalysis illustrated using convenient multiplexed LC-MS/MS
Jian
Wang
*,
Anne-Francoise
Aubry
,
Georgia
Cornelius
,
Christian
Caporuscio
,
Bogdan
Sleczka
,
Asoka
Ranasinghe
,
David
Wang-Iverson
,
Timothy
Olah
and
Mohammed
Jemal
*
Bristol-Myers Squibb, Research and Development, Bioanalytical and Discovery Analytical Sciences, Route 206 and Province Line Road, Princeton, NJ 08543, USA. E-mail: jian.wang@bms.com; Fax: +1-609-252-6171; Tel: +1-609-252-3856; mohammed.jemal@bms.com; Fax: +1-609-252-3315; Tel: +1-609-252-3572
First published on 5th February 2010
Abstract
Multiplexed LC-MS/MS was first introduced into the bioanalytical laboratory to increase sample throughput at relatively low cost as multiple LC systems are connected to a single mass spectrometer through a series of switching valves. Traditionally used for staggered parallel analysis, they can also serve as flexible systems for performing independent analyses on each of their channels during method development or sample analysis. Herein, the importance of mobile phase and injection solvent selection for rapid method development and sample analysis in drug discovery bioanalysis, facilitated by the use of a multiplexed LC-MS/MS, is demonstrated. The methods thus developed were then conveniently used on the same multiplexed LC-MS/MS unit. In the first example, methods developed for analytes from two different pre-clinical programs, and each applied to a different set of pharmacokinetic (PK) samples, were carried out together on the same multiplexed system unit using separate chromatographic conditions optimized for each study. The second example presents a multi-component analysis of plasma samples from a single PK study, using separate chromatographic conditions optimized for each analyte. Through these examples, our goal was to demonstrate the broad range of applications and advantages of a multiplexed system in the discovery bioanalytical laboratory.
1. Introduction
In drug discovery bioanalysis, it is important to conduct rapid fit-for-purpose chromatographic optimization in order to achieve proper analyte retention, symmetrical peak shape, adequate LC-MS/MS response, and sufficient chromatographic separation for samples containing multiple analytes. Such samples, plasma or other biological fluids, may contain a parent drug and its metabolites, a pro-drug and its parent drug, and a drug and a co-administered drug. Using LC mobile phases with different pHs and modifiers on the same chromatographic column is a quick way of conducting fit-for-purpose chromatographic optimization. Protocols have been described for automated comprehensive mobile phase and column selections for chromatographic optimization in development bioanalytical settings.1,2 However, conducting rapid LC mobile phase selection routinely and then quickly applying the method to subsequent sample analyses is a challenge in drug discovery bioanalysis, where a variety of compounds from multiple studies and different programs are routinely analyzed in a daily workload.In the work presented herein, the importance of selecting the mobile phase and injection solvent in achieving optimized chromatographic conditions using the same analytical column is illustrated. This is conveniently accomplished using a multiplexed LC-MS/MS system, consisting of four HPLC units and a single mass spectrometer.3–13 The same system is then conveniently used for the simultaneous analysis of samples from different studies using separate chromatographic conditions optimized for each pharmacokinetic (PK) study, and for conducting multi-component analyses from a single PK study using separate chromatographic conditions optimized for each analyte.
2. Experimental
2.1 Reagents and chemicals
Deionized water (>18 MΏ) was prepared from a Milli-Q purification system from Millipore Corporation (Millford, MA). HPLC grade acetonitrile was purchased from Burdick & Jackson (Muskegon, MI). ACS grade formic acid was purchased from EM Science (Gibbstown, NJ). Ammonium formate and ammonium acetate were purchased from J.T. Baker (Phillipsburgh, NJ). Rat plasma (K3EDTA) was purchased from Bioreclamation Inc. (Hicksville, NY). MultiScreen Solvinert, 0.45 μm low-binding hydrophilic PTFE filter plates, were purchased from Millipore Corporation (Millford, MA). The drug candidates used in the experiments described herein were provided by Discovery Chemistry of Bristol-Myers Squibb (Princeton, NJ). Table 1 summarizes the compounds included in each of the experiments.| Compound | Discovery program | |
|---|---|---|
| I | Parent, weak base (P) | A |
| II | N-dealkylated metabolite of I (M1) | A |
| III | N-oxide metabolite of I (M2) | A |
| Methotrexate | Weak acid | A |
| IV | Parent, weak base | B |
| V | Phosphate pro-drug of IV | B |
2.2 Equipment
The multiplexed LC-MS/MS system used was an Aria TLX2 from Thermo Fisher Scientific-Cohesive Technologies (Franklin, MA) coupled with an API4000 triple quadrupole mass spectrometer (Applied Biosystems/MDS Sciex, Concord, Ontario, Canada). The Aria TLX2 contained four LC systems (TX1, TX3, LX1, and LX3), each LC system consisting of two Shimadzu LC-10ADvp pumps and a SCL-10Avp system controller (Columbia, MD). A column switching valve module selected one of the LC streams into the mass spectrometer. The system was designed for two-way on-line extraction applications. Through a re-plumbing, the loading pumps of on-line extraction (TX1 and TX3) were used as LC systems as well and the Aria TLX2 was converted into an Aria LX4 four-way LC system (LC system 1 = TX1, LC system 2 = LX1, LC system 3 = LX3, LC system 4 = TX3). The autosampler was a CTC HTS PAL with four injectors equipped with a cooling stack maintained at 4 °C. Scheme 1 shows the LC configuration of Aria LX4 (re-plumbed from Aria TLX2).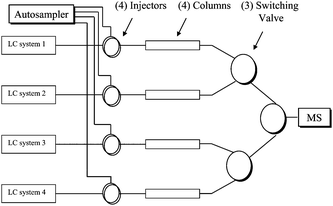 | ||
| Scheme 1 Schematic configuration of Aria LX4 (re-plumbed from Aria TLX2) including four LC systems with four columns and a single arm CTC autosampler with four injectors. | ||
2.3 Plasma sample preparation
Plasma sample preparations were performed with a Tomtec Quadra-96 automated liquid handler. Acetonitrile (50 μL) containing 300 ng/ml of the Internal Standard (IS) was placed into each well of a 96-well 0.45 μm MultiScreen hydrophilic filtration plate (Millipore, MA) followed by the addition of a 25 μL aliquot of a plasma sample from an in vivo PK study. The plate was vortex-mixed for three minutes. The supernatant was then separated from the precipitated proteins by a five-minute centrifugation/filtration in Centrifuge 5810R (Eppendorf) @ 3000 rpm over a Dynablock plate (96 × 0.5 mL).142.4 Chromatographic and mass spectrometric conditions
Ammonium formate, formic acid, and ammonium acetate were used as modifiers in the aqueous LC mobile phases to adjust pH. Acetonitrile was used as the organic LC mobile phase. The aqueous mobile phase A of LC system 1 (TX1) was 0.1% formic acid in water; the organic mobile phase B was 0.1% formic acid in acetonitrile. The aqueous mobile phase A of LC system 2 (LX1) was 10 mM ammonium formate/0.1% formic acid in water (pH 3); the organic mobile phase B was 0.1% formic acid in acetonitrile. The aqueous mobile phase A of LC system 3 (LX3) was 10 mM ammonium acetate in water (pH 6.5); the organic mobile phase B was acetonitrile containing 10% mobile phase A as the modifier. LC system 4 (TX3) was available for another LC mobile phase but not used in the work described herein. The mobile phases used for all the experiments are summarized in Table 2. The LC column in each LC system was Atlantis dC18 (2.1 mm × 50 mm, 5 μm) from Waters Corporation (Milford, MA). The four-minute gradient is summarized in Table 3. The injection volume was 10 μL in all experiments described herein.| Aqueous component (mobile phase A) | Organic component (mobile phase B) | LC systems in Aria TLX2 | |
|---|---|---|---|
| Mobile phase 1 | 0.1% formic acid in water (pH 3) | Acetonitrile containing 0.1% formic acid | LC system 1 |
| Mobile phase 2 | 10 mM ammonium formate/0.1% formic acid in water (pH 3) | Acetonitrile containing 0.1% formic acid | LC system 2 |
| Mobile phase 3 | 10 mM ammonium acetate in water (pH 6.5) | Acetonitrile containing 10% of 10 mM ammonium acetate in water | LC system 3 |
| Mobile phase 4 | Available but not used in the work described herein | LC system 4 | |
| Time (min) | B% | Flow rate (μL/min) |
|---|---|---|
| 0–0.5 | 5 | 300 |
| 0.5–2 | 5–95 | 300 |
| 2–3 | 95 | 300 |
| 3–3.1 | 95−5 | 300 |
| 3.1–4 | 5 | 300 |
The API4000 mass spectrometer was operated in Turbo Ion-Spray mode. The source conditions are listed in Table 4. Quantitative MS/MS analysis was performed in the multiple reaction monitoring (MRM) mode.
| Curtain gas | 30 unit |
| Gas 1 | 50 unit |
| Gas 2 | 50 unit |
| Collision gas pressure | 6 unit |
| Ion spray voltage | 4500 V |
| Source heater temperature | 450 °C |
3. Results and discussion
3.1 Selection of mobile phase and injection solvent
Selecting the LC mobile phase with proper pH and modifier is an effective way of achieving proper retention, peak shape, LC-MS/MS response, and chromatographic resolution. This is illustrated with the work described below using a single column for each mobile phase and injection solvent optimization.Three mobile phases, designated as mobile phases 1, 2, and 3 described in Table 1, were evaluated in the LC method development of a drug candidate (I) and its N-dealkylated metabolite (II) from discovery program A. The mobile phases were selected to cover a range of pHs and are all commonly used in modern LC/MS bionalytical applications. In addition, three injection solvents with varying ratios of water/acetonitrile (40, 60, 80% of water), were also evaluated during the mobile phase screening. The purpose here was not to optimize the LC conditions for a given separation but rather to select the best of a limited number of generic conditions. A fourth mobile phase could be screened in the 4th LC channel but this adds to the duration of the experiment and was deemed unnecessary.
The results are summarized in Fig. 1 (1a–1c). With mobile phase 1, both I and II had solvent-front “break-through” peaks for all the three injection solvents used (Fig. 1a), suggesting a mismatch between the injection solvent and the mobile phase. In contrast, with mobile phase 2, I and II did not show “break-through” peaks for the two injection solvents with the higher water content (Fig. 1b). In addition, the responses of I and II were about 10-fold higher than those with mobile phase 1. This indicated that the presence of the ammonium ion had a desirable effect on analyte response. Further improvement of the chromatographic behaviors of I and II was achieved using mobile phase 3. As shown in Fig. 1c, both I and II achieved a single chromatographic peak, with no “break-through” peak, with all the three injection solvents used. Peaks were also more symmetrical. In addition, near baseline resolution was achieved between I and II. The responses of I and II in Fig. 1c were about the same as in Fig. 1b. It should be noted that mobile phase 3 could tolerate a higher organic solvent strength in the injection solvent for these compounds and that this is advantageous when using acetonitrile protein precipitation (PPT) for sample extraction with plasma/acetonitrile ratio of 1![[thin space (1/6-em)]](https://www.rsc.org/images/entities/char_2009.gif) :
:![[thin space (1/6-em)]](https://www.rsc.org/images/entities/char_2009.gif) 2. The PPT extracts contained approximately 66% of acetonitrile and 34% of water and could be injected straight without addition of water or buffer solution.
2. The PPT extracts contained approximately 66% of acetonitrile and 34% of water and could be injected straight without addition of water or buffer solution.
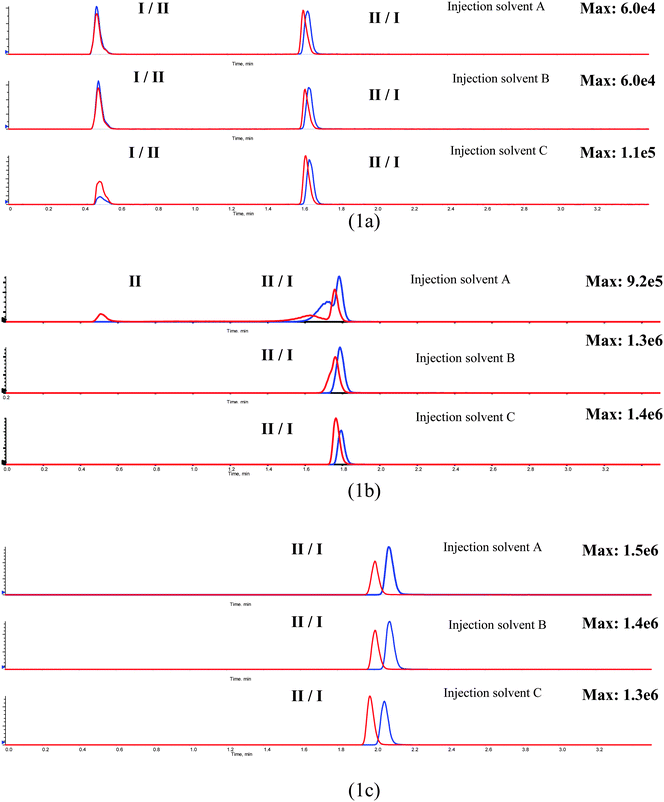 | ||
| Fig. 1 Illustration of the effect of mobile phase pH, modifier, and injection solvent on chromatographic retention, peak shape, response, and separation of I and II: (1a) mobile phase 1 with three different injection solvents; (1b) mobile phase 2 with three different injection solvents; (1c) mobile phase 3 with three different injection solvents. The three injection solvents A, B, and C are water/acetonitrile of 40/60, 60/40, and 80/20, respectively. | ||
The above optimizations were conveniently carried out using multiplexed LC-MS/MS systems. On a single-mobile phase/single-column system, LC optimization involves manually changing mobile phase solvent bottles, columns, and purging the system, which is inconvenient and time consuming. In drug discovery, where new compound screening studies are conducted in fast pace, the use of a single LC-MS/MS system for supporting fast-turnaround analysis of samples from multiple studies of different compounds from the same, or different, research programs is not uncommon. Bioanalysts are thus faced with two unpalatable choices: compromising the quality of bioanalytical methods and sample analyses, or conducting LC method development and sample analyses at a slower pace. Multiplexed systems can speed up fit-for-purpose method optimization while maintaining the quality of the data output.
3.2 Separate methods for separate studies: bioanalytical support for two studies from two different drug discovery programs
In a discovery setting, the number of samples in a given pre-clinical PK study is not necessarily very large and the time saving provided by parallel analysis of these samples (which has been the most common use of multiplexed LC5) is relatively modest. However, the ability to use multiple LC channels, independently from each other to perform any analysis needed at a given time, increases the overall throughput of the laboratory. This approach is demonstrated with two examples.In drug discovery program A, there was a need for the analysis of pharmacokinetics study samples for drug (I) and its two metabolites (II and III). While co-eluting in mobile phase 2, all three analytes were chromatographically resolved using mobile phase 3 (Fig. 2). The separation of I and III was required. III undergoes in-source conversion to I, as shown in Fig. 2c, which would interfere with the quantitation of I in the absence of chromatographic resolution.
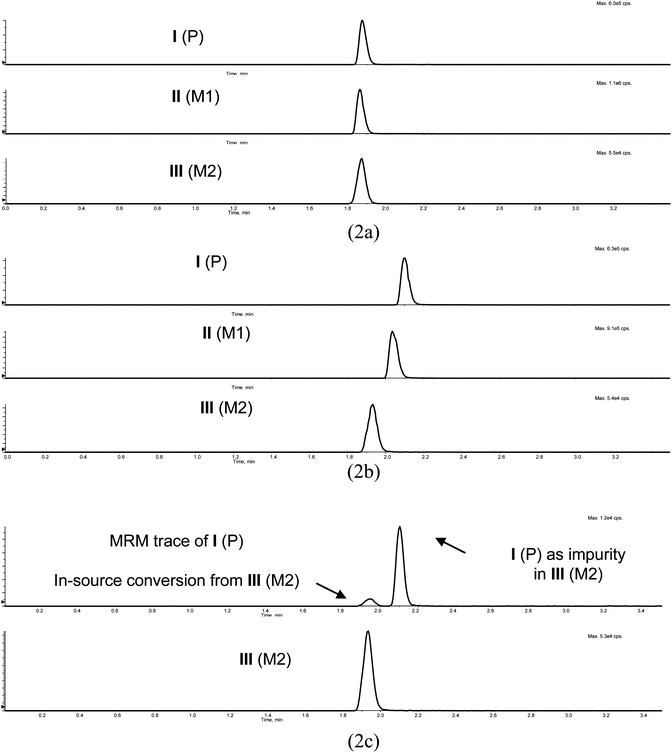 | ||
| Fig. 2 Chromatographic behavior of drug candidate I and its metabolites II and III in mobile phase 2 (pH 3.0) and mobile phase 3 (pH 6.5), and the in-source conversion of III to I: (2a) mobile phase 2, where I, II and III co-eluted; (2b) mobile phase 3, where I, II and III are resolved; (2c) MRM traces of both I and III following injection of standard of III with mobile phase 3, where III underwent in-source conversion to I and the III standard had I in it as an impurity. P, M1 and M2 in the figure legends designate parent, metabolite 1 and metabolite 2, respectively. | ||
During the same period of time, drug discovery program B was also supported by the same team. In program B, a pro-drug (V) of parent compound IV, was evaluated. A pro-drug is prone to conversion back to the parent drug if it undergoes fragmentation in the MS ion source. Thus, the chromatographic separation of the pro-drug from parent drug was required. The two compounds are resolved with mobile phase 2 (Fig. 3).
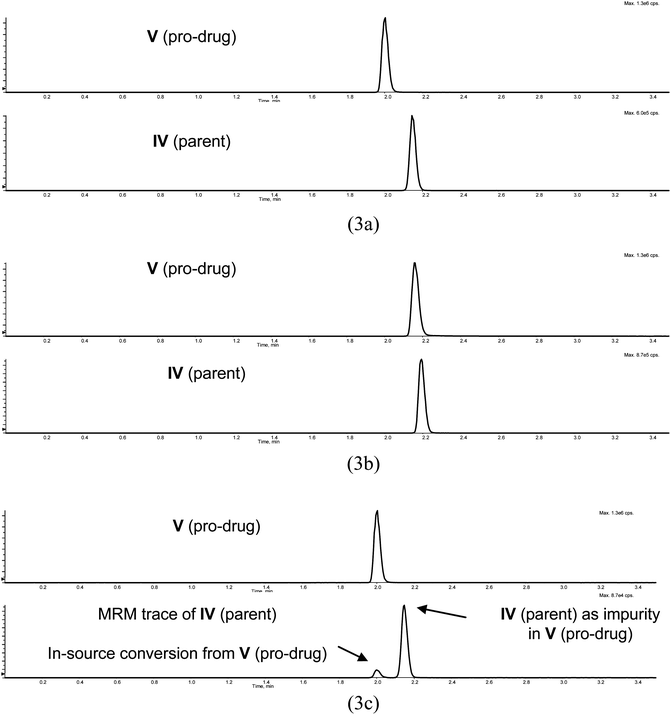 | ||
| Fig. 3 Chromatographic behavior of drug candidate IV and its prodrug V in mobile phase 2 (pH 3.0) and mobile phase 3 (pH 6.5), and the in-source conversion of V to IV: (3a) mobile phase 2, where IV and V are separated; (3b) mobile phase 3, where IV and V co-eluted; (3c) MRM traces of both IV and V following injection of standard of V with mobile phase 2, where V underwent in-source conversion to IV and the V standard had IV in it as an impurity. | ||
The multiplexed system was used to conduct the simultaneous analysis of PK study samples from both programs, using mobile phase 3 for program A and mobile phase 2 for program B on separate LC units of the multiplexed system. The sample analysis for the two study samples could be carried out unattended in either sequential or parallel staggered mode with the assistance of the multiplexed system software. Even though the highest throughput was not achieved in either program, overall sample throughput was improved since the two programs did not have to be prioritized. It should be pointed out that the accuracy and precision results of the two methods in this way of operation were not different from those obtained with each method running on separate LC-MS systems (data not shown).
3.3 Multi-component analysis: Bioanalytical support for a single PK study using two separate LC methods, one for a drug candidate and its metabolite, and the other for a co-administered compound
This case PK study involves an experiment in drug discovery program A discussed earlier, in which the drug candidate I was co-administered with methotrexate for a mechanistic investigation. The study samples had to be analyzed not only for compound I and its metabolites II and III, but also for methotrexate. As established earlier in Fig. 2b in section 3.2, mobile phase 3 was suitable for the analysis of I, II, and III. For methotrexate, however, the best chromatographic peak shape was obtained with mobile phase 2 (Fig. 4). Consequently, the study samples were first analyzed for I, II, and III using mobile phase 3 on LC system 3 and then re-analyzed for methotrexate using mobile phase 2 on LC system 2. As in the example above, the two analyses involving different LC conditions could be conducted either sequentially or in a staggered parallel mode in totally automated operation.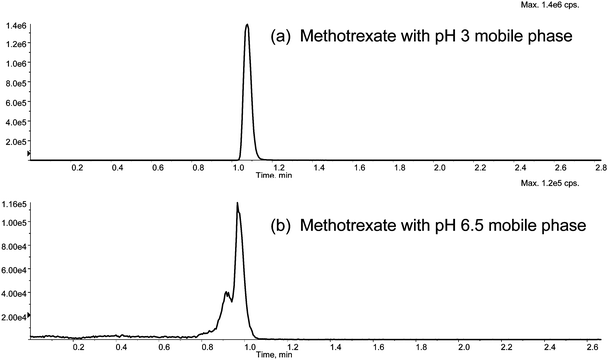 | ||
| Fig. 4 Chromatographic behavior of methotrexate in mobile phase 2 (pH 3.0) and mobile phase 3 (pH 6.5): (4a) mobile phase 2, where methotrexate showed a good chromatographic peak; (2b) mobile phase 3, where methotrexate showed a poor chromatographic peak. Note: The system software did not include the 50 s required for diverting the solvent front to waste in the displayed retention time. | ||
4. Conclusions
In the discovery space, fast turnaround is required for method development and sample analysis; hence, it is important to find ways to quickly develop and optimize methods with acceptable assay performance. As demonstrated in this work, the selection of the appropriate mobile phase and injection solvent plays a major role in attaining acceptable chromatographic peaks and resolution. The use of multiplexed LC-MS/MS system facilitates the achievement of such a fit-for-purpose method optimization and subsequent applications of the methods for sample analysis.5. References
- L. M. Mallis, K. J. Lynn, D. W. Choo, M. Wang, A. Cramer and C. Lindermuth, 53rd ASMS Conference, June 5–9, 2005, San Antonio, TX, USA Search PubMed.
- Y. Q. Xia, Z. Ouyang and M. Jemal, 54th ASMS Conference, May 28–June 1, 2006, Seattle, WA, USA Search PubMed.
- L. Zeng and D. B. Kassel, Anal. Chem., 1998, 70, 4380–4388 CrossRef CAS.
- J. T. Wu, Rapid Commun. Mass Spectrom., 2001, 15, 73–81 CrossRef CAS.
- R. C. King, C. Miller-Stein, D. J. Magiera and J. Brann, Rapid Commun. Mass Spectrom., 2002, 16, 43–52 CrossRef CAS.
- R. Xu, T. Wang, J. Isbell, Z. Cai, C. Sykes, A. Brailsford and D. Kassel, Anal. Chem., 2002, 74, 3055–3062 CrossRef CAS.
- S. Briem, B. Pettersson and E. Skoglund, Anal. Chem., 2005, 77, 1905–1910 CrossRef CAS.
- L. Zeng, R. Xu, D. B. Laskar and D. B. Kassel, J. Chromatogr., A, 2007, 1169, 193–204 CrossRef CAS.
- O. Trapp, Angew. Chem., Int. Ed., 2007, 46, 5609–5613 CrossRef CAS.
- D. Laskar, L. Zeng, R. Xu and D. Kassel, Chirality, 2008, 20, 885–895 CrossRef CAS.
- P. Sajonz, W. Schafer, W. R. Leonard, X. gong, S. Shultz, T. Rosner, Y. Sun and C. J. Welch, J. Liq. Chromatogr. Relat. Technol., 2008, 31, 2296–2304 CrossRef CAS.
- T. Kallal, R. Grant and A. Sanchez, 52nd ASMS Conference, May 23–27, 2004, Nashville, TN, USA Search PubMed.
- J. Whitson, D. Schoener and P. Lin, 56th ASMS Conference, June 1–5, 2008, Denver, CO, USA Search PubMed.
- B. Sleczka, J. Wang and T. Olah, LC-GC, 2006, 24, 694–700 CAS.
| This journal is © The Royal Society of Chemistry 2010 |
