Amperometric detection at carbon felt electrodes. Application to the determination of nitro musk derivatives and phenolic endocrine disruptors
Lourdes
Agüí
,
Verónica
Serafín
,
Paloma
Yáñez-Sedeño
and
José M.
Pingarrón
*
Department of Analytical Chemistry, Faculty of Chemistry, University Complutense of Madrid, 28040, Madrid, Spain. E-mail: pingarro@quim.ucm.es
First published on 15th March 2010
Abstract
The use of a carbon-felt electrode (CFE) of small dimensions for the amperometric detection of various nitro musk fragrances and phenolic compounds with endocrine disrupting properties is reported. The electrode material is composed of multiple disordered carbon fibres of micrometre diameter. The use of CFE for the detection of nitro musk derivatives implied the electrochemical activation by applying successive SW voltammetric scans between 0.0 and +2.6 V vs. Ag/AgCl in 0.1 M PBS of pH 7.0. At the activated CFE (aCFE), cyclic voltammograms for nitro musks derivatives in 0.1 M PBS of pH 7.0, showed a non-reversible behaviour with two or three cathodic peaks corresponding to the number of nitro groups present in the molecule. Hydrodynamic voltammograms from nitro musk solutions obtained under flow injection conditions at the aCFE led to the selection of a cathodic potential of −800 mV vs. Ag/AgCl as the value to be applied for the amperometric detection of these compounds. A calibration graph for musk ketone was obtained between 0.1 and 10 μg mL−1 with a detection limit of 50 ng mL−1. A RSD value of 3.7% was calculated for 10 successive measurements of 500 ng mL−1 musk ketone with no need for cleaning the electrode surface. Similar results to those obtained by GC-MS were found for the analysis of incense samples by FI with amperometric detection at the activated CFE. FI hydrodynamic voltammograms for estrogenic phenols at non-activated CFE exhibited current anodic plateaux from which a detection potential of +700 mV was chosen. Liquid chromatography with amperometric detection at the CFE was accomplished to analyze mixtures of estrogenic compounds. A mobile phase consisting of 40![[thin space (1/6-em)]](https://www.rsc.org/images/entities/char_2009.gif) :
:![[thin space (1/6-em)]](https://www.rsc.org/images/entities/char_2009.gif) 60 (v/v) acetonitrile
60 (v/v) acetonitrile![[thin space (1/6-em)]](https://www.rsc.org/images/entities/char_2009.gif) :
:![[thin space (1/6-em)]](https://www.rsc.org/images/entities/char_2009.gif) 0.05 M PBS of pH 7.0 was employed. Detection limits ranging between 102 nM for bisphenol A (BPA) and 182 nM for 17α-ethynylestradiol (EE2) were achieved. Good recoveries were obtained in the analysis of well water and tap water samples spiked with five phenolic estrogenic compounds at a 14 nM each concentration level.
0.05 M PBS of pH 7.0 was employed. Detection limits ranging between 102 nM for bisphenol A (BPA) and 182 nM for 17α-ethynylestradiol (EE2) were achieved. Good recoveries were obtained in the analysis of well water and tap water samples spiked with five phenolic estrogenic compounds at a 14 nM each concentration level.
1. Introduction
Carbon felt (CF), composed of multiple disordered carbon fibres of micrometric diameter, has been demonstrated to be an useful electrode material, upon electrochemical activation by scan wave voltammetry, for the selective electrochemical determination of nitrocompounds.1 Enhanced reduction currents for nitro compounds, as well as an improved selectivity were observed, similarly to that occurred with activated single carbon fibre microelectrode for the determination of nitroaromatic explosives (TNT and related compounds) in soil and water samples.2 CF maintains the advantageous characteristics of activated carbon fibre but improves remarkably the electrode stability with respect to electrode configurations prepared with a single fibre or with a bundle of carbon fibres.A main objective of this work is to take advantage of this stability to use CF electrodes as amperometric detectors in flowing systems. This electrode material can be employed to detect amperometrically and selectively electrochemicaly reducible nitrocompounds, as well as oxidizable compounds using, in this case, non-activated CF. This proof of concept has been verified in this work by performing determination of nitro musk derivatives and phenolic endocrine disruptors, respectively. Both synthetic estrogens and nitro musk fragrances are widely present in wastewater world-wide3,4 and can be considered as emerging compounds from an environmental standpoint. Some personal care products (PCPs) (e.g. synthetic musk fragrances) have been suspected endocrine-disrupting compounds.
There is therefore the need for further improvements to develop quick and sensitive analytical procedures, with versatility in simultaneous screening for a wide variety of compounds. A single method for the analysis of different classes of target analytes would be convenient, since it would reduce the overall analysis time, field sampling and costs.5 In the recent years, natural fragrances used for the manufacture of cleaning agents, cosmetics and PCPs have been substituted by synthetic compounds with similar characteristics, due to the elevated costs of their extraction from animals or plants. Synthetic musks (polycyclic and nitro musks) have been used as fragrance additives in a wide variety of products, such as soaps, perfumes, air-fresheners or detergents, and now they are considered an important group of emerging pollutants with negative impact on humans health due to the persistent and long-term chronic exposure.6 The lack of biological and chemical degradation of these compounds has raised considerable attention in the field of environmental chemistry.7 In particular, nitro musk compounds are only poorly degraded by microorganisms, although they can be reduced to amino derivatives in anaerobic conditions8 giving anilines, which possibly are even more problematic than the parents compounds.7,9 With a high capacity of accumulation in fatty tissues, these compounds have recently been identified in humans.10 From 1997, EU regulations banned the use of nitro musk fragrances. Among them, musk xylene (MX) and musk ketone (MK), two of the most widely used products, found in detergents and cosmetics,11 have maximum authorized concentrations of 0.03–1% MX and 0.042–1.4% MK, depending on the product.12
Methods for the determination of synthetic musks have been reviewed very recently.9 Gas chromatography is the most widely accepted analytical technique for these compounds because of their relatively high vapour pressure and stability against temperature. GC-MS has been used for the determination of nitro musks in waters,12–20 sludges,7,21,22 sediments,22–24 biota,25,26 air27,28 dust,29 personal care and sanitation products,30 and incense.31,32 Non-aqueous capillary electrophoresis has been also used for the determination of nitro musks in incenses.33 Sample treatments and clean up procedures involved solid phase extraction (SPE) using C1817 or divinylbenzene polymeric cartridges,34 and liquid–liquid extraction (LLE) with toluene35,36 or n-hexane.37 Solid phase microextraction (SPME) was also employed,13,28,32 as well as Soxhlet extraction with ethylacetate35 or dichloromethane,10 and accelerated solvent extraction (ASE)21 for sludges, sediments and biota samples.
On the other hand, the behaviour similar to hormones that exhibit some pesticides and industrial products called “endocrine-disruptors”, EDCs, is well known and documented.38 Some alkyl phenols produced in high quantities in industrial applications have been identified as xenoestrogens. Examples are disinfectants such as 2-hydroxybiphenyl (OPP) or bisphenol A (BPA), used for the fabrication of polycarbonate packings. These compounds, together with natural hormones and pharmaceuticals prescribed for birth control, constitute a newly defined category of environmental contaminants. GC is the technique commonly used in the analysis of estrogenic species.39,40 However, the required sample preparation procedures limit its application to complex real samples. LC-MS is also an useful technique for the analysis of environmental and biological samples.41 UV42 and fluorescence43 detection was also used. Coulometric detection using multielectrodes has demonstrated to possess a good sensitivity.44 However, amperometric detection has been scarcely employed for this purpose, because of its poorer sensitivity and problems derived of electrode fouling.45 The analysis of river waters containing a mixture of EDCs and estrogenic phenols was accomplished using a glassy carbon electrode (GCE) at +1.0 V after preconcentration by SPME.45 The voltammetric behaviour of xenoestrogens 4-nonylphenol (NP) and BPA at a platinum electrode was compared with that of β-estradiol and other natural hormones.46 Moreover, the electrooxidation of BPA was also studied at a glassy carbon electrode.47 Carbon fibre electrodes were used to carry out the electrochemical removal of NP48 and BPA.49 More recently, a method for the electrochemical detection of phenolic estrogenic compounds at a carbon nanotube-modified electrode has been reported.50
In this work a flow injection method with amperometric detection at activated CF electrodes was developed for the determination of nitro musks in incense. To our knowledge, this is the first work using electrochemical analysis to quantify nitro musk compounds. The use of activated CF electrodes allows a selective cathodic response to the analytes to be obtained. Considering the significance of the development of screening methods for the rapid in situ determination of total nitro musks in environmental samples or consumer products, the voltammetric signals recorded with activated CF electrodes may be used as a basis for the selective identification of the active components from sample extracts. Another significant advantage of the prepared methodology relies on the minimum sample treatment required.
On the other hand, a liquid chromatographic method for the determination of phenolic estrogens based on the amperometric monitoring of their oxidation responses at non-activated CF was also developed. A high sensitivity, together with a good repeatability of the measurements and a good reproducibility of the responses obtained with different modified electrodes were achieved. The method was applied to the analysis of spiked water samples containing low concentration levels of these compounds.
2. Experimental
2.1. Apparatus and electrodes
Voltammetric measurements were carried out with a BAS (West Lafayette, IN, USA) 100B potentiostat provided with a BAS C2 EF-1080 cell stand. A BAS VC-2 10-mL electrochemical cell was also employed. The reference electrode was a BAS MF 2052 Ag/AgCl electrode. A Pt wire was used as auxiliary electrode. An electrochemically activated carbon-felt electrode prepared as previously described1 was used as working electrode for the nitro musk derivatives determination. In brief, a carbon-felt sheet (10 mm VDG carbon-felt, National Electrical Carbon Corp. OH, USA) was cut into a cube 1.0 cm in height, which was rinsed with acetone and dried at room temperature. Then, a hollow poly(ethylene) cylinder (2.0 mm Ø and 2.0 mm height) was press-fitted into the carbon-felt cube, and the remaining cabon felt was removed by polishing on a smooth paper. A bunch of about 20 carbon fibres (8 μm Ø, 20 mm length) were transversely inserted through the carbon-felt with the aid of a syringe. The portion of fibres out of the cylinder served for the electrical contact, and was inserted into a poly(propylene) pipet tip, which was fixed to the cylinder by heating. Finally, the pipet was backfilled with mercury, and a copper wire, used as the electrical contact, was introduced and sealed to the pipet support with epoxy resin. Electrochemical activation was accomplished by applying ten successive SW voltammetric scans between 0.0 and +2.6 V (vs Ag/AgCl) to the carbon felt electrode immersed in a 0.1 M H2PO4−/HPO42− buffer solution of pH 7.0. A squarewave amplitude, Esw, of 50 mV, a step height, ΔEs, of 4 mV, and a frequency, f, of 25 Hz were used.Chromatographic and flow injection experiments were performed using a Knauer 1000 Smartline pump provided with a Knauer 5000 Smartline Manager stand, and a Knauer A 1357 injection valve provided with a 50-μL coil. A Metrohm EA 1096 wall-jet cell equipped with a Ag/AgCl/3M KCl reference electrode and a gold counter electrode was also used. As Scheme 1, shows, the CF working electrode was inserted into the wall-jet cell perpendicularly to the flowing solution, so that the carrier solution continuously passed through the carbon felt. Potential values applied were controlled by means of a BAS Epsilon Multichannel detector, and the Chromograph 1.0.01 software (Liquid Chromatography Control Software) from BAS was used to record and treat data. A Luna C18 (150 mm × 4.6 mm i.d., 5-μm particle size) (Phenomenex) chromatographic column was also used.
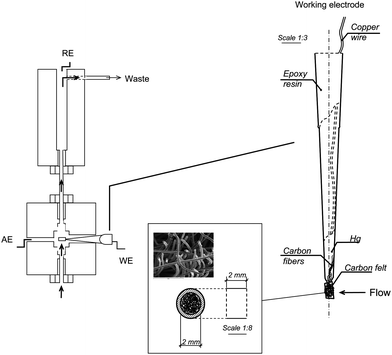 | ||
| Scheme 1 | ||
2.2. Reagents and solutions
Musk xylene (MX, 1-tert-butyl-3,5-dimethyl-2,4,6-trinitrobenzene, Riedel de Haën), musk ketone (MK, 4-tert-butyl-2,6-dimethyl-3,5-dinitroacetophenone, Dr Ehrenstorfer GmbH, 98%), musk moskene (MM, 1,1,3,3,5-pentamethyl-4,6-dinitroindane, LGC Promochem GmbH), musk tibetene (MT, 1-tert-butyl-3,4,5-trimethyl-2,6-dinitrobenzene, Promochem GmbH), and musk ambrette (MA, 1-tert-butyl-2,4-dimethyl-6-methoxy-3,5-dinitrobenzene, Dr Ehrenstorfer, GmbH, 99%) were used (see Scheme 2). Stock 100 mg L−1 musks solutions were prepared in pure acetonitrile (SDS, HPLC reagent grade). Stock 5.0 × 10⁻² M solutions of bisphenol A (BPA), o-phenylphenol (OPP), 17α-ethynylestradiol (EE2), estriol (E3) and diethylstilbestrol (DES) (Sigma, 99%), were prepared in acetonitrile. More diluted standards were prepared by suitable dilution with the appropriate supporting electrolyte solution. 0.1 M or 0.05 M phosphate buffer solutions of pH 7.0, and a 0.1 M Britton-Robinson buffer solution prepared at different pH values adjusted by addition of 2 M NaOH were used as supporting electrolytes and as the carrier solution under flow injection conditions. Other solvents and chemicals used were of analytical reagent grade and water was obtained from a Millipore Milli-Q purification system.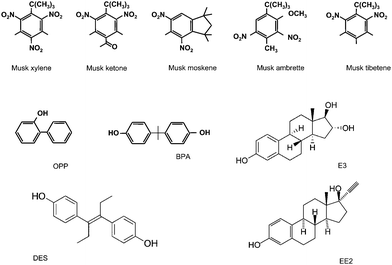 | ||
| Scheme 2 | ||
2.3. Procedures
![[thin space (1/6-em)]](https://www.rsc.org/images/entities/char_2009.gif) :
:![[thin space (1/6-em)]](https://www.rsc.org/images/entities/char_2009.gif) 60 acetonitrile
60 acetonitrile![[thin space (1/6-em)]](https://www.rsc.org/images/entities/char_2009.gif) :
:![[thin space (1/6-em)]](https://www.rsc.org/images/entities/char_2009.gif) 0.05 M phosphate buffer solution of pH 7.0, which was previously filtered through a 0.1 μm Nylon membrane. A flow rate of 1.0 mL min−1 and an injection volume of 50 μL were used, as well as a detection potential of +0.7 V versus Ag/AgCl.
0.05 M phosphate buffer solution of pH 7.0, which was previously filtered through a 0.1 μm Nylon membrane. A flow rate of 1.0 mL min−1 and an injection volume of 50 μL were used, as well as a detection potential of +0.7 V versus Ag/AgCl.
3. Results and discussion
Activation of CFEs was carried out by applying successive SW voltammetric scans.1 The influence of the variables involved in the activation process on the voltammetric responses of MK solutions was investigated by cyclic voltammetry. Better voltammetric signals-to-background current ratios (data not shown) were obtained by applying ten successive SW voltammograms scanned between 0.0 and +2.6 V vs. Ag/AgCl to the CFE immersed in a 0.1 mol L−1 H2PO4−/HPO42− buffer solution of pH 7.0. Furthermore, the highest cathodic signals from MK (see below) were obtained using a square wave amplitude, Esw, of 50 mV, a step height, ΔEs, of 4 mV, and a frequency, f, of 25 Hz. Repetitive measurements with a single electrode gave RSD values of 4.5% (n = 10), and the electrode-to-electrode reproducibility (n = 5) was of 5.6%. A current density, ic/AC, where A is the geometric electrode area, of 90 mA cm−2 M, was obtained.3.1. Voltammetric behavior of nitro musks at the activated carbon felt electrode
Similarly to other nitro derivatives, the reduction of nitroaromatic groups in nitro musks exhibited a strong pH dependence, with a shift of the Ep values to more negative potentials as the pH increased.52 Moreover, the values of ip were not very pH dependent. We selected 0.1 M phosphate buffer solution of pH 7.0 for further work because the same medium was employed in the CFEs activation step. Fig. 1 shows cyclic voltammograms obtained from 5.0 mg L−1 solutions of MX, MK, MA, MT and MM at an electrochemically activated CFE in 0.1 M PBS of pH 7.0. As can be seen, all the compounds exhibited an irreversible behavior with two or three cathodic peaks corresponding to the number of nitro groups present in the molecule. Inset of Fig. 1 compares CVs for 5 mg L−1 MK at the activated and non-activated CFE. As it can be observed, a poorly defined small broad band centered at approximately −700 mV appeared at the non-activated CFE. Furthermore, Fig. 2 compares MK cyclic voltammograms obtained at the activated CFE with those registered using other carbon electrodes as well as with single carbon fibre microelectrode (CFME), 8 μm in diameter, activated also by SWV. As can be observed, no cathodic peaks appeared when using glassy carbon (a) or graphite (f) electrodes, as well as at activated CFMEs modified with vinyl ester (b) or epoxy resin (e). These results are in agreement with the behaviour observed at electrochemically activated CFME (d), which was attributed to the fracture of carbon fibres with the subsequent appearance of deep fissures enabling penetration of electroactive species into the interior void volume, and giving rise to an important contribution of adsorption and/or thin-layer electrolysis to the total voltammetric response.2,53,54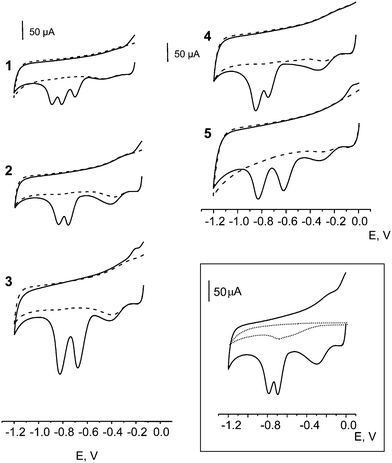 | ||
| Fig. 1 Cyclic voltammograms at an activated carbon felt electrode (aCFE) for 5.0 mg L−1 solutions of: 1) musk xylene (MX), 2) musk ketone (MK), 3) musk ambrette (MA), 4) musk tibetene (MT), 5) musk moskene (MM) in 0.1 M phosphate buffer solution of pH 7.0. (- - - -) Background voltammogram; ν = 50 mV s−1. Inset: Cyclic voltammograms at an activated (—) and a non activated (…) carbon felt electrode. | ||
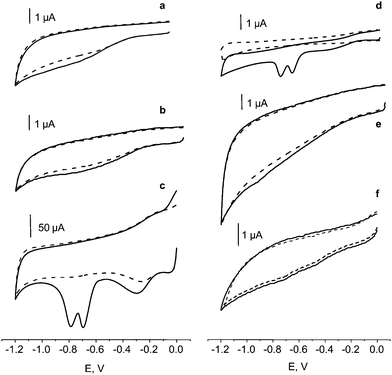 | ||
| Fig. 2 Cyclic voltammograms for 5.0 mg L−1 solutions of musk moskene (MK) in 0.1 M phosphate buffer solution of pH 7.0 recorded at a glassy carbon electrode (a), an activated CFME-vinyl ester (b), an activated CFE (aCFE) (c), an activated CFME (d), an activated CFME-epoxy (e), a graphite electrode (f).(- - - -) Background voltammogram; ν = 50 mV s−1. | ||
Accordingly with the accepted mechanism for electrochemical reduction of nitro compounds,52 the cathodic responses obtained for the musk species can be attributed to a four-electron reduction of the nitro group to the hydroxylamine derivative. The electrochemical reduction of polynitro aromatic compounds has been claimed to be a complex process that depends on the number of nitro groups, their relative positions on the ring, and the nature of other substituents on the aromatic system.55 As commented above, voltammograms from MX exhibit three reduction peaks while dinitro derivatives (MK, MA, MT and MM) display two reduction peaks. These peaks correspond to the reduction of each of the nitro groups present in the molecules. This type of multiple signals was also observed for nitro aromatic explosives (TNT and related compounds) at activated carbon fibre microelectrodes,2 as well as for TNT previously accumulated on a carbon nanotube-modified glassy-carbon electrode56 and for 2,6-DNT adsorbed on a screen printed carbon electrode (SPCE).57 However, no multiple peaks were reported for SPCEs without previous accumulation,58 and for non-activated carbon fibres.59
Penetration of nitromusk compounds into the microchannels of the activated fibres was demonstrated by recording cyclic voltammograms from the background buffer solution, with an activated CFE which was previously used to record cyclic voltammograms from a 5 mg L−1 MK solution (Fig. 3a), and then thoroughly rinsed with the same buffer. The voltammetric signals of MK clearly appeared in the first scan (Fig. 3b), and rapidly decreased in successive scans (not shown). This demonstrated that MK was present inside the activated CFE upon removal from the MK solution, and that MK was removed by subsequent potential scans. This accumulation can serve as a preconcentration step for the development of sensitive methods for nitromusks determination. Moreover, the accumulation process might be also used for decontamination coupled with electrochemical remediation procedures, using a working electrode of large surface area.
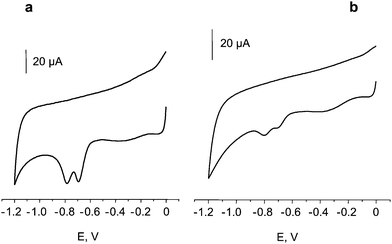 | ||
| Fig. 3 Cyclic voltammograms for a 5.0 mg L−1 solution of musk moskene (MK) in 0.1 M phosphate buffer solution of pH 7.0 at an activated CFE (a), and for 0.1 M phosphate buffer solution of pH 7.0 with the same activated CFE previously used to obtain five voltammograms of the MK solution (b); ν = 50 mV s−1. | ||
3.2. Determination of nitro musks by flow injection with amperometric detection at the activated CFE
The amperometric detection under flow conditions of nitro musks at the activated CFE was evaluated using MK as the target compound. Firstly, a hydrodynamic voltammogram was constructed by measuring the corresponding peak current values at different applied potentials, after injection of 50-μL aliquots of 0.5 mg L−1 MK solutions into the carrier solution consisting of 0.1 M phosphate buffer of pH 7.0 (Fig. 4). This carrier solution was selected because it demonstrated to be an excellent medium for the electrochemical reduction of the nitro group in aromatic organic compounds using activated carbon fibre microelectrodes.2,53,54 As it can be observed, the peak current increased as the potential shifted to more negative values, reaching a quasi-plateaux region in the −0.8 to −1.0 V range. However, no measurable currrents were obtained when using a non-activated CFE. Accordingly, a detection potential of −0.8 V was selected for further work as a compromise between sensitivity and an acceptable selectivity. The effect of the flow rate was studied in the 0.2–1.2 mL min−1 range. The peak current increased and the peak width decreased with increasing the flow rate in the whole range tested. The relative standard deviation values for ip using flow rates of 0.7, 0.9 and 1.0 mL min−1 were (n = 10) 5.3%, 4.3% and 3.7%, respectively, for injections of 50-μL aliquots of 0.5 mg L−1 MK with no need for cleaning the electrode surface. According to these results, a flow rate of 1.0 mL min−1 was chosen for further work, as it allows a better sensitivity and repeatability to be obtained as well as a fast response.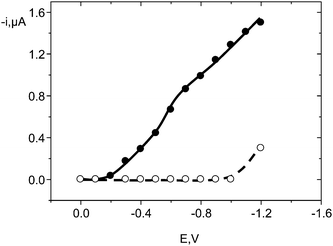 | ||
| Fig. 4 Hydrodynamic voltammograms obtained by flow injection with amperometric detection at an activated CFE (●), and a non-activated CFE (○), after injection of 50 μL aliquots of 0.5 mg L−1 MK in 0.1 M phosphate buffer solution of pH 7.0. | ||
A calibration graph was constructed under the above mentioned conditions with a linear range between 0.1 and 10 μg mL−1 (r = 0.999) and a slope value of 15 ± 1 nA mg−1 L. The detection limit was calculated according to the S/N = 3, where N is the maximum noise level between peaks, expressed in concentration units, obtained by repetitive (n = 10) injections of 0.1 μg mL−1 MK aliquots (the lowest concentration of the calibration plot), and S is the mean MK concentration calculated from these repetitive measurements. The LOD value achieved was 50 ng mL−1, which is significantly higher than those obtained using GC-MS.9 However, the linear range is adequate for the determination of nitro musk contained in incense samples, with no need of sample treatment.31 Moreover, the developed method could be applied to the analysis of environmental samples such as sewage sludges, waters or sediments, after a previous preconcentration step.
Interference from the presence of other compounds such as phenol, vanillin, diethylphtalate, sodium dodecylsulfate (SDS) and Triton X-100, was checked by registering the amperometric responses from injections of solutions of these compounds. Under the experimental conditions used, none of substances tested gave significant amperometric signals, the background current being similar to that of the carrier electrolyte solution.
3.3. Determination of nitro musks in incense
The applicability of the FI method was tested by analyzing commercial incense sticks from India. The procedure described in section 2.3.2 was applied to the determination of nitro musk concentration in samples extracts by triplicate. The composition of the incense sample was firstly verified by GC-MS, being musk ketone the only nitro musk compound identified. Quantification by GC-MS yielded a mean musk ketone concentration for 4 samples analyzed of 13.0 ± 0.6 mg g−1. This result is very similar to that obtained by flow injection with amperometric detection at the activated CFE, 12.8 ± 0.8 mg g−1, which demonstrates fairly well the usefulness of the FI method for the analysis of this kind of samples. In the case that the sample contained other musk compounds, a total content expressed as musk ketone concentration should be given.3.4. Voltammetric behaviour of phenolic estrogenic compounds at the carbon felt electrode
Fig. 5 shows cyclic voltammograms at the non-activated CFE from 1.0 × 10⁻⁵ M solutions of estrogenic hormones EE2, E3 and DES and xenoestrogens BPA and OPP, in 0.1 M phosphate buffer solution of pH 7.0. As it can be seen, all the compounds tested exhibited well defined anodic peaks at potentials ranging between 540 mV (EE2) and 580 mV (OPP) versus Ag/AgCl. They showed an irreversible behavior similarly to that observed with MWCNTs-modified glassy carbon electrodes.50 Furthermore, as expected, the cyclic voltammograms for OPP and DES exhibited cathodic peaks at +280 mV preceded by a shoulder at +352 mV in the case of OPP, and at +180 mV in the case of DES. Both OPP and DES are the only phenolics studied able to form the corresponding quinones in the anodic step, which are further reduced in the cathodic sweep.50 Background voltammograms (dotted lines) did not show any peak in the whole potential range tested.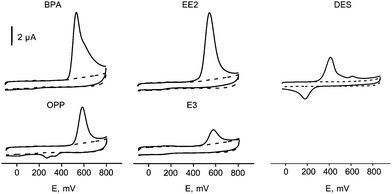 | ||
| Fig. 5 Cyclic voltammograms at a carbon felt electrode (CFE) for 1.0 × 10⁻⁵ M solutions of: bisphenol A (BPA), 17α-ethynylestradiol (EE2), diethylstilbestrol (DES), o-phenylphenol (OPP) and estriol (E3) in 0.1 M phosphate buffer solution of pH 7.0. (- - - -) Background voltammogram; ν = 25 mV s−1. | ||
The effect of pH on the oxidation peak current and peak potential values of the phenol derivatives was studied. The results obtained over the 2.0–12.0 pH range using 0.1 M Britton–Robinson buffer as supporting electrolyte showed the peak potential to be shifted towards less positive values when pH increased as it is usual for the oxidation of phenolic compounds. As an example, Fig. 6 shows the Ep and ip pH dependence for EE2 and DES. Two linear ranges were observed from the corresponding Epvs. pH plots in all cases, with slope values ranging between −55.0 and −59.2 mV, which is consistent with the exchange of two electrons and two protons in the electrochemical oxidation of the phenolic estrogenic compounds at the CFE. The intercept values of these compounds ranging between 10.0 and 10.4 for OPP, BPA, EE2 and E3, and showing a more acid behavior (pKa 9.2) for DES. All these values agree well with those reported in the literature.60–62 On the other hand, the peak current also showed, in general, a slight decrease with increasing pH, similarly to that reported for phenolic compounds with different electrode materials.50 Therefore, in order to achieve a compromise between acceptably large peak currents and low detection potentials, a pH value of 7.0 was selected for the amperometric detection of these compounds.
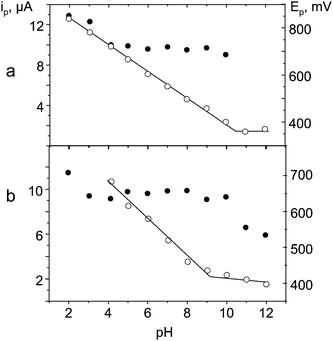 | ||
| Fig. 6 Influence of pH on peak current (●) and peak potential (○) values obtained by cyclic voltammetry at a non-activated CFE for a) 1.0 × 10⁻⁴ M EE2 and b) 1.0 × 10⁻⁴ M DES. | ||
3.5. Determination of estrogenic phenols by HPLC with amperometric detection at the CFE
Flow injection hydrodynamic voltammograms from 1.0 × 10⁻⁵ M solutions of estrogenic phenols were registered using a non activated CFE. Fig. 6 shows the results obtained for BPA and EE2. Current oxidation plateaux were observed in all cases, from which a detection potential of + 0.7 V (vs. Ag/AgCl) was chosen. This value is 300 mV less positive than that reported in the literature using a glassy carbon electrode.63 Moreover, similar conclusions to those commented for nitro musks could be raised concerning the effect of flow rate on peak current and peak width.Liquid chromatography with amperometric detection at the CFE was accomplished to analyze mixtures of estrogenic compounds. Isocratic elution using a C18 reversed-phase column (Phenomenex Luna C18) was employed. The composition of the mobile phase was optimized by studying the influence of the type and percentage of organic solvent on the FI anodic current for OPP. Methanol or acetonitrile: 0.05 M phosphate buffer solutions of pH 7.0 mixtures were checked. As Fig. 7a shows, ip decreased as the percentage of organic solvent increased, this effect being much more pronounced with methanol. Thus, acetonitrile was selected for further work. The influence of the acetonitrile percentage on the separation of mixtures of phenols with different polarity is displayed in Fig. 7b for 25![[thin space (1/6-em)]](https://www.rsc.org/images/entities/char_2009.gif) :
:![[thin space (1/6-em)]](https://www.rsc.org/images/entities/char_2009.gif) 75, 30
75, 30![[thin space (1/6-em)]](https://www.rsc.org/images/entities/char_2009.gif) :
:![[thin space (1/6-em)]](https://www.rsc.org/images/entities/char_2009.gif) 70 or 40
70 or 40![[thin space (1/6-em)]](https://www.rsc.org/images/entities/char_2009.gif) :
:![[thin space (1/6-em)]](https://www.rsc.org/images/entities/char_2009.gif) 60 acetonitrile: phosphate buffer mobile phases. As can be observed, the retention time decreased when increasing the acetonitrile percentage. Furthermore, the best resolution was reached with 40% acetonitrile, and thus, this organic solvent content was selected for further work. Under these conditions, retention times ranged between 1.6 min (E3) and 8.9 min (DES) (Fig. 8).
60 acetonitrile: phosphate buffer mobile phases. As can be observed, the retention time decreased when increasing the acetonitrile percentage. Furthermore, the best resolution was reached with 40% acetonitrile, and thus, this organic solvent content was selected for further work. Under these conditions, retention times ranged between 1.6 min (E3) and 8.9 min (DES) (Fig. 8).
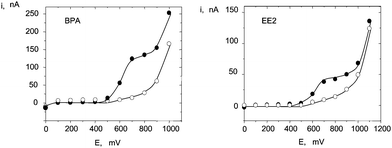 | ||
| Fig. 7 Hydrodynamic voltammograms obtained by flow injection with amperometric detection at a non-activated CFE after injection of 50-μL aliquots of (●) 1.0 × 10⁻⁵ M BPA or EE2 in 0.1 M phosphate buffer solution of pH 7.0; (○) supporting electrolyte. | ||
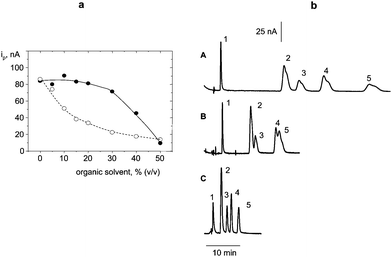 | ||
Fig. 8 (a) Influence of the organic solvent percentage on the peak current obtained by flow injection of 50 μL aliquots of 1.0 × 10⁻⁵ M OPP in acetonitrile![[thin space (1/6-em)]](https://www.rsc.org/images/entities/char_2009.gif) : :![[thin space (1/6-em)]](https://www.rsc.org/images/entities/char_2009.gif) 0.05 M phosphate buffer solution of pH 7.0 (●); methanol 0.05 M phosphate buffer solution of pH 7.0 (●); methanol![[thin space (1/6-em)]](https://www.rsc.org/images/entities/char_2009.gif) : :![[thin space (1/6-em)]](https://www.rsc.org/images/entities/char_2009.gif) 0.05 M phosphate buffer solution of pH 7.0 (○); (b) chromatographic separation of 1) E3, 2) BPA, 3) EE2, 4) OPP, 5) DES using 25 0.05 M phosphate buffer solution of pH 7.0 (○); (b) chromatographic separation of 1) E3, 2) BPA, 3) EE2, 4) OPP, 5) DES using 25![[thin space (1/6-em)]](https://www.rsc.org/images/entities/char_2009.gif) : :![[thin space (1/6-em)]](https://www.rsc.org/images/entities/char_2009.gif) 75 (A); 30 75 (A); 30![[thin space (1/6-em)]](https://www.rsc.org/images/entities/char_2009.gif) : :![[thin space (1/6-em)]](https://www.rsc.org/images/entities/char_2009.gif) 70 (B) and 40 70 (B) and 40![[thin space (1/6-em)]](https://www.rsc.org/images/entities/char_2009.gif) : :![[thin space (1/6-em)]](https://www.rsc.org/images/entities/char_2009.gif) 60 (C) acetonitrile 60 (C) acetonitrile![[thin space (1/6-em)]](https://www.rsc.org/images/entities/char_2009.gif) : :![[thin space (1/6-em)]](https://www.rsc.org/images/entities/char_2009.gif) 0.05 M phosphate buffer solutions as the mobile phase; Edet = 0.7 V vs. Ag/AgCl. 0.05 M phosphate buffer solutions as the mobile phase; Edet = 0.7 V vs. Ag/AgCl. | ||
Calibration graphs constructed for estriol (E3), BPA, 17α-ethynylestradiol (EE2), OPP and diethylstylbestrol (DES) exhibited the analytical characteristics summarized in Table 1. The detection limits were calculated according with the S/N = 3 criterion, by repetitive measurement (n = 10) of the noise between peaks (N), and using the mean peak current for each phenol solution at the lowest concentration level in the corresponding range of linearity, as the estimator for S. The LOD values ranged between 102 nM (23 ng mL−1) for BPA and 182 nM (54 ng mL−1) for EE2, thus demonstrating the suitability of the amperometric detection at the CFE for the determination of low concentrations of phenolic estrogens.
The usefulness of the developed methodology was evaluated by analyzing different water samples spiked with E3, BPA, EE2, OPP and DES at a 14 nM concentration level of each compound. Water samples were treated as described in the 2.3.5. section. Spiked underground and tap water samples were adequately stored at 4 °C, and solid phase extraction (SPE) using C18 and SDB disks was employed to extract non polar and polar or moderately polar compounds, respectively. The results obtained are summarized in Table 2. As it can be seen, recoveries were satisfactory for both types of water analyzed, thus demonstrating the suitability of the method for the determination of phenolic estrogenic compounds in these samples.
4. Conclusions
The studies performed demonstrate that CF can be used as an appropriate electrode material for amperometric detection in flowing systems. Electrochemically activated CFE can be employed to detect selectively electrochemically reducible nitrocompounds such as nitro musk derivatives. The results obtained in the analysis of incense samples by flow injection with amperometric detection at the activated CFE are similar to those found by GC-MS. Moreover, phenolic estrogenic compounds exhibited well defined electrochemical responses at non-activated CFE. Liquid chromatography with amperometric detection at the CFE can be employed for the analysis of mixtures of estrogenic compounds, the usefulness of the developed methodology being demonstrated by the good recoveries obtained in the analysis if different water samples spiked with estrogenic compounds at a 14 nM concentration level.Acknowledgements
Financial support from the Ministerio de Ciencia e Innovación (Projects DPS2008-07005-C02-01 and CTQ2009-12650) is gratefully acknowledged.5. References
- L. Agüí, P. Yáñez-Sedeño and J. M. Pingarrón, Electrochim. Acta, 2006, 51, 2565 CrossRef.
- L. Agüí, D. Vega, P. Yáñez-Sedeño and J. M. Pingarrón, Anal. Bioanal. Chem., 2005, 382, 381 CrossRef.
- T. A. Ternes, N. Herrmann, M. Bonerz, T. Knacker, H. Siegrist and A. Joss, Water Res., 2004, 38, 4075 CrossRef CAS.
- D. Barcelo and M. Petrovic, Anal. Bioanal. Chem., 2007, 387, 1141 CrossRef CAS.
- M. C. Pietrogrande and G. Basaglia, TrAC, Trends Anal. Chem., 2007, 26, 1086 CrossRef CAS.
- S. A. Rubinfeld and R. G. Luthy, Chemosphere, 2008, 73, 873 CrossRef CAS.
- J. D. Berset, P. Bigler and D. Herren, Anal. Chem., 2000, 72, 2124 CrossRef CAS.
- H. U. Kafferlein, T. Goen and J. Angerer, Crit. Rev. Toxicol., 1998, 28, 431 CrossRef CAS.
- K. Bester, J. Chromatogr., A, 2009, 1216, 470 CrossRef CAS.
- A. M. Peck, E. K. Linebaugh and K. C. Hornbuckle, Environ. Sci. Technol., 2006, 40, 5629 CrossRef CAS.
- L. Duedahl-Olesen, T. Cederberg, K. H. Pedersen and A. Hojgard, Chemosphere, 2005, 61, 422 CrossRef CAS.
- X. Zhang, Y. Yao, X. Zeng, G. Qian, Y. Guo, M. Wu, G. Sheng and J. Fu, Chemosphere, 2008, 72, 1553 CrossRef CAS.
- E. Artola-Garicano, I. Borkent, J. L. M. Hermens and W. H. J. Vaes, Environ. Sci. Technol., 2003, 37, 3111 CrossRef CAS.
- A. M. Peck and K. C. Hornbuckle, Environ. Sci. Technol., 2004, 38, 367 CrossRef CAS.
- J. A. Andresen, D. Muir, D. Ueno, C. Darling, N. Theobald and K. Bester, Environ. Toxicol. Chem., 2007, 26, 1081 CrossRef CAS.
- I. J. Buerge, H. R. Buser, M. D. Müller and T. Poiger, Environ. Sci. Technol., 2003, 37, 5636 CrossRef CAS.
- S. L. Simonich, T. W. Federle, W. S. Eckhoff, A. Rottiers, S. Webb, D. Sabaliunas and W. DeWolf, Environ. Sci. Technol., 2002, 36, 2839 CrossRef CAS.
- S. Weigel, K. Bester and H. Huehnerfuss, J. Chromatogr., A, 2001, 912, 151 CrossRef CAS.
- C. García-Jares, M. Llompart, M. Polo, C. Salgado, S. Macías and R. Cela, J. Chromatogr., A, 2002, 963, 277 CrossRef CAS.
- T. Kupper, J. D. Berset, R. Etter-Holzer, R. Furrer and J. Tarradellas, Chemosphere, 2004, 54, 1111 CrossRef CAS.
- A. M. Difrancesco, P. C. Chiu, L. J. Standley, H. E. Allen and D. T. Salvito, Environ. Sci. Technol., 2004, 38, 194 CrossRef CAS.
- H. Fromme, T. Otto, K. Pilz and F. Neugebauer, Chemosphere, 1999, 39, 1723 CrossRef CAS.
- S. L. Rice and S. Mitra, Anal. Chim. Acta, 2007, 589, 125 CrossRef CAS.
- A. Kronimus, J. Schwarzbauer, L. Dsikowitzky and S. L. Heim, Water Res., 2004, 38, 3473 CrossRef CAS.
- G. G. Rimkus, W. Butte and H. J. Geyer, Chemosphere, 1997, 35, 1497 CrossRef CAS.
- R. Gatermann, S. Biselli, H. Hühnerfuss, G. G. Rimkus, M. Hecker and L. Karbe, Arch. Environ. Contam. Toxicol., 2002, 42, 437 CrossRef CAS.
- S. M. Aschmann, J. Arey, R. Atkinson and S. L. Simonich, Environ. Sci. Technol., 2001, 35, 3595 CrossRef CAS.
- J. Regueiro, C. García-Jares, M. Llompart, J. P. Lamas and R. Cela, J. Chromatogr., A, 2009, 1216, 2805 CrossRef CAS.
- J. Regueiro, M. Llompart, C. García-Jares and R. Cela, J. Chromatogr., A, 2007, 1174, 112 CrossRef CAS.
- L. Roosens, A. Covaci and H. Neels, Chemosphere, 2007, 69, 1540 CrossRef CAS.
- P. Roveri, V. Andrisano, A. M. Di Pietra and V. Cavrini, J. Pharm. Biomed. Anal., 1998, 17, 393 CrossRef CAS.
- T. C. Tran and P. J. Marriott, Atmos. Environ., 2007, 41, 5756 CrossRef CAS.
- R. Gotti, J. Fiori, F. Mancini and V. Cavrini, Electrophoresis, 2005, 26, 3325 CrossRef CAS.
- L. I. Osemwengie and S. L. Gerstenberger, J. Environ. Monit., 2004, 6, 533 RSC.
- K. Bester, Chemosphere, 2004, 57, 863 CrossRef CAS.
- K. Bester, J. Environ. Monit., 2005, 7, 43 RSC.
- J. L. Reiner, J. D. Berset and K. Kannan, Arch. Environ. Contam. Toxicol., 2007, 52, 451 CrossRef CAS.
- I. C. Beck, R. Bruhn, J. Gandrass and W. Ruck, J. Chromatogr., A, 2005, 1090, 98 CrossRef CAS.
- R. B. Geerdink, W. M. A. Niessen and U. A. T. Brinkman, J. Chromatogr., A, 2002, 970, 65 CrossRef CAS.
- S. D. Richardson, Anal. Chem., 2002, 74, 2719 CrossRef CAS.
- N. Yoshiota, Y. Akiyama and K. Teranishi, J. Chromatogr., A, 2004, 1022, 145 CrossRef CAS.
- R. D. Thompson, J. AOAC Int., 2001, 84, 815 CAS.
- B. Saad, N. H. Haniff, M. I. Saleh, N. H. Hashim, A. Abu and N. Ali, Food Chem., 2004, 84, 313 CrossRef CAS.
- K. Inoue, K. Kato, Y. Yoshimura, T. Makino and H. Nakazama, J. Chromatogr., B, 2003, 749, 17 CrossRef.
- A. Peñalver, E. Pocurull, F. Borrull and R. M. Marcé, J. Chromatogr., A, 2002, 964, 153 CrossRef CAS.
- M. M. Ngundi, O. A. Sadik, T. Yamagushi and S.-I. Suye, Electrochem. Commun., 2003, 5, 61 CrossRef CAS.
- H. Kuramitz, Y. Nakata, M. Kawasaki and S. Tanaka, Chemosphere, 2001, 45, 37 CrossRef CAS.
- H. Kuramitz, M. Matsushita and S. Tanaka, Water Res., 2004, 38, 2331 CrossRef CAS.
- H. Kuramitz, J. Saitoh, T. Hattori and S. Tanaka, Water Res., 2002, 36, 3323 CrossRef CAS.
- D. Vega, L. Agüí, P. Yáñez-Sedeño and J. M. Pingarrón, Talanta, 2007, 71, 1031 CrossRef CAS.
- M. Cargouët, D. Perdiz, A. Mouatassim-Souali, S. Tamisier-Karolak and Y. Levi, Sci. Total Environ., 2004, 324, 55 CrossRef CAS.
- L. J.Núñez-Vergara, M. Bonta, P. A. Navarrete-Encina and J. A. Squella, Electrochim. Acta, 2001, 46, 4289 CrossRef.
- L. Agüí, A. Guzmán, P. Yáñez-Sedeño and J. M. Pingarrón, Anal. Chim. Acta, 2002, 461, 65 CrossRef CAS.
- A. Guzmán, L. Agüí, M. Pedrero, P. Yáñez-Sedeño and J. M. Pingarrón, Electroanalysis, 2004, 16, 1763 CrossRef CAS.
- K. Bratin, P. T. Kissinger, R. C. Briner and G. S. Brunlett, Anal. Chim. Acta, 1981, 130, 295 CrossRef CAS.
- J. Wang, S. B. Hocevar and B. Ogorevc, Electrochem. Commun., 2004, 6, 176 CrossRef CAS.
- K. C. Honeychurch, J. P. Hart, P. R. J. Pritchard, S. J. Hawkins and N. M. Ratcliffe, Biosens. Bioelectron., 2003, 19, 305 CrossRef CAS.
- J. Wang, F. Lu, D. MacDonald, J. Lu, M. E. S. Ozsoz and K. K. Rogers, Talanta, 1998, 46, 1405 CrossRef CAS.
- J. Wang, R. K. Bhada, J. Lu and D. Mac Donald, Anal. Chim. Acta, 1998, 361, 85 CrossRef CAS.
- J. A. Zimmermann, J. M. Ballard, H. Wang, A. Wu and K. A. Gallager, Int. J. Pharm., 2003, 267, 113 CrossRef.
- J. B. Quintana, J. Carpinteiro, I. Rodríguez, R. A. Lorenzo, A. M. Carro and R. Cela, J. Chromatogr., A, 2004, 1024, 177 CrossRef CAS.
- C. Li, X. Z. Li, N. Graham and N. Y. Gao, Water Res., 2008, 42, 109 CrossRef CAS.
- M. Petrovic, E. Eljarrat, M. J. L. de Alda and D. Barceló, TrAC, Trends Anal. Chem., 2001, 20, 637 CrossRef CAS.
| This journal is © The Royal Society of Chemistry 2010 |
