Simultaneous electrochemical detection of carcinogenic polycyclic aromatic amines in environmental samples using single-walled carbon nanotube-gold nanoparticle composite
Sini
George
and
Hian Kee
Lee
*
Department of Chemistry, National University of Singapore, 3 Science Drive 3, Singapore 117543. E-mail: chmleehk@nus.edu.sg
First published on 2nd February 2010
Abstract
A nanocomposite was prepared using single walled carbon nanotubes (SWCNTs) and thiol-derivatised gold nanoparticles (Aunano). Transmission electron microscopy (TEM) image of the nanocomposite showed that the Aunano were self-assembled on to the side walls of the SWCNTs after the modification process. Moreover, from the TEM analysis, it was clear that the likelihood of agglomeration of these nanoparticles in the nanocomposite were rare. A film of the nanocomposite was then applied on a glassy carbon electrode (GCE). The nanocomposite modified GCE was used for the electrochemical detection of several carcinogenic polycyclic aromatic amines (PAAs) simultaneously. The combination of the adsorptive properties of SWCNTs with an enhanced electroactive surface area, electrical conductivity of Aunano, together with the interaction of the amino group of the analytes and Aunano permitted very efficient detection of the analytes. Preconcentration and detection of the analytes in the real samples could be achieved in a single step using adsorptive stripping voltammetry (ASV). ASV for the PAAs achieved detection limits in the range of 1 μg L−1 (using 9,10-diaminophenanthrene as an example), with linearity up to 3 orders of magnitude. Moreover, the nanocomposite modified electrode exhibited excellent selectivity with high reproducibility towards several PAAs and resulted in their simultaneous and sensitive detection with detection limits in the μg L−1 range. Using 9,10-diaminophenanthrene as an example, the reproducibility of the analyte signal in the simultaneous detection of several PAAs was determined to be within 5% (n = 8) from one electrode preparation to another, and the response signal was stable (±4.5% at 95% confidence interval) for 15 repeated analyses with 600 s of preconditioning. Applicability of the procedure to tap water, river water, and wastewater samples was demonstrated. Such nanocomposite devices hold great promise for convenient and sensitive environmental screening of carcinogenic PAAs.
1. Introduction
Polycyclic aromatic amines (PAAs) have been proven to produce tumors in experimental animals in a wide variety of tissues including liver, urinary bladder, small intestine, Zymbal's gland, subcutaneous tissue or skin. In man, exposure to some PAAs is associated with tumors of the urinary bladder and carcinoma of the renal pelvis.1 Because of their toxicological significance, PAAs are included in the United States Environmental Protection Agency list of priority pollutants.2 It is therefore imperative to assess proper means of identification and detection of PAAs in environmental matrices. Such assays are commonly carried out in laboratories using various separation techniques.3,4 However, in view of the lengthy analysis time, and cost of laboratory-based chromatographic analyses, there is considerable interest for fast and cheaper alternative techniques for environmental screening of PAAs. These compounds are amenable to anodic oxidation on suitable electrodes. This fact was exploited for electrochemical detection of PAAs in various environmental matrices5–14 However, these techniques are not sufficiently sensitive and selective for trace environmental analysis of these compounds. Therefore, there are growing needs for innovative techniques for these environmental mutagens.Metal nanoparticles are increasingly used in many electrochemical, electroanalytical and bioelectronic applications owing to their extraordinary electrocatalytic activity.15–19 Willner's group explored the possible utilization of gold nanoparticles (Aunano) for sensing, and optical applications.20 The catalytic activity of these nano-sized particles was linked to a band gap of a metallic–insulator transition in the low nanometre range, high surface area and interface-dominated properties that differ from those of the bulk materials.15–17 The modification of electrode surfaces with redox-active metal nanoparticles has led to the development of various electrochemical sensors. The catalytic properties of metal nanoparticles could decrease overpotentials characteristic of some analytically important electrochemical reactions and even provide electrochemical reversibility for redox reactions, which are irreversible at bulk metal electrodes.18–24 For example, selective electrochemical analysis of dopamine and ascorbic acid was achieved on a gold (Au) electrode functionalized with a monolayer of Aunano due to a catalytic effect of the these nanoparticles on the ascorbic acid oxidation.23 Aunano self-assembled on a sol–gel derived three-dimensional silicate network was found to efficiently catalyze the oxidation of NADH in the absence of any electron transfer mediators with a decrease in overpotential in neutral solution.24
ASV is an excellent technique for the determination of chemical species at trace levels, and also for speciation studies. An increase in sensitivity (and a lower detection limit) can be achieved by the utilization of a pre-concentration step that accumulates the electroactive species on the electrode surface before its quantitative determination can be carried out by control of applied current or applied potential, or at an open circuit. ASV has been shown to be highly suitable for measuring organic compounds (including cardiac or anticancer drugs, nucleic acids, vitamins, or pesticides) that exhibit surface active properties. Depending on their redox activity, the quantitation of the adsorbed organic compounds may proceed, through oxidation or reduction.25
The role of carbon nanotubes (CNTs) in electroanalytical chemistry, properties such as a high electronic conductivity and a high mechanical resistance have driven an impressive research effort in electroanalytical applications in recent years.26–28 Incorporation of nanoparticles to CNTs electrode matrices has been demonstrated to enhance the electrocatalytic efficiency of many electrochemical processes giving rise to several significant applications.29–34 Au electrode modified with Aunano and CNTs was used to detect and determine cytochrome c.32 Copper nanoparticles together with single-walled carbon nanotubes (SWCNTs) solubilized in nafion have been used to form nanocomposite for electrochemical detection of trinitrotoluene and several other nitroaromatics.35
In this article, a combination of SWCNTs and Aunano were used to form a nanocomposite to modify a GCE to improve electroactivity and selectivity for carcinogenic PAAs. To the best of our knowledge, electrochemical detection of carcinogenic PAAs using incorporated Aunano on SWCNTs has not been reported so far. With the combination of excellent adsorptive properties of SWCNTs with an enhanced electroactive surface area, electrical conductivity of Aunano together with the interaction of the amino group of the analytes and Aunano,36 we have achieved, for the first time, the simultaneous electrochemical detection of several PAAs. Aunano were in electrical contact, through the SWCNTs, with the GCE backing, enabling the composite structure to be used as an electrode.37 The performance of the resulting electrode with respect to sensitivity, linear range, and selectivity toward several PAAs was evaluated and is discussed. The applicability of the GCE modified by the nanocomposite was demonstrated for simultaneous analysis of PAAs in tap water, river water, and municipal wastewater.
2. Experimental
2.1. Materials
SWCNTs (90% purity, diameter <2 nm, length 5–15 μm) were purchased from Shenzhen Nanotech Port Co., Ltd. (Nanshan, China). Hydrogen tetrachloroaurate (HAuCl4), tetraoctyl ammonium bromide, dodecanethiol, sodium borohydride, 2-aminonaphthalene (Catalog No. N8381), 9,10-diaminophenanthrene (Catalog No. and 2-aminobiphenyl (Catalog No. 07110) were obtained from Sigma-Aldrich (Singapore). All chemicals were used as received and ultrapure water (18.2 MΩ) from a Millipore Alpha-Q purification system (Millipore Corporation, Bedford, MA, USA) was used in all experiments. River water samples were taken from the Ulu Pandan River, Singapore. Wastewater samples were collected from a municipal wastewater treatment plant in Singapore. The samples were protected from light and stored at 4 °C.2.2. Safety considerations
In view of their toxicity PAAs should be handled with special care. Long-term exposure to different derivatives can cause cancer, and the vapor of these chemicals is also dangerous. Stock solutions of these chemicals must be prepared in a fume hood while being handled extremely carefully. Since such compounds can be easily absorbed through the skin, any skin contact must be avoided.2.3. Sample preparation
Stock solutions of the PAAs (1000 mg L−1) were prepared in dimethyl formamide. Analyte solutions were prepared daily by dilution of the stock solutions in 20 mM Britton-Robinson (B-R) buffer, pH 1.5, and protected from light and stored at 4 °C. Water samples (tap water, river water, and wastewater) were used without any pretreatment.2.4. Preparation of Aunano/SWCNT nanocomposite and modification of GCE
Prior to use, the GCE was immersed in concentrated H2SO4 for 10 min. The electrode was then polished with an alumina (0.3 μm)/water slurry on a polishing cloth (Kemet, Singapore) to obtain a mirror finish, after which it was ultrasonicated for 5 min in ultrapure water. It was thoroughly rinsed with water, and dried with a flow of nitrogen gas.Aunano were prepared as reported earlier.38 Briefly, an aqueous solution of HAuCl4 (30 mL, 30 mM) was mixed with a solution of tetraoctylammonium bromide in toluene (80 mL, 50 mM). The two-phase mixture was vigorously stirred until all the HAuCl4 was transferred into the organic layer and dodecanethiol (l70 mg) was then added to the organic phase. A freshly prepared aqueous solution of sodium borohydride (25 mL, 0.4 M) was slowly added with vigorous stirring. After further stirring for 3 h, the organic phase was separated, evaporated to 10 mL in a rotary evaporator and mixed with 400 mL ethanol to remove excess thiol. The mixture was kept for 4 h at ∼18 °C and the dark brown precipitate was filtered off and washed with ethanol. The crude product was dissolved in 10 mL of toluene, precipitated again with 400 mL of ethanol, protected from light, and stored at 4 °C.
SWCNTs (final concentration 0.5–2.0 mg mL−1) were added to 1 mL of dodecanethiol stabilized Aunano (0.02–0.1 μM) in toluene, and sonicated for 12 h. One drop (5 μL) of the dissolved nanocomposite was placed on the GCE. The droplet was carefully manipulated to just cover the entire electrode surface, and was dried for 10 min in an oven at 80 °C, which resulted in the formation of a uniform film consisting of a network of SWCNTs and Aunano, termed herein as GC/Aunano/SWCNT electrode.
2.5. Instrumentation
Transmission electron microscopy (TEM) was performed using a JEOL (Tokyo, Japan) JEM 3010 HRTEM instrument equipped with an Oxford Instruments (High Wycombe, UK) Energy Dispersive X-ray (EDX) spectrometer with silicon drift detector (INCAx-sight). Samples were dropped on a holey carbon film, 300 mesh copper grid and allowed to dry in air. The uniformity, thickness, and integrity of the modified GCE surfaces were examined by scanning electron microscopy imaging (JEOL JSM-5200). Raman spectra of SWCNTs or Aunano/SWCNT nanocomposite were acquired by a Renishaw (Wotton-under-Edge, UK) 2000 Raman spectrometer equipped with a 514 nm laser and a charge-coupled device detector to provide direct 2-D Raman imaging and Raman spectra. Raman spectra of SWCNTs or Aunano/SWCNT nanocomposite deposited on the GCEs were obtained by using a custom-made adapter to align the electrode perpendicularly under the laser beam. Electrochemical experiments were performed using a μ-Autolab potentiostat/galvanostat type II instrument (Utrecht, The Netherlands) equipped with a model 728 magnetic stirrer, Metrohm (Herisau, Switzerland). Cyclic voltammetry (CV) and linear sweep voltammetry (LSV) methods were used for the electrochemical studies. The electrochemical measurements were carried out in a single-compartment, three-electrode glass cell. The reference electrode was Ag/AgCl [saturated potassium chloride, (KCl)] and the counter electrode was a platinum disk electrode (3 mm in diameter). The working electrodes were bare GCE, Au electrode, and GC/SWCNT and GC/Aunano/SWCNT electrodes (each 3 mm in diameter). The electrochemical cell volume was 10 mL, and all measurements were performed at room temperature. CV and LSV scans were conducted at a scan rate of 100 mV s−1 between 0 mV to 1200 mV. A 20 mM B-R buffer was used as the electrolyte and phosphoric acid or sodium hydroxide were used to adjust the pH. pH measurements were performed on a Hanna Instruments (Ann Arbor, MI, USA) 8417 pH meter.2.6. Electrochemical detection of PAAs
The electrochemical measurement consisted of two consecutive steps: (i) preconcentration of the analytes from the stirred solution to the electrode poised at 0.0 V vs. Ag/AgCl35 and (ii) oxidative stripping using LSV/detection at 100 mV s−1. Aromatic amines are very easy to oxidize and usually anode potentials of 500–1500 mV vs. saturated calomel electrode are adequate to oxidize them. The anodic oxidation of these compounds presumably produces a cation radical (Scheme 1). Coupling reactions and deprotonation of the radical species are likely occurrences. Often dimers are formed via C–C, C–N and N–N bonds, which are more easily oxidized than the starting aromatic monomers because of the enhanced charge delocalization in the dimer intermediates.39–41 In general, for sensitive detection of such aromatic amines, the selected electrode material must have good adsorptive characteristics, efficient electron transfer in the stripping/detection step, and low and stable background current. | ||
| Scheme 1 Oxidation of aromatic amines. | ||
3. Results and discussion
3.1. Characterization of the electrodes
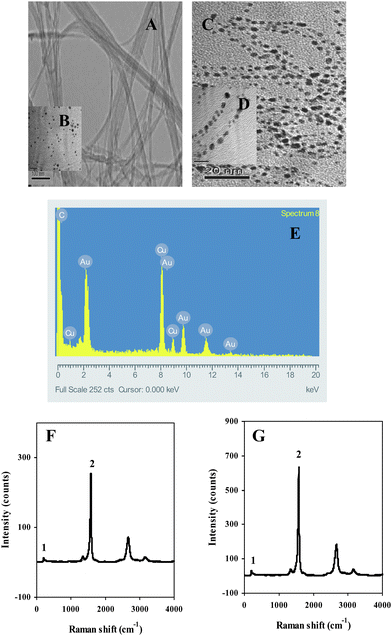 | ||
| Fig. 1 (A) TEM image of the untreated SWCNTs, (B) TEM image of Aunano, (C) TEM image of Aunano/SWCNT nanocomposite, (D) high (5×) magnification TEM image of Aunano/SWCNT nanocomposite, (E) EDX analysis showing the presence of Au in the nanocomposite, (F) Raman signature of GC/SWCNT electrode, (G) Raman signature of GC/Aunano/SWCNT electrode. Peak characteristics: radial breathing mode at 184 cm−1 and high energy mode at 1575 cm−1. | ||
The Raman measurements were performed directly on the modified GCEs with 8 repeated measurements at several different spots. Two typical Raman characteristics of SWCNTs were examined for the GC/SWCNT electrode: the radial breathing mode at 184 cm−1 (peak 1) and the high-energy mode at 1575 cm−1 (peak 2) with mean values of 17 ± 8 and 276 ± 56, (n = 8, at 95% confidence interval), respectively (Fig. 1F). The mean values for 8 measurements obtained for the GC/Aunano/SWCNT electrode were significantly higher: 38 ± 15 for peak 1 and 621 ± 37, (n = 8, at 95% confidence interval) for peak 2 (Fig. 1G). The intensified Raman signature on the GC/Aunano/SWCNT electrode could be attributed to the amplification effect of Aunano, a phenomenon known as surface-enhanced Raman scattering.42 These results again confirmed the presence of Aunano on SWCNTs.
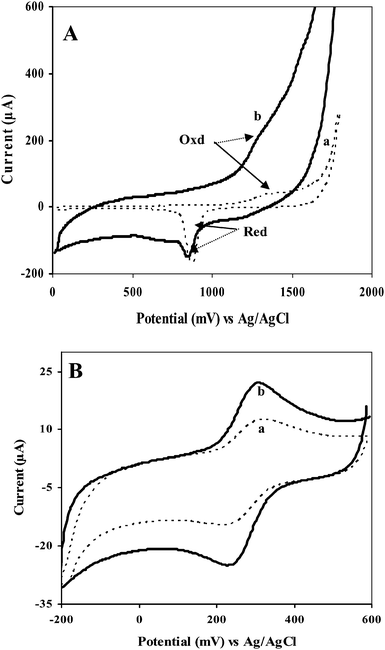 | ||
| Fig. 2 (A) CVs of (a) bare Au electrode, and (b) GC/Aunano/SWCNT electrode in 0.5 M H2SO4 at scan rate 50 mV s−1. (B) Comparison of electroactive surface area by CV in 1 mM Fe(CN)63− and 1 M KCl at 50 mV s−1vs. Ag/AgCl: (a) GC/SWCNT electrode and (b) GC/Aunano/SWCNT electrode. | ||
Fig. 2B shows steady-state CVs of the GC/SWCNT (curve a) and the GC/Aunano/SWCNT (curve b) electrodes in 1 mM Fe(CN)63− and 1 M KCl at 50 mV s−1. The well-defined oxidation and reduction peaks due to the Fe(CN)63−/Fe(CN)64− redox couple were observed at 326 and 224 mV at the GC/SWCNT electrode and at 314 and 241 mV at the Aunano/SWCNT-modified GC electrode. The GC/Aunano/SWCNT electrode exhibited a much higher electroactive surface area, as estimated by the Randles-Sevcik equation44
| Ip = 2.69 × 10⁵AD½n3/2ν1/2C |
3.2. Detection of PAAS
Fig. 3 shows the detection of PAAS at the various electrodes. For all the PAAs at the given concentrations tested, virtually no response could be discerned except for 9,10-diaminophenanthrene (Fig. 3B(a), 3D(a) and 3F(a)) at the bare GCE in the given potential window. In the case of 9,10-diaminophenanthrene, a small peak was obtained (Fig. 3B(a)) but it made little contribution to the observed peak at the GC/SWCNT and at the GC/Aunano/SWCNT electrodes. As expected, these compounds displayed adsorptive stripping response at the GC/SWCNT electrode. However, the corresponding signals at the GC/Aunano/SWCNT electrode are significantly higher. Moreover, in the case of the GC/SWCNT electrode, an elevated background current was observed during the potential scan for all the PAAs, masking the appearance of the oxidation peaks of the PAAS.35 However, such an effect was much less pronounced at the GC/Aunano/SWCNT electrode. Evidently, the background current was stable and lower when Aunano was present in the nanocomposite. Also, note that in the absence (Fig. 3C, curve b) and in the presence of PAAs, at both the GC/SWCNT and GC/Aunano/SWCNT electrodes, there is an unknown peak at about 350 mV; this may be possibly due to the oxidation of some impurities on the SWCNTs.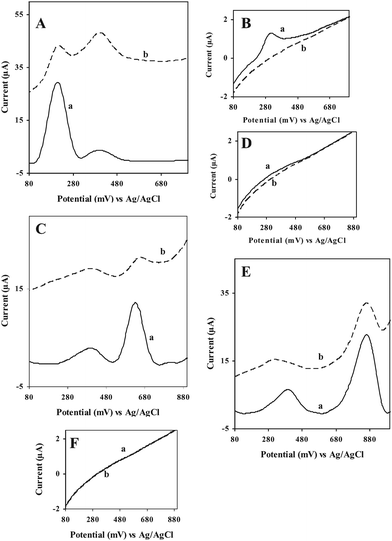 | ||
| Fig. 3 ASV response for (A) 9,10-diaminophenanthrene, 50 μg L−1, (C) 2-aminonaphthalene, 40 μg L−1 and (E) 2-aminobiphenyl, 30 μg L−1 at (a) GC/Aunano/SWCNT (b) GC/SWCNT and (B(a)), (D(a)), and (F(a)) ASV response for 9,10-diaminophenanthrene, 50 μg L−1, 2-aminonaphthalene, 40 μg L−1 and 2-aminobiphenyl, 30 μg L−1 respectively at bare GCE in 20 mM B-R buffer, pH 1.5 at 0 V vs. Ag/AgCl; scan rate, 100 mV s−1, preconcentration time, 600 s. | ||
Fig. 4 displays the dependence of the LSV peak response of the GC/Aunano/SWCNT electrode on the preconcentration time for different PAAs. The significance of the electrode preconditioning time on the oxidative stripping voltammetric peaks for the analysis of 120 μg L−1 of the PAAs can be clearly understood from the figure. Without preconcentration, almost all compounds were virtually undetected at 120 μg L−1. The response of the modified electrode toward all six compounds increases rapidly with time at first and then slowly, indicating appreciable adsorption. Although shorter preconditioning times might provide faster analysis, longer times yield greater sensitivity, and a preconditioning time of 600 s was considered as a good compromise.
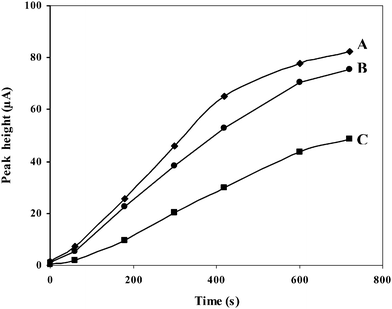 | ||
| Fig. 4 Effect of preconcentration time on the peak heights for 120 μg L−1 (A) 9,10-diaminophenanthrene, (B) 2-aminobiphenyl, (C) 1,2-diaminoanthraquinone, (D) 1-aminopyrene, (E) 2-aminoanthracene, and (F) 2-aminonaphthalene at GC/Aunano/SWCNT electrode in 20 mM B-R buffer, pH 1.5 at 0 V vs. Ag/AgCl; scan rate 100 mV s−1. | ||
Fig. 5 displays calibration data for different PAAs at the GC/Aunano/SWCNT electrodes in 20 mM B-R buffer, pH 1.5 at 0 V vs. Ag/AgCl. The 600 s preconcentration time resulted in well-defined peaks for the concentration ranges examined. The response for 9,10-diaminophenanthrene (A), 2-aminonaphthalene (B) and 2-aminobiphenyl (C) increases linearly over the entire ranges tested. For instance, for 9,10-diaminophenanthrene (A), and 2-aminobiphenyl (C) the calibration curves have the highest slopes and correlation coefficients of (638.6 ± 80 nA μg−1 L−1, 0.9998), and (632.5 ± 30 nA μg−1 L−1, 0.9999) respectively at 95% confidence interval (n = 5). On the other hand, for 2-aminonaphthalene, the calibration curve yielded slope and correlation coefficient (315 ± 60 nA μg−1 L−1, 0.9996) at 95% confidence interval (n = 5). Detection limits around 1 μg L−1 for 9,10-diaminophenanthrene (A) and aminobiphenyl (C) and around 2 μg L−1 for 2-aminonaphthalene (B) could be obtained at a signal to noise ratio of 3. Comparing the literature values, the detection limits of these PAAs determined here are, as far as we are aware, among the lowest reported.5a, 13,14,
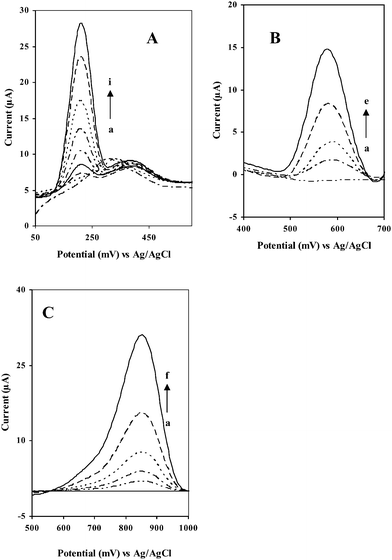 | ||
| Fig. 5 ASV response for (A) 9,10-diaminophenanthrene (a) 50 (b) 40 (c) 30 (d) 20 (e) 10 (f) 5 (g) 2 (h) 1 and (i) 0 μg L−1, (B)) 2-aminonaphthalene (a) 50, (b) 20, (c) 10, (d) 5 and (e) 0 μg L−1, and (C) 2-aminobiphenyl (a) 50 (b) 20 (c) 10 (d) 5 (e) 2 and (f) 0 μg L−1. at GC/Aunano/SWCNT electrode in 20 mM B-R buffer, pH 1.5 at 0 V vs. Ag/AgCl; scan rate, 100 mV s−1, preconcentration time, 600 s. | ||
3.3. Simultaneous detection of PAAs
The detection of the PAAs in real samples (e.g., environmental matrix samples) gives rise to mutual interferences because of overlapping oxidation peaks. Because of this, simultaneous determination requires a separation step.3,4 In some cases, chemically modified electrodes have been used for the selective determination of one PAA at a time.5,8,13,14 The ability of the GC/Aunano/SWCNT electrode towards the effective separation of the oxidative potentials of PAAs, thus allowing their selective electrochemical analysis, was tested. The GC/Aunano/SWCNT electrode showed excellent selectivity towards these three analytes, 9,10-diaminophenanthrene, 2-aminonaphthalene and 2-aminobiphenyl. Here, because of the combination of excellent adsorptive properties of SWCNTs with an enhanced electroactive surface area, electrical conductivity of Aunano together with the interaction of the amino group of the analytes and Aunano, a good opportunity arises that allows the simultaneous determination of the PAAs (Fig. 6A(a)). It should be mentioned here that such simultaneous detection of PAAs, as far as we are aware, has not been reported in the literature so far. Previous works on the direct electrochemical detection of these PAAs13,14 reported only separate, and not simultaneous measurements. Again, as expected, these compounds displayed adsorptive stripping response at the GC/SWCNT electrode. However, the corresponding signals at the GC/Aunano/SWCNT electrode are significantly higher. Moreover, in the case of the GC/SWCNT electrode, an elevated background current was observed during the potential scan for all the PAAs, masking the appearance of the oxidation peaks of the PAAS (Fig. 6A(b)). At the bare GCE no extra peaks were found except that of 9,10-diaminophenanthrene (Fig. 6B(a)).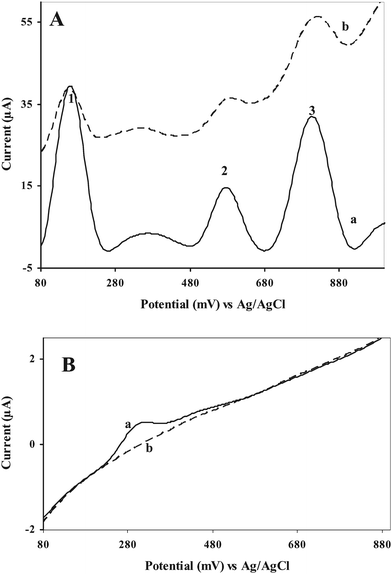 | ||
| Fig. 6 Simultaneous detection of 9,10-diaminophenanthrene (peak 1), 2-aminonaphthalene (peak 2), and 2-aminobiphenyl (peak 3), 100 μg L−1 each at (A) (a) GC/Aunano/SWCNT and (b) GC/SWCNT and (B) bare GCE at 0 V vs. Ag/AgCl in 20 mM B-R buffer, pH 1.5; scan rate, 100 mV s−1, preconcentration time, 600 s. | ||
3.4. Analytical characteristics for the simultaneous detection of 9,10-diaminophenanthrene, 2-aminonaphthalene, and 2-aminobiphenyl
For improving stable background current and noise, and for good sensitivities and separation, 20 mM B-R buffer at three different pH were used, 1.5, 5.5 and 9.5. The best signal-to-noise ratio, separation of peaks, and the most intense peaks, especially at the lower μg L−1 range were obtained at pH 1.5 (Fig. 7, curve a). This might be due to the ease of the formation of the cation radical (previously explained in Scheme 1) under the acidic pH. Oxidation peaks of 9,10-diaminophenanthrene, 2-aminonaphthalene, and 2-aminobiphenyl are 162 mV, 585 mV, 812 mV respectively in 20 mM B-R buffer, pH 1.5; 100 mV s−1, 600 s preconcentration time at 0.0 V vs. Ag/AgCl. As the pH increases, the peaks are shifted towards less positive potentials. This trend might be due to the lower availability of hydrogen ion for the formation of the cation radical during the oxidation of amines.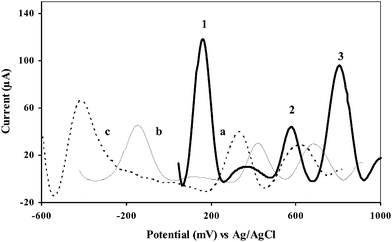 | ||
| Fig. 7 pH effect on voltammetric response for the simultaneous detection of 9,10-diaminophenanthrene (peak 1), 2-aminonaphthalene (peak 2), and 2-aminobiphenyl (peak 3), 300 μg L−1 each at the GC/Aunano/SWCNT electrode at 0 V vs. Ag/AgCl; scan rate, 100 mV s−1, preconcentration time, 600 s, in 20 mM B-R buffer, pH (a) 1.5, (b) 5.5, and (c) 9.5. | ||
Fig. 8 displays the analytical performance of the GC/Aunano/SWCNT electrode in the simultaneous electrochemical detection of 9,10-diaminophenanthrene, 2-aminonaphthalene, and 2-aminobiphenyl by ASV. A linear peak response towards concentration of the analytes was obtained during the simultaneous detection of these analytes. Slope and correlation coefficient for the linear response curve for 9,10-diaminophenanthrene, 2-aminonaphthalene, and 2-aminobiphenyl respectively were (320.9 ± 40 nA μg−1 L−1, 0.9999), (164.2 ± 60 nA μg−1 L−1, 0.9981) and (312.7 ± 90 nA μg−1 L−1, 0.9984) at 95% confidence interval (Fig. 9). Detection limits around 5 μg L−1 for 9,10-diaminophenanthrene and aminobiphenyl and around 20 μg L−1 for 2-aminonaphthalene could be obtained when signal to noise ratio is 3.
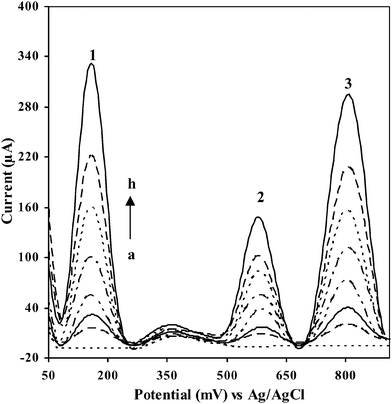 | ||
| Fig. 8 Performance of GC/Aunano/SWCNT electrode in simultaneous electrochemical detection of 9,10-diaminophenanthrene (peak 1), 2-aminonaphthalene (peak 2), and 2-aminobiphenyl (peak 3) by ASV (electrolyte: 20 mM B-R buffer, pH 1.5; 100 mV s−1, 600 s preconcentration time at 0.0 V vs. Ag/AgCl): (a) 1000, (b) 700, (c) 500, (d) 300, (e) 200, (f) 100, (g) 50, and (h) 0 μg L−1. | ||
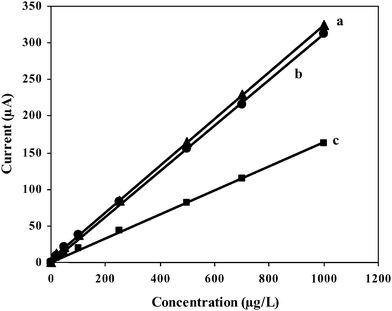 | ||
| Fig. 9 Set of calibration plots for the simultaneous electrochemical detection of (a) 9,10-diaminophenanthrene, (b) 2-aminonaphthalenene and (c) 2-aminobiphenyl by ASV; 20–1000 μg L−1. | ||
The reproducibility of the GC/Aunano/SWCNT electrode was examined by eight different electrode preparations. The simultaneous electrochemical detection of a solution containing 250 μg L−1 each of 9,10-diaminophenanthrene, 2-aminonaphthalene, and 2-aminobiphenyl by ASV yielded an average peak current of 80 ± 1.5 μA (using the signal of 9,10-diaminophenanthrene as an example). The reproducibility of the analyte signal in the simultaneous detection of several PAAs was determined to be within 5% (n = 8) from one electrode preparation to another. Excellent reproducibility was also obtained using the same electrode for 15 repeated analyses of a solution containing 250 μg L−1 each of these three analytes, with an average peak current of 76 ± 1.9 μA (using the signal of 9,10-diaminophenanthrene as an example). The response signal was stable (±4.5% at 95% confidence interval) for 15 repeated analyses with 600 s of preconditioning. The GC/Aunano/SWCNT electrode was kept in the blank solution prior to use for approximately 10 min, followed by 5–10 scans in the blank solution, permitted a fast and simple surface renewal.
Electrode stability is an important consideration in the development of an electrochemical sensor. For the present case, the GC/Aunano/SWCNT electrode was stored in the blank solution at ambient conditions and it was found to be stable for 1 month or more. As an indicator of its stability, we tracked the performance of a GC/Aunano/SWCNT electrode over a period of 1 month with the simultaneous electrochemical detection of a solution containing 250 μg L−1 each of 9,10-diaminophenanthrene, 2-aminonaphthalene, and 2-aminobiphenyl in 20 mM B-R buffer, pH 1.5 by ASV, every 2–5 days. A total of 13 measurements of current were taken, which gave a relative standard deviation of 5.65% (using the signal of 9,10-diaminophenanthrene as an example).
3.5. Simultaneous detection of PAAs in different matrix samples
The applicability of the present method to relevant environmental samples, is illustrated in Fig. 10, which shows the simultaneous detection of 9,10-diaminophenanthrene, 2-aminonaphthalene, and 2-aminobiphenyl by ASV. The tap water, river water and wastewater samples were used directly to prepare the buffer solution without filtering or any pretreatment35 and to all the samples, the three analytes were added to give final concentrations of 20 μg L−1 of each. The characteristic oxidation potentials for 9,10-diaminophenanthrene, 2-aminonaphthalene, and 2-aminobiphenyl in all the three samples analyzed remained more or less the same (Fig. 10). In the case of tap water and river samples, peak heights of all the three analytes remained more or less the same. However, in the case of the municipal wastewater sample, there is a pronounced increase in the peak heights of all the three analytes compared to the other water samples. Yet, comparison to the sensitivities towards the standard solutions (Fig. 8) indicates a somewhat lower sensitivity. Such an observation is attributed to the influence of the matrix constituents. Proper calibration in the relevant sample matrix would be required to address this effect. Note again the presence of an unknown peak at about 350 mV. An additional flat peak at about 450 mV can be seen in the case of tap water and river water samples. This might be possibly due to the presence of some other electroactive compound present in these matrix samples.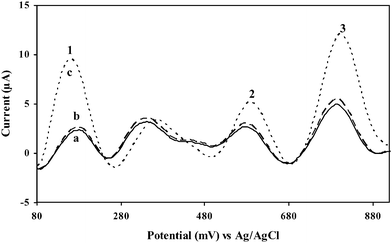 | ||
| Fig. 10 Simultaneous electrochemical detection of 9,10-diaminophenanthrene (peak 1), 2-aminonaphthalene (peak 2), and 2-aminobiphenyl (peak 3) (all at concentrations of 20 μg L−1) by ASV (scan rate 100 mV s−1, 600 s preconcentration time at 0.0 V vs. Ag/AgCl) with different samples adjusted to 20 mM B-R buffer, pH 1.5; (a) tap water, (b) Ulu Pandan river water sample, and (c) municipal wastewater. | ||
4. Conclusions
In summary, a nanocomposite containing SWCNTs and thiol-derivatised Aunano was used to modify a GCE. TEM image of the nanocomposite showed that the Aunano were self-assembled on to the side walls of the SWCNTs after the modification process. Moreover, from the TEM analysis, it was clear that the likelihood of agglomeration of these nanoparticles in the nanocomposite were rare. The modified electrode yielded superior electrochemical signals for several PAAs. To demonstrate the selectivity of the nanocomposite modified electrode towards the different PAAs considered, resulted in their simultaneous detection with detection limits in the μg L−1 range. The two major contributing factors to these observations were the combination of excellent adsorptive properties of SWCNTs with an enhanced electroactive surface area, electrical conductivity of Aunano together with the interaction of the amino group of the analytes and Aunano. Even without any sample pretreatment, the GC/Aunano/SWCNT electrode exhibited very good reproducibility and stability. In general, with excellent detection limits in the range of low μg L−1 concentration, the proposed system is useful for the simultaneous detection of these carcinogens in water treatment facilities, seawater, and drinking water.Acknowledgements
The authors gratefully acknowledge financial support from the National University of Singapore.References
- (a) Environmental Carcinogens: Selected Methods of Analysis: Volume 4, Some Aromatic Amines and Azo Dyes in the General and Industrial Environment, 40; International Agency for Research on Cancer; Lyon, France, 1981 Search PubMed; (b) A. Borza, S. Plottner, A. Wolf, C. Behm, S. Selinski, J. G. Hengstler, P. H. Roos, H. M. Bolt and J. Kuhlmann, Arch. Toxicol., 2008, 82, 973 CrossRef CAS.
- Fed. Regist. 1979, 44, p. 69464 Search PubMed.
- (a) Q. Zhou, X. Zhang and J. Xiao, J. Chromatogr., A, 2009, 1216, 4361 CrossRef CAS; (b) P. A. Guy, E. Gremaud, J. Richoz and R. J. Turesky, J. Chromatogr., A, 2000, 883, 89 CrossRef CAS.
- E. Barcelo-Barrachina, E. Moyano and M. T. Galceran, J. Chromatogr. A, 2004, 1054, 409 CAS.
- (a) A. Ferancová, M. Bucková, E. Korgová, O. Korbut, P. Gründler, I. Wämmark, R. Štepán, J. Barek, J. Zima and J. Labuda, Bioelectrochemistry, 2005, 67, 191 CrossRef CAS; (b) J. Barek, A. Berka, M Müller and Zima, J. Collect. Czech. Chem. Commun, 1985, 50, 2853 Search PubMed.
- J. Barek, V. Mejstrík, A. Muck and J. Zima, Crit. Rev. Anal. Chem., 2000, 30, 37 CrossRef CAS.
- J. Barek, A. Berka and Z. Tocksteinová, Talanta, 1986, 33, 811 CrossRef CAS.
- J. Cvăcka, F Opekar, J. Barek and J. Zima, Electroanalysis, 2001, 13, 799 CrossRef CAS.
- R. I. Riggin and C. C. Howard, Anal. Chem., 1979, 51, 210 CrossRef CAS.
- J. Barek, V. Pacáková, K. Štulík and J. Zima, Talanta, 1985, 32, 279 CrossRef CAS.
- J. R. Rice and P. T. Kissinger, J. Anal. Toxicol., 1979, 3, 64 CAS.
- D. N. Armentrout and J. Cutie, J. Chromatogr. Sci., 1980, 18, 370 CAS.
- J. Wang, G. Rivas, D. Luo, X. Cai, F. S. Valera and N. Dontha, Anal. Chem., 1996, 68, 4365 CrossRef CAS.
- G. Chiti, G. Marrazza and M. Mascini, Anal. Chim. Acta, 2001, 427, 155 CrossRef CAS.
- M. Valden, X. Lai and D. W. Goodman, Science, 1998, 281, 1647 CrossRef CAS.
- M. M. Maye, Y. Lou and C. J. Zhong, Langmuir, 2000, 16, 7520 CrossRef CAS.
- Y. Lou, M. M. Maye, L. Han, J. Luo and C. J. Zhong, Chem. Commun., 2001, 473 RSC.
- S. Tian, J. Liu, T. Zhu and W. Knoll, Chem. Commun., 2003, 2738 RSC.
- M. S. El-Deab, T. Okajima and T. Ohsaka, J. Electrochem. Soc., 2003, 150, A851 CrossRef CAS.
- A. Shipway, E. Katz and I. Willner, ChemPhysChem, 2000, 1, 18 CrossRef CAS.
- E. Majid, S. Hrapovic, Y. Liu, K. B. Male and J. H. T. Luong, Anal. Chem., 2006, 78, 762 CrossRef CAS.
- W. Cheng, S. Dong and E. Wang, Anal. Chem., 2002, 74, 3599 CrossRef CAS.
- C. R. Raj, T. Okajima and T. Ohsaka, J. Electroanal. Chem., 2003, 543, 127 CrossRef CAS.
- C. R. Raj and B. K. Jena, Chem. Commun., 2005, 2005 RSC.
- (a) J. Wang. Analytical Electrochemistry 3rd edition, John Wiley & Sons, Inc., Hoboken, New Jersey, 2006, 91 Search PubMed; (b) J. Wang and B. A. Frelha, Anal. Chem., 1983, 55, 1285 CAS; (c) L. Shi, X. Liu, H. Li and G. Xu, Anal. Chem., 2006, 78, 7330 CrossRef CAS; (d) S. Zhu, W. Niu, H. Li, S. Han and G. Xu, Talanta, 2009, 79, 1441 CrossRef CAS; (e) S. Zhu, H. Li, W. Niu and G. Xu, Biosens. Bioelectron., 2009, 25, 940 CrossRef CAS.
- (a) A. Merkoçi, M. Pumera, X. Llopis, B. Pérez, M. del Valle and S. Alegret, TrAC, Trends Anal. Chem., 2005, 24, 826 CrossRef CAS; (b) H. Lin and C. S. Toh, Anal. Chim. Acta, 2006, 576, 1 CrossRef; (c) L. Agűí, P. Yáñez-Sedeño and J. M. Pingarrón, Anal. Chim. Acta, 2008, 622, 11 CrossRef; (d) J. Wang, Analyst, 2005, 130, 421 RSC.
- G. G. Wildgoose, C. E. Banks, H. C. Leventis and R. G. Compton, Microchim. Acta, 2006, 152, 187 CrossRef CAS.
- (a) J. Wang, M. Li, Z. Shi, N. Li and Z. Gu, Anal. Chem., 2002, 74, 1993 CrossRef CAS; (b) J. Wang, M. Musameh and Y. Lin, J. Am. Chem. Soc., 2003, 125, 2408 CrossRef CAS; (c) J. J. Gooding, R. Wibowo, J. Liu, W. Yang, D. Losic, S. Orbons, F. J. Mearns, J. G. Shapter and D. B. Hibbert, J. Am. Chem. Soc., 2003, 125, 9006 CrossRef CAS; (d) B. R. Azamian, J. J. Davis, K. S. Coleman, C. B. Bagshaw and M. L. H. Green, J. Am. Chem. Soc., 2002, 124, 12664 CrossRef CAS; (e) K. B. Besterman, J. O. Lee, F. G. M. Wiertz, A. Heering and C. Dekker, Nano Lett., 2003, 3, 727 CrossRef CAS; (f) Q. Zhao, Z. Gan and Q. Zhuang, Electroanalysis, 2002, 14, 1609 CrossRef CAS; (g) J. Wang, S. B. Hocevar and B. Ogorevc, Electrochem. Commun., 2004, 6, 176 CrossRef CAS; (h) A. G. Crevillen, M. Pumera, M. C. Gonzaleza and A. Escarpa, Analyst, 2009, 134, 657 RSC.
- S. Hrapovic, Y. Liu, K. B. Male and J. H. T. Luong, Anal. Chem., 2004, 76, 1083 CrossRef CAS.
- X. Lin and Y. Li, Biosens. Bioelectron., 2006, 22, 253 CrossRef CAS.
- D. J. Guo and H. L. Li, Electroanalysis, 2005, 17, 869 CrossRef CAS.
- Y. Wu and S. Hu, Colloids Surf., B, 2005, 41, 299 CrossRef CAS.
- P. Yang, W. Wei and C. Tao, Anal. Chim. Acta, 2007, 585, 331 CrossRef CAS.
- J. Manso, M. L. Mena, P. Yanez-Sedeno and J. M. Pingarron, J. Electroanal. Chem., 2007, 603, 1 CrossRef CAS.
- S. Hrapovic, E. Majid, Y. Liu, K. Male and J. H. T. Luong, Anal. Chem., 2006, 78, 5504 CrossRef CAS.
- R. Blonder, L. Sheeney and I. Willner, Chem. Commun., 1998, 1393 RSC.
- K. B. Male, S Hrapovic, Y. Liu, D. Wang and J. H. T. Luong, Anal. Chim. Acta, 2004, 516, 35 CrossRef.
- M. Brust, M. Walker, D. Bethell, D. J. Schiffrin and R. Whyman, J. Chem. Soc. Chem. Commun., 1993, 96, 96 Search PubMed.
- A. J. Bard; H. Lund. Encyclopedia of Electrochemistry of the Elements, Organic Section, Vol. XV, Marcel Dekker, Inc., New York, 1973 Search PubMed.
- M. M. Baizer, H. Lund. Organic Electrochemistry, 2nd Edition, Marcel Dekker, Inc., New York, 1983 Search PubMed.
- D. Kyriacou. Modern Electroorganic Chemistry, Springer-Verlag, Berlin, 1994 Search PubMed.
- (a) R. L. Garell, Anal. Chem., 1989, 61, 401A CAS; (b) M. Moskovits, Rev. Mod. Phys., 1985, 57, 783 CrossRef CAS; (c) Y. C. Liu and C. C. Wang, J. Phys. Chem. B, 2005, 109, 5779 CrossRef CAS; (d) Y. Lu, G. L. Liu and L. P. Lee, NanoLett., 2005, 5, 5 CrossRef CAS.
- M. Peuckert, F. P. Coenen and H. P. Bonzel, Surf. Sci., 1984, 141, 515–532 CrossRef CAS.
- A. J. Bard; L. R. Faulkner. Electrochemical Methods Fundamentals and Applications; John Wiley and Sons: New York, 2000 Search PubMed.
| This journal is © The Royal Society of Chemistry 2010 |
