A novel urinary oxalate determination method via a catalase model compound with oxalate oxidase†
Guanke
Zuo‡
b,
Xiaojun
Jiang‡
b,
Hui
Liu
b and
Jingyan
Zhang
*ab
aState Key Laboratory of Bioreactor Engineering, East China University of Science & Technology, Shanghai, 200237, P. R. China. E-mail: jyzh04@yahoo.com; Fax: 0086-021-64253846; Tel: 0086-021-64253846
bDepartment of Pharmaceutical Sciences, School of Pharmacy, East China University of Science & Technology, Shanghai, 200237, P. R. China
First published on 16th December 2009
Abstract
This work describes a novel method of urinary oxalate determination based on a catalase model compound MnL(H2O)2(ClO4)2 (L = bis(2-pyridylmethyl)amino)propionic acid). Urinary oxalate is first decomposed by the oxalate oxidase into carbon dioxide and hydrogen peroxide. The later is then disproportionated into water and oxygen by the catalase model compound forming a color compound, which can be spectrophotometrically monitored. The oxalate concentration of the sample is quantified according to the UV-vis absorbance of the formed color compound. This model compound method maintains the specificity and sensitivity of the conventional enzymatic assay. It has several advantages over the traditional enzymatic method, including low cost, simplicity, large linear range, and adjustable assay time. The model compound method showed a very good linearity in the range of 0.002–20 mmol L−1 oxalate, with a detection limit of 2 μmol L−1 oxalate. The mean urinary oxalate determined by this method was 28.6 μg mL−1, standard deviation (SD) was 1.07 μg mL−1, and variation coefficient (CV) is less than 4%. The results are consistent with that acquired from the enzymatic and HPLC methods. The model compound method also showed that the model compounds of the corresponding enzymes can be an alternative to the enzymes, thus the cost of the methods or assays using the enzymes can be greatly decreased.
Introduction
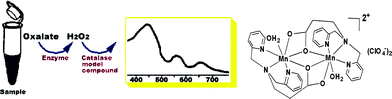
The methods of urinary oxalate determination have been extensively explored, because the urinary oxalate concentration is critical in diagnosis of primary hyperoxaluria type I, chronic renal failure, and calcium oxalate nephrolithiasis etc.1 Among the variety of methodologies, such as volumetric analysis, precipitation, solvent extraction, and mass spectrometry etc., the enzymatic method is one of the most widely used methods in the majority of clinics and laboratories as routine oxalate analyzers due to its high specificity and sensitivity.2–5 However, at least two different enzymes are required in one single enzymatic assay, in which one enzyme is used to decompose oxalate, and the other is used to monitor the oxalate decomposition products, H2O2 or CO2. Accordingly, the cost of the enzymatic method is high and the detection procedure is complicated. Great efforts have been devoted to lower the assay cost and/or to simplify the assay procedure.6–13 For example, developing a biosensor using enzymes is one of the areas in the development of methods of oxalate determination. However, special modifications of the electrodes were necessary in most cases.13 Combining the enzymatic assay with other detection means, such as HPLC, to simplify the enzymatic assay was also explored. The high sensitivity which is enough for normal urinary oxalate detection was obtained with such combination, the instrumentation, however, is complicated and expensive for a general purpose.14 Therefore improving the urinary oxalate determination method is still a challenge in the area.Avoiding the usage of the enzymes, especially the secondary enzymes such as horseradish peroxidase, formate dehydrogenase, or formyl-CoA transferase that are commonly used to detect the oxalate decomposed products, should dramatically decrease the cost of the enzymatic assay. The objective of the present investigation is to establish a model compound method of urinary oxalate determination using an enzyme model compound, [MnL(H2O)]2(ClO4)2 (see structure in Scheme 1) to replace the peroxidase in the enzymatic assay. [MnL(H2O)]2(ClO4)2 mimics the catalase activity disproportionating hydrogen peroxide (oxalate decomposed product), thus this can be used in the oxalate determination. The enzyme model compounds generally, are catalytically less efficient compared to the enzymes, but they are inexpensive, easy to handle, and small in molecular weight, thus are very attractive enzyme replacements in many applications. The potential of the enzyme model compounds have been showed in many fields.15 For instance, a biomimetic sensor using a mimetic of the manganese peroxidase to determine rutin was reported recently.16 The oxalate in a sample is first decomposed by oxalate oxidase forming H2O2. The produced H2O2 is then decomposed by [MnL(H2O)]2(ClO4)2 forming a color product. The color product has featured UV-vis absorbencies that can be used to determine the produced H2O2, which is proportional to the oxalate concentration of the sample. In this model compound method, neither a second enzyme nor an assistant dye that are necessary in the traditional enzymatic method are required. The process is schematically shown in Scheme 1.
 | ||
| Scheme 1 Schematic diagram of the model compound method of the oxalate determination. | ||
The characteristics of the model compound method with regard to the linear range, detection limit, and sensitivity were investigated. In addition, the influence of the factors such as the concentration of the model compound, pH, and temperature were evaluated.
Experimental
Materials and reagents
All chemicals were purchased from Sigma Chemical Co. (St. Louis, MO, USA) and SinoPharm (Shanghai, China) and used without further purification. UV-vis absorption spectra of the samples were obtained on Cary 50 spectrophotometer (Varian, USA). HPLC measurements of the urine samples were carried out with C18 column, 15% methanol in 0.1 M ammonium acetate buffer (pH 6.6) as an elute. The urinary samples for HPLC measurements were pretreated by reacting with o-phenylenediamine to form 2,3-dihydroxyquinoxaline, which has a strong UV-vis absorption. Oxalate oxidase was purified in our laboratory through heat treatment, salting out and anion exchange column from 10 days old barley roots. The purity of the oxalate oxidase was checked by SDS-PAGE, and the activity was assayed according to the literature procedure.17Catalase model compound preparation
The ligand of the catalase model compound MnL(H2O)2(ClO4)2, where L = bis(2-pyridylmethyl)amino)propionic acid, was synthesized according to the literature.18 The model compound was prepared as the following: to a 2 mL methanol solution of manganese perchlorate hexahydrate (18.1 mg, 0.05 mmol), ligand (13.95 mg, 0.05 mmol) in 2 mL of methanol was added. The solution was stirred at room temperature for 30 min, white precipitates was collected and re-crystallized from acetonitrile. Yield: 25 mg, 78%. Anal. Calculated: C 40.52, N 9.27, H 4.06; Found: C 40.6, N 9.47, H 4.32. The compound is soluble and stable in acetonitrile and succinate buffer (pH 2–6).19Oxalate concentration determination
The oxalate concentration of the urine samples was determined as follows. First, the standard oxalate samples (0–100 μM) were prepared. The oxalate in the samples was first decomposed into H2O2 and CO2 by the oxalate oxidase. In general, the total sample volume of this step was 275 μL, containing the sample and the oxalate oxidase in pH 3.5, 20 mM succinate buffer. The mixture was incubated at 40 °C for 5–10 min to ensure the oxalate decomposition is complete. In the next step, the catalase model compound (1–6 mM) dissolved in 50 mM succinate buffer (pH 6) was added to the reaction mixture of the first step, and the total sample volume was up to 1 mL. The reaction mixture was then incubated at 50 °C. The incubation time is determined by the model compound used, typically from 10 to 40 min. Finally, the mixture was then subjected to UV-vis measurement. The oxalate standard curve was plotted with the oxalate concentrations of the standard samples versus their absorbencies at 400 nm. The oxalate concentrations of the urine samples were then determined according to the standard curve.Urine sample pretreatment
Urine samples were collected from fifteen healthy volunteers. All urine samples were treated first with hydrochloric acid to lower the pH of the urine samples to 1–2, in order to prevent the precipitation of the oxalate and bacterial growth in the specimens.4 EDTA was then added to the acidified urine sample giving a final EDTA concentration of 10 mM to prevent precipitation of calcium oxalate.20 The pH of the urine sample was then adjusted to 5 with succinic acid and diluted two times. The diluted urine sample was mixed with 200 g L−1 activated charcoal for 5 min with stirring.21 The resulting mixture was filtered under vacuum. The filtrate urine specimens were stored at −20 °C until they were assayed.22 The oxalate recovery reached 96% after the acidification, charcoal treatment, and EDTA chelating, which is similar to the literature reported.23 The final dilution fold of the urine samples is about 20–24, which according to the literature is in the dilution range that does not affect the detection accuracy.2Results and discussion
Catalase model compound
The catalase model compound, MnL(H2O)2(ClO4)2, was prepared and characterized by elemental analysis and X-ray crystallography.24 MnL(H2O)2(ClO4)2 can disproportionate H2O2 (oxalate decomposed product) into water and oxygen as the enzyme catalase does. The possibility of the using the enzyme model compound in the oxalate determination was first investigated systematically via the reaction of the model compound with the standard H2O2 samples. As shown in Fig. 1, the model compound lacks any visible absorption itself, but it can react with H2O2 forming a color product with featured UV-vis absorptions λmax(H2O)/nm at 400 (ε/dm3 mol−1 cm−1 2051), 550 (295.6), and 650 (203). The colored compound is the oxidized model compound, which is a high valent manganese compound.24 The model compound is a catalyst for the H2O2 disproportionation. At a constant H2O2 concentration, the reaction is first order with respect to the model compound.24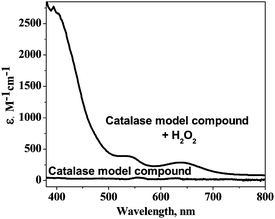 | ||
| Fig. 1 UV-vis spectra of the catalase model compound and its H2O2 oxidized product. | ||
These UV-vis absorbencies provide a convenient handle to monitor the reaction of the model compound with H2O2. The absorbance at 400 nm was used to monitor the reaction in the following measurements for the colored compound has a higher extension coefficient at 400 nm than the other two wavelengths. Fig. 2 indicates the pH and temperature dependencies of the reaction of the model compound with H2O2. As shown in Fig. 2A, the reaction is pH dependent, and the reaction is getting faster at higher pH.24 In contrast the reaction rate is not very sensitive to the temperature from 20 to 50 °C, but increased very fast above 50 °C, possibly because the high temperature is favorable to the release of the product O2 as shown in Fig. 2B. Considering the model compound solubility in aqueous solution and its pH and temperature dependencies, 50 mM, pH 6, succinate buffer, and 50 °C were chosen as reaction conditions in the following experiments as described in the experimental section.
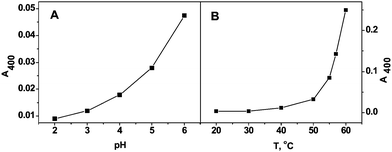 | ||
| Fig. 2 A. pH dependence of the reaction of the model compound with H2O2. Reaction conditions: the model compound 1 mM, H2O2 10 mM, 50 mM succinate buffer, temperature 50 °C, reaction time 10 min. B. Temperature dependence of the reaction of the catalase model compound with H2O2. Reaction conditions: model compound concentration 1 mM, H2O2 10 mM, pH 6, 50 mM succinate buffer, reaction time 10 min. | ||
The concentration of the model compound
The H2O2 disproportionation induced by the model compound is dependent on the model compound concentration. Fig. 3 showed the dependence of the reaction rate monitored at 400 nm on the concentration of the model compound at a constant H2O2 concentration. The result indicates that when H2O2 concentration of a sample is low, a relative high concentration of the model compound is necessary to be able to detect the H2O2. On the contrary, if a sample contains a relative high concentration of H2O2, less model compound is required.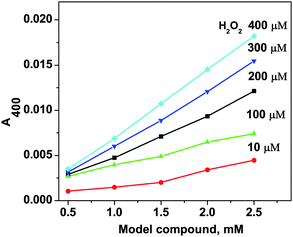 | ||
| Fig. 3 The effect of the concentrations of the model compound and H2O2 on their reaction with H2O2 monitored by UV-vis absorptions at 400 nm. The experiments were done in pH 6, 50 mM succinate buffer at 50 °C for 40 min. | ||
Linear range and sensitivity of the reaction of the model compound with H2O2
The standard samples with different H2O2 concentrations were employed to react with the catalase model compound to get a linear range of the reaction. The reaction showed linearity in the range of 0.002–20 mmol L−1 H2O2, and a detection limit of 1 μmol L−1 H2O2. The sensitivity of the reaction with regard to the H2O2 concentration could be tuned by the concentration of the model compound used (Fig. 3). When the concentration of the model compound was 6 mmol L−1 (the highest concentration under the experimental condition), 1 μmol L−1 H2O2 could be determined accurately (inset of Fig. 4A).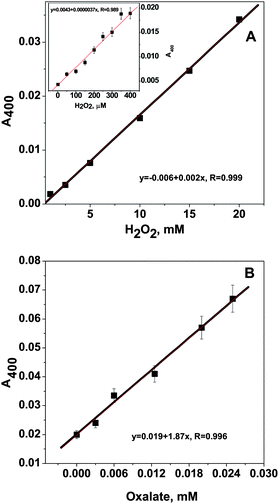 | ||
| Fig. 4 A. The linear range of the reaction of the model compound with H2O2 from 1–20 mM. The reaction conditions for the model compound were 1 mM, 40 °C, 10 min. The inset is the linear range at the lower H2O2 concentration 1–200 μM, the experiment was done at 50 °C for 40 min, the compound concentration is 6.0 mM. B. Linearity of oxalate standard curve of the oxalate concentration from 0.5 to 25 μM. The standard samples were first reacted with the purified oxalate oxidase (10 μg), then reacted with the model compound (1 mM) at 40 °C for 10 min, in pH 6, 50 mM succinate buffer. | ||
On the other hand, if H2O2 concentration is high, for example 20 mmol L−1, 1 mmol L−1 catalase model compound is enough. This result suggests that we could vary the amount of the catalase model compound used in the practical assay according to the H2O2 concentration of samples. The dependence of the concentration of the model compound in the assay is similar to the commercial protein concentration assay, where the dye used in the assay is dependent on the protein concentrations of samples.25 Similarly, the reaction time could also be adjusted according to the concentration of the model compound used as well.
Factors affecting the reaction of the model compound with H2O2
The interferences of the each component in the assay system to the reaction of the model compound with H2O2 were also investigated. Oxalate oxidase in combination with the model compound was employed to develop an analysis method of oxalate. In general, enough oxalate oxidase is necessary to completely convert oxalate into H2O2. This requirement should be no problem because of the high efficiency of the enzyme. The oxalate oxidase may partially be denatured due to the relative high temperature and long reaction time of the next step, this could result in a false high UV-vis absorption. The enzyme, therefore, was removed by precipitating with chloroform after the oxalate conversion step. The generated H2O2 in the sample, however, was not affected by this treatment as proved by comparing with the untreated sample. The removal of the enzyme is only necessary when oxalate oxidase is in large excess. For the linear range of 0.002–20 mmol L−1 oxalate, 10–15 μg enzyme is used, and the removal of the enzyme is not necessary. All the other components of the assay system did not interfere with the reaction of the model compound with H2O2.Urinary oxalate determination
Based on the studies of the reaction of model compound with H2O2, an oxalate standard curve was made by plotting the oxalate concentrations of the standard samples versus the absorbencies of their reaction mixtures at 400 nm. Due to the enzyme cost, the linear curve from 0.5 to 25 μM oxalate range was made. The pretreated urine samples were measured and the oxalate concentration was determined using the above standard curve. Unexpectedly, a spuriously high urinary oxalate concentration, which was far above the average value published in the literatures, was obtained. This unusual result indicated that some ingredients in urine possibly react with the model compound. Urine is a complicated composite, aside from water, it contains an assortment of inorganic salts and organic compounds including a wide range of metabolites, proteins, and hormones. Though we carried out a charcoal treatment, and also used EDTA to chelate metal ions that possibly interfere with the model compound, the contribution from the urine sample still can not be removed completely (see supplementary figure S1†). It is possible that a more forceful method is necessary to remove some ingredients, or the model compound might interact with these ingredients forming products, which result in a high absorption background. The interference of the ascorbic acid in the urine sample to the assay was investigated, because it was reported that ascorbic acid could affect the oxalate recovery, thus interfering with the assay. However the absorbance was not affected by ascorbic acid, which is consistent with the literature that ascorbic interference was not observed in the charcoal pretreated urine sample.23 We do not fully understand which components of the urine sample cause the increase of the UV-vis absorption of the assay mixture, thus to avoid the interference from the unknown urine components, a new standard curve was prepared by including the same sample volume pretreated urine in the reaction buffer. Fig. 4B showed the revised oxalate standard curve at a lower oxalate concentration range. The detection limit was 2 μmol L−1 oxalate, which provides enough sensitivity for a measurement of the normal urinary oxalate, and is also suitable for the determination of the plasma urine that is hard to obtain with regular methods. The detection linear range is larger than that of the Sigma kit (<1 mmol L−1 oxalate), and better than some bi-enzymatic assay systems.26 The mean value (sample number, n = 13) of urinary oxalate concentration obtained was 28.6 μg mL−1; SD was 1.07 μg mL−1, and CV < 4%. SD is much better than the traditional enzymatic method.The precision of the model compound method was further assessed by comparing with the results obtained by the HPLC method with the same samples.27 The averaged oxalate concentration determined by HPLC is 25.9 μg mL−1, SD is 11.1 μg mL−1 (n = 9) (Table 1). The urinary oxalate concentration acquired by the HPLC method was slightly lower than that of the enzyme model compound method, which is consistent with the earlier report.2 Most importantly, the model compound method exhibits much lower SD values compared with the other methods (Table 1).
| Method | Mean value/μg mL−1 | SD/μg mL−1 | Minimum/μg mL−1 | Ref. |
|---|---|---|---|---|
| a Sample number n = 13. b The results obtained with the same urine samples (n = 9) that were used in the model compound method. | ||||
| Enzymatic method | 30.1 | 20.5 | 2.9 | 2 |
| Model compound method | 28.6 a | 1.07 | 2.7 | This work |
| HPLC | 25.9b | 11.1 | — | This work |
| Conductivity | 18.9 | 10.5 | 6.0 | 28 |
| Gas chromatography | 16.8 | 10.7 | 3.6 | 29 |
| HPLC | 13.3 | 11.6 | 0.6 | 3 |
A possible limitation of the model compound method is the stability of the color product formed by the reaction of the model compound with H2O2. When H2O2 is 20 mM, and the concentration of the model compound is 1 mM, the formed color product is stable at room temperature for 3 h, which is enough for any general oxalate assay. Practically, oxalate concentrations in normal urine, blood, or other samples such as food usually are far below 20 mM, therefore the stability of the color product in the assay is not a problem for the assay.
Conclusions
A novel methodology for urinary oxalate determination was presented using a catalase model compound. Combining the easily obtained synthetic catalase model compound with the oxalate oxidase, the method maintains the specificity and sensitivity of the traditional enzymatic assay. The oxalate detection limit is 2 μmol L−1 oxalate. In addition, it has several advantages over the enzymatic method, including low cost (synthetic model compound is much cheaper than the enzyme), large linear range, and adjustable assay time. The urinary oxalate concentration determined by the model compound method developed in this work correlates very well with those obtained by HPLC techniques. The method may find its potential applications in determination of samples with broad ranges of oxalate concentrations. We also demonstrated that the model compounds of the enzyme could be a practical alternative to the corresponding enzymes.Acknowledgements
The authors gratefully acknowledge the National Science Foundation (No. 20671034) and Shanghai Pujiang Scholarship Program (No. 06PJ14030) for financial support.References
- J. Costello and D. M. Landwehr, Clin. Chem., 1988, 34, 1540–1544 CAS.
- M. F. Laker, A. F. Hofmann and B. J. Meeuse, Clin. Chem., 1980, 26, 827–830 CAS.
- J. E. Zerwekh, E. Drake, J. Gregory, D. Griffith, A. F. Hofmann, M. Menon and C. Y. Pak, Clin. Chem., 1983, 29, 1977–1980 CAS.
- J. E. Buttery, N. Ludvigsen, E. A. Braiotta and P. R. Pannall, Clin. Chem., 1983, 29, 700–702 CAS.
- P. Chandran, M. Thakur and C. S. Pundir, J. Biotechnol., 2001, 85, 1–5 CrossRef CAS.
- R. Bais, N. Potezny, J. B. Edwards, A. M. Rofe and R. A. J. Conyers, Anal. Chem., 1980, 52, 508–511 CrossRef CAS.
- G. P. Kasidas and G. A. Rose, Ann. Clin. Biochem., 1985, 22, 412–419 CAS.
- M. Bhambi and C. S. Pundir, Biotechnol. Appl. Biochem., 2007, 47, 125–129 CrossRef CAS.
- C. A. Malpass, K. W. Millsap, H. Sidhu and L. B. Gower, J. Biomed. Mater. Res., 2002, 63, 822–829 CrossRef CAS.
- R. H. Capra, M. Strumia, P. M. Vadgama and A. M. Baruzzi, Anal. Chim. Acta, 2005, 530, 49–54 CrossRef CAS.
- C. S. Pundir, N. S. Chauhan and M. Bhambi, Anal. Biochem., 2008, 374, 272–277 CrossRef CAS.
- C. S. Pundir, N. K. Kuchhal and A. K. Bhargava, Biotechnol. Appl. Biochem., 1998, 27, 103–107 CAS.
- P. A. Fiorito and S. I. Códoba de Torresi, Talanta, 2004, 62, 649–654 CrossRef CAS.
- S. M. Reddy, S. P. Higson and P. M. Vadgama, Anal. Chim. Acta, 1997, 343, 59–68 CrossRef CAS.
- H. B. Gray, Proc. Natl. Acad. Sci. U. S. A., 2003, 100, 3563–3568 CrossRef CAS.
- A. C. Franzoi, R. A. Peralta, A. Neves and I. C. Vieira, Talanta, 2009, 78, 221–226 CrossRef CAS.
- V. P. Kotsira and Y. D. Clonis, Arch. Biochem. Biophys., 1998, 356, 117–126 CrossRef CAS.
- H. Iikura and T. Nagata, Inorg. Chem., 1998, 37, 4702–4711 CrossRef CAS.
- X. Jiang, H. Liu, B. Zheng and J. Zhang, Dalton Trans., 2009, 8714–8723 RSC.
- A. H. Chalmers, D. M. Cowley and B. C. McWhinney, Clin Chem, 1985, 31, 1703–1707 CAS.
- A. Ichiyama, E. Nakai, T. Funai, T. Oda and R. Katafuchi, J. Biochem. (Tokyo), 1985, 85, 1375–1379 Search PubMed.
- F. Hong, N.-O. Nilvebrant and L. J. Jösson, Biosens. Bioelectron., 2003, 18, 1173–1183 CrossRef CAS.
- K. Inamdar, K. Raghavan and D. Pradhan, Clin. Chem., 1991, 37, 864–867 CAS.
- L. Dubois, R. Caspar, L. Jacquamet, P. E. Petit, M. F. Charlot, C. Baffert, M. N. Collomb, A. Deronzier and J. M. Latour, Inorg. Chem., 2003, 42, 4817–4827 CrossRef CAS.
- M. M. Bradford, Anal. Biochem., 1976, 72, 248–254 CrossRef CAS.
- M. D. P. T. Sotomayor, Ivo M. Raimundo. Jr, G. O. Neto and L. T. Kubota, Anal. Chim. Acta, 2001, 447, 33–40 CrossRef CAS.
- J. F. Murray, H. W. Nolen, G. R. Gordon and J. H. Peters, Anal. Biochem., 1982, 121, 301–309 CAS.
- J. D. Sallis, M. F. Lumley and J. E. Jordan, Biochem. Med., 1977, 18, 371–377 CrossRef CAS.
- K. Y. Park and J. Gregory, Clin. Chem., 1980, 26, 1170–1172 CAS.
Footnotes |
| † Electronic supplementary information (ESI) available: Supplementary figure S1. See DOI: 10.1039/b9ay00247b |
| ‡ Guanke Zuo and Xiaojun Jiang contributed equally to this work |
| This journal is © The Royal Society of Chemistry 2010 |