Electrochemical approach for the specific detection of hepatitis C virus based on site-specific DNA cleavage of BamHI endonuclease
Shuna
Liu
,
Qian
Wang
,
Dongxiao
Chen
,
Juan
Jin
,
Yaojuan
Hu
,
Ping
Wu
,
Hui
Zhang
* and
Chenxin
Cai
*
Jiangsu Key Laboratory of Biofunctional Materials, Laboratory of Electrochemistry, College of Chemistry and Environmental Science, Nanjing Normal University, Nanjing, 210097, P. R. China. E-mail: zhangh@njnu.edu.cn; cxcai@njnu.edu.cn
First published on 16th December 2009
Abstract
This work proposes a new electrochemical approach for specific detection of hepatitis C virus (HCV) based on the site-specific cleavage of BamHI endonuclease. The method was developed by immobilizing a synthetic probe DNA (a short thiol-capped single strand oligonucleotide) on the surface of a gold electrode via the –SH group at the 5′-terminus of the probe, and conjugating the electroactive label of ferroceneacetic acid (FcA) moiety to the 3′-terminus of the probe via formation of a covalent bond between the –NH2 and –COOH groups. The FcA-labeled probe was then hybridized with target cDNA (an oligonucleotide related to HCV) and cleaved by BamHI endonuclease (a site-specific endonuclease recognizing the duplex symmetrical sequence 5′–GGATCC–3′ and catalyzing double-stranded cleavage between the guanines). After digestion by BamHI, the DNA hybrid was cleaved at a specific site, and the FcA label was removed from the gold electrode surface leading to a decrease or disappearance of the electrochemical signal of the label. The extent of decrease was related to the concentration of target cDNA in solution, which forms the basis of quantitative detection of target cDNA. The detection is based on the variation of voltammetric signal (Δi) of FcA label before and after digestion with BamHI. It was demonstrated that the value of Δi has a linear relationship with the concentration of the HCV DNA (cDNA) ranging from 0.05 to 4.0 μM with a detection limit of (0.5 ± 0.2) nM at a signal/noise of 3. Moreover, the developed method has a high selectivity with ability to discriminate the complementary target DNA sequence from single-base mismatched DNA sequence, and can also be used for detection of HCV in real clinical samples. The major advantages of this enzymatic cleavage assay are its good specificity, ease of performance, and the ability to perform real-time monitoring. The proposed protocol can be taken as a general method of DNA detection and is expected to be applicable to other types of DNA analysis.
Introduction
Hepatitis C virus (HCV) is a small, enveloped, and single-stranded RNA virus.1,2 The virus, transmitted mainly by organ transplantation, blood transfusions, renal dialysis, and intravenous drug abuse,1 is considered to be a major causative agent of chronic hepatitis and progressive liver fibrosis leading to cirrhosis and hepatocellular carcinoma.3,4 Currently, more than 170 million individuals in the world (ca. 3% worldwide) are infected with HCV.5,6 The monitoring of HCV RNA in serum or plasma is indicated for diagnosing or confirming active infections and for assessing patient response to therapy.5,7,8 Therefore, there has been considerable interest in developing reliable and simple methods for detecting the HCV for applications in clinical medicine, experimental biology, and research diagnostics.5 At present, a variety of assay methods have been developed for the qualitative and quantitative detection of HCV RNA. Those approaches involve various nucleic acid amplification methodologies such as reverse transcription and polymerase chain reaction (RT-PCR), transcription-mediated amplification (TMA), and nucleic acid sequence based amplification (NASBA),9–12 electrochemiluminescence,13 surface plasmon resonance,14,15 piezoelectric genosensor,1 optical method,16 and biosensor based on fluorescence detection,17 and electrochemical detection,18,19 and so forth.Among these methods, biosensors based on electrochemical transduction has attracted significant attention and has become a promising method for specific detection of nucleic acid sequences20–27 because of their high sensitivity, low cost, rapid response, compatibility for miniaturization (portability), low manpower requirements, and compatibility with microfabrication technology. Several papers have been published on electrochemical biosensors for hepatitis B virus,28–35 however, to date little has been reported on HCV RNA detection.18,19 One of them is based on a DNA probe labeled with horseradish peroxidase (HRP) and electrochemical detection the reduction of I2 generated by HRP in the presence of H2O2,18 which is considered to be time-consuming and laborious.
Protein–DNA interactions play important roles in life processes, such as DNA replication, transcription, recombination, damage, and repair.26,27,36–40 The restriction endonuclease is a well-studied class of DNA-binding proteins and has been one important tool in the development of modern molecular biology.36,38,41 However, to our best knowledge, there is no report on DNA analysis based on the cleavage of endonuclease. Our previous communication reported a preliminary study on the detection of HCV based on site-specific DNA cleavage of BamHI endonuclease using thionine-labeled probe.42 Herein, the further characterization and optimization of this new electrochemical sensing approach was continued with ferroceneacetic acid (FcA) as an electroactive label. FcA was selected as a label in this work since ferrocene and its derivatives have been considered as excellent probes in electrochemical DNA assays owing to their redox reversibility and synthetic versatility, the ability to promote the detection performance,20,21,43,44 and so forth. Compared with those previous approaches for detection of HCV, which are considered to be time-consuming and require sophisticated and expensive instruments, the developed electrochemical approach, which is based on site-specific DNA cleavage of BamHI endonuclease, not only can qualitatively and quantitatively detect HCV, but also exhibits the advantages of ease of performance, good specificity and selectivity, and the ability to perform real-time monitoring. This method was proved to be sensitive, specific with a low detection limit and a wide linear dynamic range. Moreover, it was successfully used in distinguishing the complementary sequence from the one-mismatched sequences with stability and reproducibility, and can also be used for detection of HCV in real clinical samples. The developed protocol can be taken as a general method of DNA detection and is expected to be applicable to other types of DNA analysis.
Experimental
Chemicals
All chemicals and solvents were of reagent grade or better. Ferroceneacetic acid (FcA, 98%), tris(hydroxymethyl)aminomethane (Tris), tris(2-carboxyethyl)phosphine hydrochloride (TCEP, 98%), N-(3-dimethylaminopropyl)-N′-ethylcarbodiimide (EDC), N-hydroxysuccinimide (NHS, 98%), and 6-mercapto-1-hexanol (MCH) were purchased from Sigma-Aldrich (St. Louis, MO, USA) and used as received. BamHI endonuclease was obtained from Bio-Basic Inc. All solutions were prepared with doubly distilled water.The 21-base sequence of HCV RNA (base location: 8245–8265) was reverse transcribed into complementary DNA (cDNA). All of the synthetic oligonucleotides were purchased from Shanghai Sheng-gong Biotechnology Co. (Shanghai, China), and their base sequences are as follows: the thiol-capped single-stranded probe DNA (S1), 5′–SH–(CH2)6–GAT TGG GGA TCC CGT ATG ATA CCC TGC–(CH2)6–NH2–3′; target cDNA (S2), 5′–GGG TAT CAT ACG GGA TCC CCA–3′; one-base mismatched cDNA (S3), 5′–GGG TAT CAT ACG GGT TCC CCA–3′.
Immobilization of DNA probe and hybridization
A gold disk electrode (2-mm in diameter, CH Instruments) was used as substrate for immobilizing the DNA probe (S1). Prior to use, the electrode was polished and cleaned as reported previously.38 The real surface area of the gold electrode was estimated based on the amount of charge consumed during the reduction of the Au surface oxide monolayer in 1 M H2SO4 and a reported value of ca. 400 μC cm−2 was used for the calculation.45,46 A value of (0.068 ± 0.004) cm2, which was an average value of five independent measurements, obtained for the gold electrode used in this work. The roughness factor, defined as the ratio between the real and the geometric surface area, is ca. 2.2.For the immobilization of S1 on the cleaned Au electrode surface, a mixture of 10 μL S1 solution (10 μM) with 10 μL TCEP solution (10 mM) was first incubated for 1 h to reduce the disulfide bond at the 5′-terminus of S1 and generate a free thiol group for surface immobilization,47 followed by diluting the mixture to 100 μL with 10 mM Tris–HCl buffer (pH 7.6). The S1 was immobilized onto the surface of the Au electrode by incubating the cleaned electrode in the diluted S1 solution for 24 h (step (a) in part B, Scheme 1). The electrode was then rinsed with water and subsequently passivated with MCH (1 mM) for 2 h to block the unoccupied surface binding sites and displace nonspecifically bound S1 on the Au electrode surface48 (step (b) in part B, Scheme 1). MCH can also serve as spacers that finely modulate surface density of DNA probes.49 The modified electrode was thoroughly rinsed with Tris–HCl buffer and water in turn, and stored in the buffer.
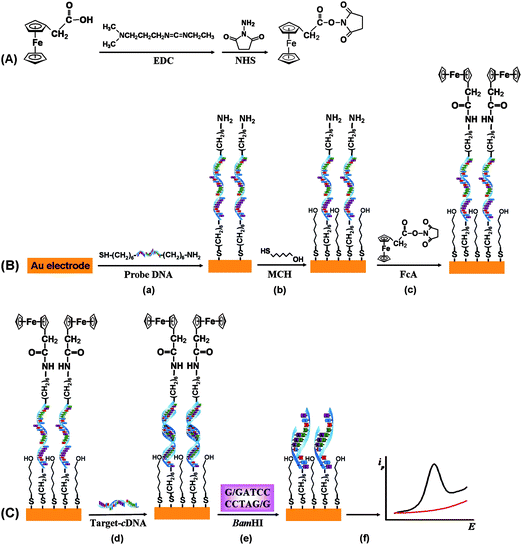 | ||
| Scheme 1 Schematic illustration of the procedures of HCV detection based on the site-specific cleavage of BamHI endonuclease using FcA as an electroactive label. | ||
The redox label of FcA was conjugated to the Au electrode surface by forming the amide between the group of –COOH at FcA and –NH2 moiety at 3′-terminus of the immobilized S1 via the succinimide coupling (EDC–NHS). First, the FcA was activated in the EDC–NHS mixture (5 mM EDC, 10 mM NHS in Tris–HCl buffer, pH 7.6) for 1 h (part A, Scheme 1). The results demonstrated that the response increases with the activation time within 1 h. However, a longer time leads to a slight decrease in response. Therefore, it is reasonable to choose an activation time of 1 h to obtain a good signal-to-noise ratio. Then the S1-immobilized Au electrode was immersed into the mixture containing 0.5 mM FcA for 5 h (step (c) in part B, Scheme 1). The –NH2 group at S1 would react with the activated –COOH moiety, resulting to covalently link FcA at the 3′-terminus of S1 (denoted as FcA–S1 hereafter).
Hybridization was conducted at 37 °C by immersing the FcA–S1-immobilized gold electrode in 2 mL of Tris–HCl buffer containing the target cDNA (S2, 8 μM), or one-base mismatched DNA (S3, 8 μM) for 2.5 h (step (d) in part C, Scheme 1). After hybridization, the electrode was thoroughly rinsed with water.
Cleavage of BamHI endonuclease
BamHI cleavage was performed by incubating the DNA hybrid modified gold electrode in Tris–HCl buffer (pH 7.6), containing 20 U/μL BamHI, 10 mM MgCl2, and 100 mM NaCl, at 37 °C for 3 h (step (e) in part C, Scheme 1). After cleavage, the electrode was thoroughly washed and transferred into acetate buffer (0.1 M, pH 5) to record the electrochemical response (step (f) in part C, Scheme 1).Apparatus
Cyclic voltammetry (CV) was used for characterization of the processes of S1 immobilization on the surface of the gold electrode. Differential pulse voltammetry (DPV) was employed to sense the covalently bonding of FcA with S1, and to characterize the hybridization and cleavage efficiency since the DPV technique has much higher sensitivity than conventional sweep techniques when detecting very low concentrations of redox probe.44,46 This is achieved by applying a small voltage pulse superimposed on the linear voltage sweep and sampling the differential current at a short time after the pulse. CV and DPV experiments were performed with a CHI 660B electrochemical workstation (CH Instruments). A two-compartment three-electrode cell with a sample volume of 5 mL was employed. A coiled Pt wire and a saturated calomel electrode (SCE) were used as the counter and the reference electrode, respectively. The buffer was purged with high-purity nitrogen for at least 30 min prior to each electrochemical measurement and the nitrogen environment was then kept over the solution to protect the solution from oxygen. DPV signals were measured using a potential step of 5 mV, pulse width of 25 ms, pulse period of 100 ms, and pulse amplitude of 50 mV.Results and discussion
Characterization of the process of probe immobilization
The detection of HCV based on site-specific DNA cleavage of BamHI using synthetic oligonucleotide as a probe is illustrated in Scheme 1. The probe DNA with FcA redox moiety conjugated to its 3′-terminus by formation of a covalent bond was self-assembled on the surface of the gold electrode. Then, the FcA-labeled probe was hybridized with target cDNA, which is a 21-base oligonucleotide related to HCV. The detection is based on the variation of voltammetric signal of FcA before and after digestion with BamHI endonuclease, which is a site-specific endonuclease with molecular mass of about 22 kDa.50BamHI recognizes the duplex symmetrical sequence 5′–GGATCC–3′ and catalyzes double-stranded cleavage between the guanines in the presence of Mg2+.51 After digestion by BamHI, the DNA hybrid was cleaved at a specific site and the electrochemical signal of FcA was decreased or disappeared. The extent of decrease was related to the concentration of target cDNA in solution, which forms the basis of quantitative detection of target cDNA.To fabricate the sensing platform, the probe DNA (S1) was immobilized on the gold electrode surface via sulfur–gold affinity. The immobilization processes were characterized by CV. The redox couple of Fe(CN)63−/4− was selected as a probe to characterize the immobilization processes since the redox process of the couple is a typical inner-sphere reaction in which the electron-transfer kinetics is generally sensitive to the properties of the electrode surface.52Fig. 1 displays the CV characteristics of Fe(CN)63−/4− redox couple at the bare gold electrode (curve a) and the S1-modified gold electrode (curve b–e) in 0.1 M KCl solution at a scan rate of 100 mV s−1. The cyclic voltammogram of Fe(CN)63−/4− at the bare gold electrode is characterized by a couple of well-defined redox peaks with the anodic (Epa) and cathodic peaks (Epc) potential of 160 and 230 mV, respectively (curve a in Fig. 1). The redox peaks exhibit diffusion-controlled features since both anodic and cathodic peak currents increase linearly with the square root of scan rates (not shown here), and moreover, the separation of anodic and cathodic peak potential (ΔEp) is 70 mV, which is very close to that expected by theory for reversible diffusion-controlled electrochemical reaction.52 The reaction of the couple at the S1-modified electrode becomes markedly less reversible as evidenced by the increase of the value of ΔEp since the values of Epc and Epa move to negative and positive directions, respectively (curve b–e in Fig. 1). With increasing the incubation time of gold in S1 solution (1 μM in 10 mM Tris–HCl buffer, pH 7.6), the values of ΔEp increase significantly and the peak currents decrease simultaneously. For example, the value of ΔEp is 146, 244, and 361 mV for the incubating time of 6, 12, and 24 h, respectively. This phenomenon is due to repulsive electrostatic interactions between the negative probe DNA layer and the anionic Fe(CN)63−/4−, which impedes the anions from reaching the electrode surface. These results suggest that S1 is successfully immobilized on the gold electrode surface. After the gold electrode was incubated in S1 solution for 24 h, the coverage of S1 on the gold electrode surface tends to be saturated and the monolayer is reached since the cyclic voltammograms of the Fe(CN)63−/4− at the electrode incubated for 48 h (curve d in Fig. 1) is identical with that obtained at the electrode incubated for 24 h in S1 solution (curve e in Fig. 1).
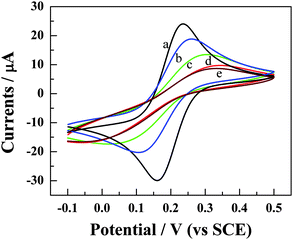 | ||
| Fig. 1 Typical voltammetric responses of the Fe(CN)63−/4− redox pair (5 mM) at the bare (curve a) and the S1-modified gold electrode (curve b–e) in 0.1 M KCl solution at a scan rate of 100 mV s−1. The modification time for curve b to e is 6, 12, 24, and 48 h, respectively. | ||
Conjugation of FcA
It has been reported that pure synthetic single-stranded DNA oligonucleotides (typically ∼20-base) terminally attached by the 5′-terminus to a gold electrode surface, and bearing at the free 3′-terminus a small redox active label (such as a ferrocene unit), are valuable models for detection of DNA hybridization, mutations, DNA lesions, gene sequencing, and DNA/protein interaction.53–56 FcA, which is selected as the redox label in this work, can be conjugated to the Au electrode surface by formation of the amide with the NH2 moiety at 3′-terminus of the immobilized S1. CV and DPV were used to characterize the conjugation process. Typical cyclic voltammograms are given in Fig. 2 (part A). The S1-modified gold electrode doesn't show an observable redox reaction in the potential of interest (curve b in part A). However, after conjugation with FcA, a pair of well-defined redox peaks with Epc and Epa of ca.150 and 200 mV, respectively, is observed (curve b in part A). The formal potential (E0′), defined as the average of Epc and Epa, is found to be ca.175 mV (vs. SCE), which is similar to those reported by Anne et al. (ca. 170 mV, vs. SCE)43 and Radi et al. (165 mV, vs. Ag/AgCl)20 for the same label. These results ascertain that FcA has been successfully conjugated with S1. The plot of peak currents against the scan rates is linear (not shown here), which confirms the existence of a surface-confined Faradaic reaction. The ratio of the cathodic to anodic peak current is close to unity at all scan rates. The peak potential remains unchangeable with a scan rate up to at least 250 mV s−1. Therefore, the charge transfer between FcA moiety and the gold electrode is considered to be fast. However, a closer examination of the shape of the cyclic voltammogram presented in curve a of part A (Fig. 2) reveals that the width at mid-peak height is ca. 100 mV, slightly larger than the value for ideal system (90.6 mV for one-electron redox system),57 and the value of ΔEp (54 mV) is much greater than the ideal value (0 mV).57 These non-ideal characteristics can be caused by several factors,20 including lateral interactions between electroactive groups, spatial distribution of redox centers, nonequivalent electroactive sites, heterogeneities in the monolayer film, potential drop, and so forth. In addition, the electron-transfer processes of the immobilized FcA moiety on the electrodes are coupled to the rates of transport of the charge-compensating counterions into and out of the monolayer since the redox process of the surface-attached FcA can be represented as58| –FcA + Xs− → –FcA+X− + e− + solv |
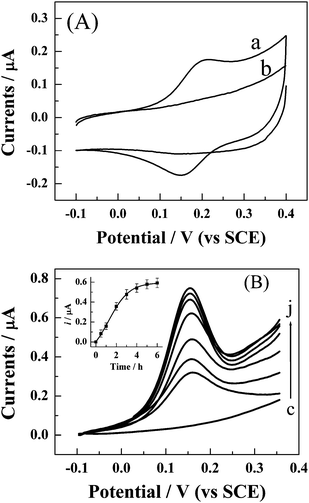 | ||
| Fig. 2 (A) Cyclic voltammograms of the S1-modified gold electrode in 0.1 M acetate buffer (pH 5.0) before (curve b) and after 5-h conjugation with FcA (curve a). The scan rate is 50 mV s−1. (B) Dependence of DPV response of S1-modified gold electrode in 0.1 M acetate buffer on the conjugation time with FcA. The conjugation time for curve (c) to (j) is 0, 0.5, 1, 2, 3, 4, 5, and 6 h, respectively. DPV responses were recorded using a potential step of 5 mV, pulse width of 25 ms, pulse period of 100 ms, and pulse amplitude of 50 mV. The inset shows the dependence of the DPV peak current on the conjugation time. Every point is an average value of five independent measurements. | ||
Optimizing the reaction time between the –COOH and –NH2 is necessary to achieve the high sensitively detection of HCV. DPV was used for monitoring the process of the conjugated reaction. The results are presented in part B of Fig. 2. Increasing the reaction time leads to an enhancement in the DPV response for the oxidation of FcA (Fig. 2B, and the inset). After 4 h, the response reaches a plateau and keeps almost invariant with the increasing of the reaction time. These results indicate that coverage of FcA at the electrode surface tends to be saturated and the conjugated reaction of FcA with NH2-moiety of S1 is almost completed after 4 h incubation. Therefore, incubation of 5 h is selected in this work hereafter to ensure the completed conjugation.
Integration of the area of the cyclic voltammetric peaks (such as those presented in part A of Fig. 2) under either the anodic or the cathodic peak, corrected from the background current and measured at a slow scan rate, gives the Faradaic charge required for the full oxidation (or full reduction) of the conjugated FcA. The total amount of bound FcA on the electrode surface (Γ) can be deduced quantitatively from Γ = Q/nFA, where n is the number of electrons transferred (n = 1 for redox couple of FcA/FcA+ in this work), F the Faraday constant, Q the peak area of the immobilized layer in coulombs, and A is the effective surface area of the gold electrode (in cm2), thus yielding Γ = (3.57 ± 0.54) × 10−11 mol cm−2, which is equivalent to a surface density of (2.15 ± 0.32) × 1013 FcA molecules cm−2 (an average value of five independent measurements). Such a surface density of FcA is close to those values, within the experimental error, reported for the self-assembled monolayer of single-stranded oligonucleotides (shorter than 24-base) via sulfur–gold affinity by Radi et al. (ca. 2.25 × 10¹³ molecules cm−2),59 Liao et al. ((1.14 ± 0.07) × 1013 molecules cm−2),60 Steel at al. (ca. 1 × 10¹³ molecules cm−2),49 and Zhang et al. (5.1 × 10¹³ molecules cm−2).21 This result suggests that almost every S1 molecule immobilized on the surface of the gold electrode has been conjugated with one FcA molecule, demonstrating that the conjugation of FcA with S1 is effective and highly efficient.
Hybridization and cleavage
This work studied the interaction of BamHI endonuclease with S1/S2 hybrid based on the variation of the DPV signal of FcA label before and after digestion with BamHI (Scheme 1). Although short oligonucleotides are rarely cleaved by restriction endonucleases while these enzymes are frequently used to cleave long DNA molecules such as chromosomal DNAs, as well as viral and plasmid DNAs.38 In this paper, short oligonucleotides (21-base) were used as model DNA to study DNA cleavage by BamHI. The aim is to develop a new approach to detect HCV. The DPV response of the FcA–S1-modified gold electrode in 0.1 M acetate buffer (pH 5.0) demonstrates an anodic peak at ca.−150 mV (curve a in Fig. 3), which is the response of the oxidation of FcA label at the gold electrode. After hybridization with target cDNA (S2), the DPV also shows an anodic peak (curve b in Fig. 3). The position and the height of this peak are identical with that shown in curve a in Fig. 3, suggesting that hybridization of S1 with S2 doesn't affect the DPV features of the FcA label. After the hybrid-modified gold electrode was treated with BamHI for 3 h at 37 °C and then rinsed with copious amount of water, the DPV response of FcA has completely disappeared (curve d of Fig. 3). As it is known, BamHI is a site-specific endonuclease. The hybrid was cleaved at a specific site (5′–G/GATCC–3′) when it was treated with BamHI, and the FcA label was removed from the electrode surface. Therefore, no DPV peak of the label can be observed again in curve d of Fig. 3.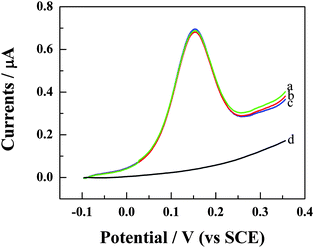 | ||
| Fig. 3 DPV responses of FcA–S1 (curve a), FcA–S1/S2 (b) modified gold electrode in 0.1 M acetate buffer (pH 5.0). Curve (c) and (d) are the DPV responses of FcA–S1/S3-modified (curve c) and FcA–S1/S2-modified gold electrode (curve d), respectively, after digestion with BamHI for 3 h at 37 °C in Tris–HCl buffer (pH 7.6) containing 20 U μL−1BamHI, 10 mM MgCl2, and 100 mM NaCl. The conditions for the DPV measurements are the same as those shown in the caption of Fig. 2. | ||
BamHI endonuclease recognizes the duplex symmetrical hexanucleotide sequence 5′–G/GATCC–3′.46 To confirm that the disappearance of the DPV signal of FcA in curve d of Fig. 3 resulted directly from the cleavage of the endonuclease, a one-base mismatched cDNA (S3) was selected to assay the cleavage specificity of BamHI endonuclease. The FcA–S1-immobilized gold electrode was hybridized with S3 for 2.5 h, and then treated in the enzymatic cleavage mixture for 3 h. It is obvious that the DPV signal of FcA can still be observed (curve c in Fig. 3). Moreover, the DPV peak currents remain almost invariant compared with those presented in curve a and b in Fig. 3, suggesting that BamHI has no effect on the S1/S3 hybrid because the hybrid does not contain the specific recognition sequence for the endonuclease. These results confirm that the DPV signal disappearance in curve d of Fig. 3 is a direct consequence of the enzymatic cleavage of the specific recognition sequence for BamHI. Restriction endonucleases are useful models for studying the interaction of proteins with specific nucleic acid sequences because they are one of the highest site-specificity DNA-interacting proteins. The results represented here demonstrate that the interaction model of DNA–BamHI endonuclease can be used for qualitative HCV detection.
BamHI–DNA interaction was also studied real-time, which was monitored by detecting the decrease of the DPV signal of FcA with the increasing of the digestion time with the endonuclease. It is demonstrated that the DPV peak current of the electroactive label decreases rapidly after the S1/S2 hybrid modified gold electrode was immersed in the cleavage mixture (Fig. 4), indicating that the cleavage occurred. With increasing cleavage time, the DPV response decreases linearly with a slope of ca.−0.2 μA h−1 (the inset of Fig. 4), which can be considered as the cleavage rate of S1/S2 hybrid by BamHI. The cleavage will be completed within 3 h since the height of the DPV peak of the label almost decreases to zero at that time.
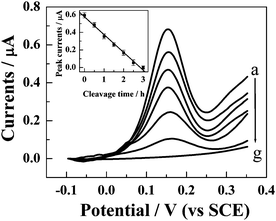 | ||
| Fig. 4 Dependence of the DPV responses of FcA–S1/S2-modified gold electrode on the cleavage time with BamHI. The cleavage time for curve (a) to (g) is 0, 0.5, 1, 1.5, 2, 2.5, and 3 h, respectively. The inset shows the plot of DPV peak current with cleavage time. The conditions for the DPV measurements are the same as those shown in the caption of Fig. 2. | ||
Optimization of the hybridization conditions
In order to obtain high sensitivity and good reproducibility for detection of HCV, the parameters of hybridization between S1 and S2 were optimized in this work since the response of FcA was significantly affected by the hybridization conditions.42 The effects of hybridization time, solution pH, temperature, and ionic strength (represented by the concentration of NaCl) on the response of the developed method were investigated. The response was independently measured five times at each condition and an average value was calculated. When one of the parameters was changed, the others remained unchangeable. The response was measured as the variation of DPV signal (Δi) of FcA before and after digestion with BamHI endonuclease. These results are shown in Fig. 5.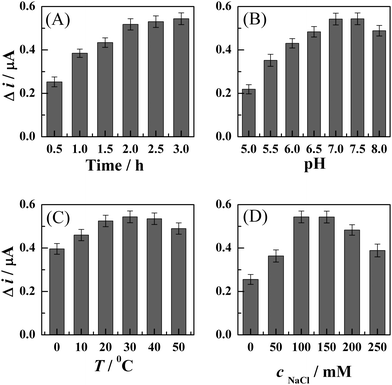 | ||
| Fig. 5 Dependence of the DPV responses of the FcA–S1/S2-modified gold electrode after cleavage by BamHI on the hybridization time (part A), solution pH (part B), hybridization temperature (part C), and ionic strength (part D). The ionic strength was represented by the concentration of NaCl. The response was independently measured five times at each parameter, and an average value was calculated. The response was represented as the variation of DPV signal (Δi) of FcA before and after digestion with BamHI endonuclease. | ||
The results (part A in Fig. 5) indicate that increasing the hybridization time leads to an enhancement in the response current (Δi). The response reaches a relatively stable value at ca. 2 h, and stays practically constant afterward. Therefore, a 2.5-h hybridization is selected to ensure that a completed hybridization can be achieved.
The solution pH and ionic strength of the hybridization system have significant effects on the hybridization process and the response of FcA. As shown in part B of Fig. 5, the response increases with the solution pH and reaches a plateau at the pH of 7.0–7.5, and then it decreases slightly with further increasing of solution pH. The value of Δi also enhances with the increasing of the concentration of NaCl up to 100–150 mM, after which it starts decreasing rapidly. Therefore, a solution pH of 7.0 and the NaCl concentration of 100 mM are considered as the optimal pH and ionic strength, respectively, for the hybridization system.
The effect of temperature on the hybridization of S1 and S2 is not significant as those of solution pH and the ionic strength. The value of Δi increases slightly with the increasing of hybridization temperature, and reaches a relatively stable value between the temperatures of 20–40 °C. The response decreases slightly when the hybridization temperature is higher than 40 °C. Thus, the physiological temperature (37 °C) is used for the hybridization of S1 and S2 in this work.
Detection of HCV
The interaction model of DNA–BamHI can also be applied to quantitatively detect the specific cDNA sequence related to HCV. To assess the analytical performance of the proposed model, the FcA–S1 modified gold electrode was hybridized with various concentrations of target cDNA (S2). The S1/S2 hybrid was then treated in BamHI cleavage mixture, and finally, the DPV response of FcA was recorded. As shown in part A of Fig. 6, the DPV peak currents of FcA label decrease with the increasing of the concentration of S2. The value of Δi increases linearly with S2 at lower concentration and then levels off at higher concentration (part B in Fig. 6). At a high concentration of S2, for example the concentration of S2 is higher than 8 μM, almost all the FcA-labeled S1 immobilized on the surface of gold electrode is hybridized with S2 and subsequently cleaved by BamHI. Therefore, almost all FcA molecules conjugated with S1 are removed after digestion with BamHI. Therefore, the value of Δi remains practically constant even though the concentration of S2 is further increased (part B in Fig. 6). The value of Δi has a linear relationship with the concentration of the S2 ranging from 0.05 to 4.0 μM with a correlation coefficient of 0.998. The linear range would be useful in the clinical analysis since the normal concentration of HCV RNA in serum or plasma analyzed in clinic is usually around 1.5–2.0 μM.5,7 The limit of the detection is estimated to be (0.5 ± 0.2) nM at an S/N (signal/noise) of 3.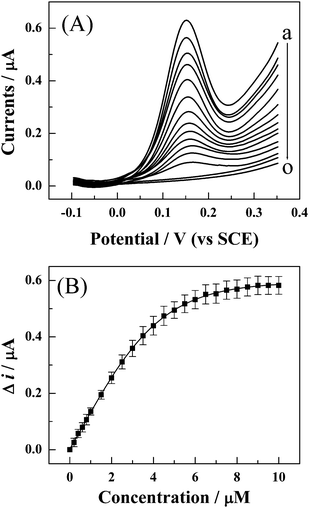 | ||
| Fig. 6 (A) The effects of the concentration of target DNA (S2) on the DPV response of the FcA–S1/S2-modified gold electrode after cleavage by BamHI. The concentration of S2 for the curve (a) to (o) is 0, 0.1, 0.5, 1.0, 1.5, 2.0, 2.5, 3.0, 4.0, 4.5, 5.0, 7.0, 9.0, and 10.0 μM, respectively. (B) The plot of value of Δi on the concentration of target DNA. Δi is the value of the DPV response of FcA before and after digestion with BamHI endonuclease. Every point is an average value of five independent measurements. | ||
Different aspects regarding the characteristics of the developed method were evaluated. The RSD (relative standard deviation) is ca.2.2% estimated from the DPV response of 3.0 μM of S2 obtained with five different and freshly fabricated detection systems, revealing an acceptable repeatability in the construction of the biosensor. The assay precision of this method was examined by five determinations at a S2 concentration of 3.0 μM. A RSD of ca.2.5% is obtained. The batch-to-batch repeatability is estimated with the slopes of calibration plots obtained from ten independent detection systems. The RSD of these slopes is ca.3.2%. These results demonstrate the great potential for practical application of the proposed model for the qualitative detection and quantitative analysis of HCV.
Real sample detection
The developed method was applied to HCV detection in real samples from sera patients. The sera samples were supplied by a hospital. The real samples containing HCV RNA were subjected to a reverse transcriptase reaction providing cDNA. A 244 bases HCV DNA (cDNA) fragment of know sequence was obtained by reverse transcriptase-linked polymerase chain reaction (RT-PCR) in the presence of a sense primer from commercial assay Amplicor® Hepatitis C Virus version 2.0 (Roche Molecular Diag. Co., USA). The obtained amplicons were initially evaluated using the standard qualitative Amplicor® HCV Test (microwell format with spectrophotometric detection, Amplicor® HCV Test Kit, version 2.0, Roche Molecular Diag. Co.) and further tested for hybridization with S1 probe and cleavage by BamHI using the developed method. The results demonstrate that the samples characterized as positive in the Amplicor® test are able to hybridize with S1 and the DPV signal of FcA label decreases significantly after cleavage by BamHI. However, those samples appearing as negative in the Amplicor® assay can't hybridize with S1 and the DPV peak current of FcA label remains almost unchangeable after cleavage by BamHI. Therefore, the proposed approach has a great potential for practical application to detect HCV in real clinical samples.Conclusions
In summary, a new approach for detection of HCV based on site-specific DNA cleavage of BamHI endonuclease has been developed. The detection is based on the variation of DPV signal (Δi) of redox label, which was immobilized on the 3′-terminus of probe DNA, before and after digestion with BamHI endonuclease. The major advantages of this enzymatic cleavage assay are its good specificity, ease of performance, and the ability to perform real-time monitoring. The developed method has a high selectivity with ability to discriminate the target DNA from single-base mismatched DNA sequence. It was demonstrated that the value of Δi has a linear relationship with the concentration of the HCV DNA (cDNA) ranging from 0.05 to 4.0 μM with a correlation coefficient of 0.998, and the detection limit of (0.5 ± 0.2) nM at a signal/noise of 3. Moreover, this method can also be used for detection of HCV in real clinical samples. The developed protocol can be taken as a general method of DNA detection and is expected to be applicable to other types of DNA analysis.Acknowledgements
This work is supported by the National Natural Science Foundation of China (20673057, 20773067, 20833006, and 20905036), the Program for New Century Excellent Talents in University (NET–06–0508), and the Foundation of the Jiangsu Education Committee (09KJA150001 and 09KJB150006).References
- P. Skládal, C. S. Riccardi, H. Yamanaka and P. I. Costa, J. Virol. Methods, 2004, 117, 145–151 CrossRef CAS.
- Q. L. Choo, A. J. Weiner, L. R. Overby, G. Kuo, M. Houghton and D. W. Bradley, Br. Med. Bull., 1990, 46, 423–441 Search PubMed.
- N. Fujita, S. Horiike, R. Sugimoto, H. Tanaka, M. Iwasa, Y. Kobayashi, K. Hasegawa, N. Ma, S. Kawanishi, Y. Adachi and M. Kaito, Free Radical Biol. Med., 2007, 42, 353–362 CrossRef CAS.
- K. Kiyosawa, T. Sodeyama, E. Tanaka, Y. Gibo, K. Yoshizawa, Y. Nakano, S. Furuta, Y. Akahane, K. Nishioka, R. H. Purcell and H. J. Alter, Hepatology, 1990, 12, 671–675 CrossRef CAS.
- H. Le Guillou–Guillemette and F. Lunel–Fabiani, Detection and Quantification of Serum or Plasma HCV RNA: Mini Review of Commercially Available Assays, in Hepatitis C: Methods and Protocols (2nd edn); H. Tang, Ed.; Humana Press: Totowa, NJ, 2009; Vol. 510, pp. 3–14 Search PubMed.
- W. P. Hofmann, V. Dries, E. Herrmann, B. Gartner, S. Zeuzem and C. Sarrazin, J. Clin. Virol., 2005, 32, 289–293 CrossRef CAS.
- T. Umemura, R. Y.-H. Wang, C. Schechterly, J. W.-K. Shih, K. Kiyosawa and H. J. Alter, Hepatology, 2006, 43, 91–99 CrossRef CAS.
- S. Erensoy, J. Clin. Virol., 2001, 21, 271–281 CrossRef CAS.
- S. C. Lee, A. Antony, N. Lee, J. Leibow, J. Q. Yang, S. Soviero, K. Gutekunst and M. Rosenstraus, J. Vlin. Microbiol., 2000, 38, 4171–4179 Search PubMed.
- Y.-C. Lin, M.-Y. Huang, K.-C. Young, T.-T. Chang and C.-Y. Wu, Sens. Actuators, B, 2000, 71, 2–8 CrossRef.
- R. C. Hollingsworth, P. Sillekens, P. Van Deursen, K. R. Neal and W. L. Irving, J. Hepatol., 1996, 25, 301–306 CrossRef CAS.
- M. Damen, P. Sillekens, H. T. M. Cuypers, I. Frantzen and R. Melsert, J. Virol. Methods, 1999, 82, 45–54 CrossRef CAS.
- A. Guichon, H. Chiaprelli, A. Martinez, C. Rodrigues, A. Trento, J. C. Russi and G. Carballal, J. Clin. Virol., 2004, 29, 84–91 CrossRef CAS.
- P. M. Richalet-Secordel, F. Poisson and M. H. V. van Regenmortel, Clin. Diagn. Virol., 1996, 5, 111–119 CrossRef CAS.
- D. OĭMeara, Z. B. Yun, A. Sonnerborg and J. Lundeberg, J. Clin. Microbiol., 1998, 36, 2454–2459.
- J. Griffin, A. K. Singh, D. Senapati, E. Lee, K. Gaylor, J. Jones-Boone and P. C. Ray, Small, 2009, 5, 839–845 CrossRef CAS.
- G. Bildan, M. Billon, T. Livache, G. Mathis, A. Roget and L. M. Torres-Rodriguez, Synth. Met., 1999, 102, 1363–1365 CrossRef CAS.
- C. S. Riccardi, K. Dahmouche, C. V. Santilli, P. I. da Costa and H. Yamanaka, Talanta, 2006, 70, 637–643 CrossRef.
- C. S. Riccardi, C. Kranz, J. Kowalik, H. Yamanaka, B. Mizaikoff and M. Josowicz, Anal. Chem., 2008, 80, 237–245 CrossRef.
- A.-E. Radi, J. L. A. Sánchez, E. Baldrich and C. L. O'Sullivan, J. Am. Chem. Soc., 2005, 128, 117–124.
- Y. Zhang, Y. Wang, H. Wang, J.-H. Jiang, G.-L. Shen, R.-Q. Yu and J. H. Li, Anal. Chem., 2009, 81, 1982–1987 CrossRef CAS.
- Z. Fang and S. O. Kelley, Anal. Chem., 2009, 81, 612–617 CrossRef CAS.
- X. Zhang, K. Jiao, S. Liu and Y. Hu, Anal. Chem., 2009, 81, 6006–6012 CrossRef CAS.
- J. S. Swensen, Y. Xiao, B. S. Ferguson, A. A. Lubin, R. Y. Lai, A. J. Heeger, K. W. Plaxco and H. T. Soh, J. Am. Chem. Soc., 2009, 131, 4262–4266 CrossRef CAS.
- K. J. Cash, A. J. Heeger, K. W. Plaxco and Y. Xiao, Anal. Chem., 2009, 81, 656–661 CrossRef CAS.
- B. Li, Y. Du, H. Wei and S. Dong, Chem. Commun., 2007, 3780–3782 RSC.
- J. Yuan, W. Guo, X. Yang and E. Wang, Anal. Chem., 2009, 81, 362–368 CrossRef CAS.
- H. X. Ju, Y. K. Ye and Y. L. Zhu, Electrochim. Acta, 2005, 50, 1361–1367 CrossRef CAS.
- C. Yao, T. Zhu, J. Tang, R. Wu, Q. Chen, M. Chen, B. Zhang, J. Huang and W. Fu, Biosens. Bioelectron., 2008, 23, 879–885 CrossRef CAS.
- H. T. Zhao and H. X. Ju, Electroanalysis, 2004, 16, 1642–1646 CrossRef CAS.
- M. Kobayashi, K. B. Takashi, M. Saito, S. Kaji, M. Oomura, S. Iwabuchi, Y. Morita, O. Hasan and E. Tamiya, Electrochem. Commun., 2004, 6, 337–343 CrossRef CAS.
- T. K. Ye, J. H. Zhao, F. Yan, Y. L. Zhu and H. X. Ju, Biosens. Bioelectron., 2003, 18, 1501–1508 CrossRef CAS.
- H. X. Ju, Y. K. Ye, J. H. Zhao and Y. L. Zhu, Anal. Biochem., 2003, 313, 255–261 CrossRef CAS.
- B. Meric, K. Kerman, D. Ozkan, P. Kara, S. Erensoy, U. S. Akarca, M. Mascini and M. Ozsoz, Talanta, 2002, 56, 837–846 CrossRef CAS.
- D. K. Xu, K. Huang, Z. H. Liu, Y. Q. Liu and L. R. Ma, Electroanalysis, 2001, 13, 882–887 CrossRef CAS.
- G. Nardone, J. George and J. G. Chirikjian, J. Biol. Chem., 1986, 261, 12128–12133 CAS.
- S. Krishnan, E. G. Hvastkovs, B. Bajrami, I. Jansson, J. B. Schenkman and J. F. Rusling, Chem. Commun., 2007, 1713–1715 RSC.
- Y. Jin, W. Lu, J. Hu, X. Yao and J. Li, Electrochem. Commun., 2007, 9, 1086–1090 CrossRef CAS.
- G. Piperberg, O. I. Wilner, O. Yehezkeli, R. Tel-Vered and I. Willner, J. Am. Chem. Soc., 2009, 131, 8724–8725 CrossRef CAS.
- F. Ricci, A. J. Bonham, A. C. Mason, N. O. Reich and K. W. Plaxco, Anal. Chem., 2009, 81, 1608–1614 CrossRef CAS.
- M. Fojta, T. Kubičárová and E. Palećek, Electroanalysis, 1999, 11, 1005–1012 CrossRef CAS.
- S. N. Liu, Y. J. Hu, J. Jin, H. Zhang and C. X. Cai, Chem. Commun., 2009, 1635–1637 RSC.
- A. Anne, A. Bouhardon and J. Moiroux, J. Am. Chem. Soc., 2003, 125, 1112–1113 CrossRef CAS.
- X. Luo, T. M.-H. Lee and I.-M. Hsing, Anal. Chem., 2008, 80, 7341–7346 CrossRef CAS.
- H. A. Kozlowska, B. E. Conway, A. Hamelin and L. Stoicoviciu, J. Electroanal. Chem., 1987, 228, 429–453 CrossRef.
- R. Szamocki, A. Velichko, C. Holzapfel, F. Mucklich, S. Ravaine, P. Garrigue, N. Sojic, R. Hempelmann and A. Kuhn, Anal. Chem., 2007, 79, 533–599 CrossRef.
- H. Qian and L. He, Anal. Chem., 2009, 81, 4536–4542 CrossRef CAS.
- R. Lao, S. Song, H. Wu, L. Wang, Z. Zhang, L. He and C. Fan, Anal. Chem., 2005, 77, 6475–6480 CrossRef CAS.
- A. B. Steel, T. M. Herne and M. J. Tarlov, Anal. Chem., 1998, 70, 4670–4677 CrossRef CAS.
- B. Hinsch and M.-R. Kula, Nucleic Acids Res., 1980, 8, 623–633 CrossRef CAS.
- L. E. Englerl, P. Sapienzal, L. F. Dorner, R. Kucera, I. Schildkraut and L. Jen-Jacobson, J. Mol. Biol., 2001, 307, 619–636 CrossRef.
- A. J. Bard and L. R. Faulkner, Electrochemical Methods: Fundamentals and Applications (2nd edn); John Wiley & Sons: New York, 2001 Search PubMed.
- F. Patolsky, Y. Weizmann and I. Willner, J. Am. Chem. Soc., 2002, 124, 770–772 CrossRef CAS.
- J. Wang, J. Li, A. J. Baca, J. Hu, F. Zhou, W. Yan and D.-W. Pang, Anal. Chem., 2003, 75, 3941–3945 CrossRef CAS.
- J. Liu, S. Tian, L. Tiefenauer, P. E. Nielsen and W. Knoll, Anal. Chem., 2005, 77, 2756–2761 CrossRef CAS.
- A. S. Georgopoulou, D. M. P. Mingos, A. J. P. White, D. J. Williams, B. R. Horrocks and A. Houlton, J. Chem. Soc., Dalton Trans., 2000, 2969–2974 RSC.
- E. Laviron, J. Electroanal. Chem., 1979, 100, 263–270 CrossRef CAS.
- K. Uosaki, Y. Sato and H. Kita, Langmuir, 1991, 7, 1510–1514 CrossRef CAS.
- C. Fan, K. W. Plaxco and A. J. Heeger, Proc. Natl. Acad. Sci. U. S. A., 2003, 100, 9134–9137 CrossRef CAS.
- W.-C. Liao and J. Ho, Anal. Chem., 2009, 81, 2470–2476 CrossRef CAS.
| This journal is © The Royal Society of Chemistry 2010 |
