DOI:
10.1039/B9AY00226J
(Paper)
Anal. Methods, 2010,
2, 387-392
Received
19th October 2009
, Accepted 10th January 2010
First published on
27th January 2010
Abstract
This paper reports the applicability of hollow fiber based liquid phase microextraction (HF-LPME) for the extraction of three anti-fungal drugs (Ketoconazole (KZ), Clotrimazole (CZ) and Miconazole (MZ)) from biological fluids. The drugs were extracted from 10 mL of the aqueous sample into an organic phase with microliter volume located inside the pores of a polypropylene hollow fiber, and then back extracted into 24 µL of a second aqueous solution (pH 2.5) located inside the lumen of the hollow fiber. The effects of organic solvent, stirring rate, salt concentration, pH of the source and receiving phases and extraction time on the extraction recovery were investigated and optimized. Under optimized conditions preconcentration factors for KZ, CZ and MZ were obtained as 133, 127.9 and 71, respectively. The calibration curves were linear (r2 ≥ 0.99) in the concentration range of 5.0–500 µg L−1 for both KZ and CZ and 8.0–500 µg L−1 for MZ. The limits of detections (LODs) for KZ, CZ and MZ were obtained as 0.9 µg L−1, 1.8 µg L−1and 4.0 µg L−1, respectively. The intra-day and inter-day RSD% based on 5 replicates were obtained as ≤6.3% and ≤12.1%, respectively. The method was successfully applied for determining the concentration of the drugs in plasma and urine samples.
Introduction
Antifungal drugs are widely used and commercially available in different pharmaceutical dosage forms and as veterinary products. Among the agents used most, the imidazolic group drugs (azole antifungals) are characterized by having a wide range of action. This category of drugs act by inhibition of cytochrome P450 lanosterol 14α-demethylase, thereby preventing the conversion of lanosterol to ergosterol as main esterole of the fungi wall.1–3 Currently no method has been reported for simultaneous determination of anti-fungal azoles in biological samples.
The occurrence of drug residues in the aquatic environment emerged as a matter of public concern after elevated levels of clofibric acid were found in some Berlin groundwater samples in 1992.4 Recently, increased efforts to monitor drug residues in such environments have shown that this is a widespread problem: many pharmaceutical compounds can frequently be found in the effluent of sewage treatment plants and river water at concentrations of up to several micrograms per liter.5 Therefore, developing very sensitive methods for monitoring of known organic contaminants and rapidly tracking down new contaminants in surface water is a matter of high priority.
Several analytical procedures such as liquid chromatography, thin layer chromatography (TLC), gas liquid chromatography (GC) and titrimetry have been proposed for the quantification of azole drugs in different biological samples.6–10 The analysis of drugs in a complex matrix such as plasma or urine without sample preparation is very difficult. Analyte extraction and pre-treatment are the most challenging and time-consuming steps in an analytical procedure. Many extraction procedures such as liquid-liquid extraction (LLE) and solid-phase extraction (SPE) techniques are available. However, LLE is time consuming and generally labour intensive and requires large quantities of expensive, toxic and environmentally unfriendly organic solvents. The conventional off-line SPE technique requires less solvent, but is relatively expensive.11 For the reduction of solvent usage in sample preparation, a miniaturized format of LLE, called liquid phase microextraction (LPME) has been introduced. Hollow fiber based LPME is a relatively new sample preparation technique that was introduced by Pedersen-Bjergaard and Rasmussen.12,13 HF-LPME can be performed in two- or three-phase modes. In two-phase HF-LPME, the analytes are extracted from an aqueous sample into an organic solvent immobilized in the pores of the hollow fiber and further into a new portion of organic solvent in the lumen of the hollow fiber.14 Alternatively, in three-phase HF-LPME, the analytes are extracted from an aqueous sample into an organic solvent immobilized in the pores of the hollow fiber and then into a new aqueous phase inside the lumen of the hollow fiber serving as the acceptor phase.15–17 In general, two-phase HF-LPME is applied for the analytes with a high solubility in non-polar organic solvents and three-phase HF-LPME is applied for the ionizable analytes. Moreover, prior to the extraction, it is necessary to adjust the sample pH for both two- and three-phase LPME, if the analytes are basic or acidic.18 In this study, three-phase HF-LPME followed by HPLC was applied for the determination of µg L−1 levels of Ketoconazole (KZ), Clotrimazole (CZ) and Miconazole (MZ) as model azole antifungals in some biological fluids (Table 1).
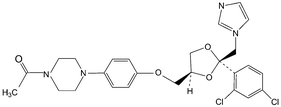
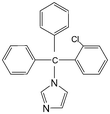
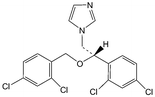
Table 1 The chemical structure, protein binding, LogP and pKa for KZ, CZ and MZ
Experimental
Chemicals
Standards of the drugs were kindly donated by the Department of Pharmaceutics of Tehran University (Tehran, Iran). The protein binding, logP (the octanol water distribution constant) and pKa (acidic equilibrium constant) for these drugs are shown in Table 1. HPLC-grade methanol and acetonitrile were purchased from Caledon (Ontario, Canada). Dihexyl ether was purchased from Merck (Darmstadt, Germany). The ultra-pure water used was purified on a model Aqua Max-Ultra Youngling ultra-pure water purification system (Dongan-gu, South Korea). All the other chemicals used were of reagent grade or the highest purity available.
Standard solutions and real samples
Stock standard solutions of KZ and CZ (1000 mg L−1) were prepared separately by dissolving proper amounts of each drug in methanol. The stock standard solution of MZ (1000 mg L−1) was prepared by dissolving its nitrate salt in methanol. The prepared stock solutions were stored at 4 °C in the fridge. The stock solutions were diluted with methanol to reach a secondary mixed stock solution with a concentration of 10 mg L−1. The working solutions were freshly prepared by diluting the mixed standard solution in ultra-pure water to the required concentration. The urine sample was collected from a healthy volunteer and sample preparation was performed immediately. The plasma sample was obtained from the Iranian Blood Transfusion Organization (Tehran, Iran) and stored at −20 °C prior to use. They were free from the drugs and spiked with a predescribed concentration of the drugs before analysis.
The pH of the tap water, urine and plasma samples was adjusted to 11.0 by drop addition of 2 M of NaOH solution. The spiked plasma samples were obtained by adding 20 µL of the working solutions with different concentrations to 1.0 mL of the drug-free plasma samples. In order to precipitate the proteins of the plasma samples, 2 mL of acetonitrile was added into 1.0 mL of the samples. The mixed solution was centrifuged for 20 min at 4100 rpm. After centrifuging, the supernatants (2.8 mL) were transferred into another vial and diluted to 10 mL. The urine samples were spiked with three drugs at various concentrations and diluted to 1:1 using ultra-pure water and subsequently their pH was adjusted to 11.0, then the formed precipitate in the solution was removed by centrifugation of the samples.
HPLC analysis
Separation and analysis of the extracted drugs from the aqueous samples were performed on HPLC system including a Varian 9012 HPLC pump (CA, USA), a six-port Cheminert HPLC valve from Valco (Houston, USA) with a 20 µL sample loop and equipped with a Varian 9050 UV-Vis detector. Chromatographic data were recorded and analyzed using Chromana software (version 3.6.4). An ODS-3 column (150 mm × 4.6 mm, with 3 µm particle size) from MZ-Analysentechnik Company (Mainz, Germany) was applied to separate the drugs under isocratic elution conditions. A mixture of acetate buffer (pH 4.5) and acetonitrile (25:75) at a flow rate of 0.9 mL min−1 was used as a mobile phase and the analytes were detected at 230 nm.
Accurel Q3/2 polypropylene hollow fiber with a wall thickness of 200 µm (0.2 µm pore size) and an internal diameter of 600 µm from Membrana (Wuppertal, Germany) was employed for LPME procedure. The hollow fiber was cut manually in 8 cm pieces, cleaned in acetone in an ultrasonic bath to remove any contaminants, and dried in air for use. Then 10 mL of the aqueous sample containing the analytes was poured into a 12 mL glass vial. The sample vial was placed on an IKA multi-position magnetic stirrer (Staufen, Germany) and a 25 µL Hamiltone syringe (Bondaduz, Switzerland) was applied to introduce the receiving phase into the hollow fiber. Before extraction, the microsyringe was rinsed 10 times with methanol to avoid carryover and air bubble formation. Twenty five microliters of the receiving phase (pH 2.5) was withdrawn into the microsyringe. Then, the microsyringe needle tip was inserted into the hollow fiber and the assembly was immersed in dihexyl ether for about 10 s to impregnate the pores of the hollow fiber. The fiber was inserted into the ultra pure water for 10 sec to wash extra organic solvent from the surface of the hollow fiber. Then, the receiving phase was introduced into the hollow fiber with slow pushing of the microsyringe plunger. Finally, the end of the hollow fiber was sealed by a piece of aluminum foil. The assembly was then directly immersed into the sample. For each extraction, a new configuration was used to avoid any possible memory effects. The extraction was carried out during the prescribed period of time. After extraction, the acceptor phase solution was retracted into the syringe and injected into the 20 µL loop of the HPLC system followed by analysis.
Calculations
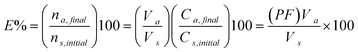
The extraction recovery for LPME was expressed as the percentage of total analyte amount, ns, initial (number of moles of the analyte originally present in the sample) transferred into the acceptor phase at the end of the extraction, na, final (number of moles finally collected in the receiving phase). The analyte preconcentration factor (PF) and the extraction percent (E%) were calculated by the following equations:
Where, Va and Vs are volumes of the receiving (24 µL) and source (10 mL) phases, respectively. Ca,final is the final concentration of the analyte in the receiving phase and Cs,initial is the initial concentration of the analyte in the sample.
Results and discussion
Optimization of LPME procedure
The extraction parameters including the extraction organic solvent, the pH of source and receiving phases, salt concentration, stirring rate and extraction time were optimized.
Selection of organic phase solvent
A crucial step in the hollow-fiber LPME is choosing the most suitable extraction solvent. An ideal organic solvent for HF-LPME should have the following criteria: (1) solubility of the analytes in the organic solvent should be higher than in the source phase but lower than in the receiving phase, (2) it should be non-volatile to prevent solvent loss during the extraction and (3) the solvent should be immiscible with both phases. Six solvents of n-dodecane, 1-octanol, 1-dodecanol, benzyl alcohol, methyl isobutyl ketone (MIBK) and dihexyl ether were investigated. HPLC peak areas of the drugs were evaluated for 40 min extraction period from 10 mL of ultra-pure water samples spiked at 100 µg L−1 of each target analyte and stirred at 800 rpm. Figure 1 shows that dihexyl ether provided the best extraction efficiency for the analytes. Therefore, dihexyl ether was selected as the optimum organic solvent for the HF-LPME of the drugs.
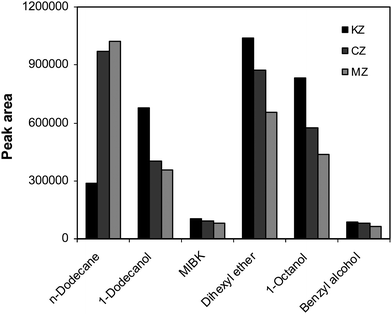 |
| | Fig. 1 The effect of organic solvent on the extraction of the drugs. Conditions: VSP = 10 mL of 0.0001 M NaOH (pH 10.0), CA = 100.0 µg L−1, VRP = 24 µL of 0.002 M HCl, stirring speed = 800 rpm and t = 40 min. | |
Effect of the pH of the source and receiving phases
The pH of both source and the receiving phases plays an important role in three-phase HF-LPME. For weakly basic drugs, the source phase should be alkaline to effectively deionize the analytes and consequently reduce their solubility in the source phase. The effect of the source phase pH on the extraction efficiencies of the drugs was investigated in the pH range of 8–12. According to the obtained results (Fig. 2), pH 11.0 was chosen as the optimum pH for the further extractions. The receiving phase should be acidic to ionize the drugs and to back extract them into the receiving phase. Therefore, the effect of the receiving phase pH on the extraction efficiency of the drugs was investigated in the pH range of 1.5–3. The hydrolysis of analytes at very acidic medium may be a reason for decreasing of the extraction efficiency.19 As shown in Fig. 2, the best extraction efficiency was observed at pH 2.5. At higher pHs, the extraction efficiency decreased, because the protonation reaction was not complete and a large portion of the analytes existed in neutral form.
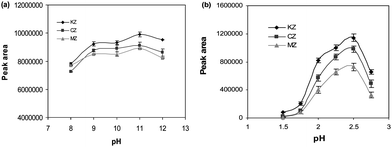 |
| | Fig. 2 The pH effect of (a) the source and (b) receiving phases on the extraction of the drugs. Conditions: (a) VSP = 10 mL, CA = 100.0 µg L−1, VRP = 24 µL, stirring speed = 800 rpm and t = 40 min; (b) VSP = 10 mL, CA = 100.0 µg L−1, VRP = 24 µL, stirring speed = 800 rpm and t = 40 min (in both of the experiments, dihexyl ether was used as organic solvent). | |
Effect of stirring rate
The stirring rate of the source phase affects the extraction efficiency as well as the physical stability of the organic solvent layer on the outside of the hollow fiber.20 Different stirring rates (from 200 to 1000 rpm) were tested to determine their effects on the extraction efficiency of the drugs. Figure 3 shows that the peak areas increased by increasing of the stirring rate and the maximum peak areas were obtained at the stirring rate of 800 rpm. At higher stirring rates (800 and 1000 rpm), due to the formation of air bubbles in the extraction vial and surrounding of the hollow fiber by them, the extraction efficiency of the drugs was decreased. Thus, the stirring speed of 800 rpm was applied in the subsequent experiments.
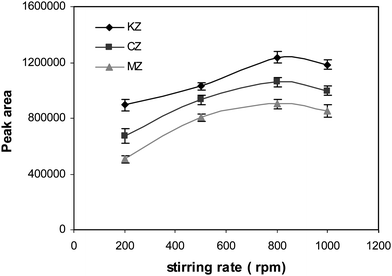 |
| | Fig. 3 The effect of stirring rate on the extraction efficiency of the drugs. Conditions: SP = 10 mL of 0.001 M NaOH (pH 11.0), CA = 100 µg L−1, RP = 24 µL of 0.003 M HCl, stirring speed = 800 rpm, t = 40 min and membrane solvent = dihexyl ether. | |
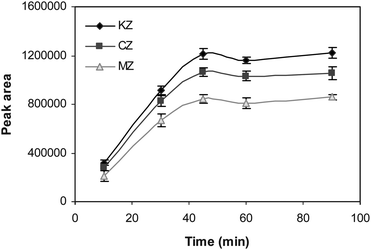 |
| | Fig. 4 The effect of the extraction time on the extraction efficiency of the drugs. Conditions: VSP = 10 mL of 0.001 M NaOH (pH 11.0), CA = 100 µg L−1, VRP = 24 µL of 0.003 M HCl (pH 2.5), stirring speed = 800 rpm and membrane solvent = dihexyl ether. | |
Effect of salt addition
For HF–LPME in aqueous solution, the addition of salt (such as NaCl or Na2SO4) can decrease the solubility of analytes and enhance their partitioning into the organic phase. The effect of ionic strength on extraction efficiency was studied by preparing the standard solutions of the analytes together with NaCl at the concentrations varying from 0–30% (w/v) (Fig. 5). Over the concentration range of 0–20% (w/v) extraction efficiency of KZ increased due to the salting out effect. The extraction efficiency decreased slightly for solution with 30% (w/v) salt because of changing physical properties of the Nernst diffusion layer on the hollow fiber and thereby reducing the diffusion rate of the analyte through the static layer to the thin organic layer on the fiber.21 Extraction efficiency of MZ decreased as a result of adding NaCl. It shows that the molecules of the MZ are stabilized by concentration of salt in the solution, so that MZ become more soluble in water. Also, at higher concentration of salt, changing of physical properties of Nernst layer leads to the lower extraction efficiency of MZ. The extraction efficiency of CZ is increased slightly by increasing of the salt concentration up to 5% (w/v) and decreased at higher salt concentration. The considerable structure differences between targeted analytes lead to various salt effects (salting out and in) on the extraction efficiencies of these analytes. Different behaviors in extraction efficiencies of a group of analytes in HF-LPME method have been reported before.22 Accordingly, the extractions were carried out from the samples containing 5% NaCl.
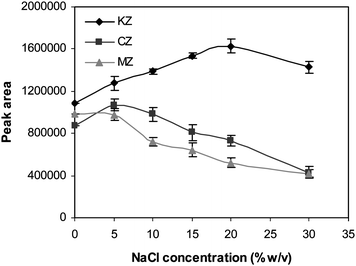 |
| | Fig. 5 The effect of salt addition on the extraction efficiency of the drugs. SP = 10 mL of 0.001 M NaOH (pH 11.0), CA = 100.0 µg L−1, RP = 24 µL of 0.003 M HCl, stirring speed = 800 rpm, t = 45 min and the membrane solvent = dihexyl ether. | |
Quantitative analysis
HF-LPME is not an exhaustive extraction method thus it is not expected to obtain high extraction efficiency. However, it should provide high preconcentration factor due to very low volume of the receiving phase.23 The figures of merit of the proposed method including linear dynamic ranges (LDRs), limit of detections (LODs) and extraction percentages of the drugs from the aqueous solutions were investigated under the optimum conditions. Calibration curves for KZ, CZ and MZ were established for the concentration range of 1–500 µg L−1. For each level, three replicate extractions were performed under the optimal conditions. The linearity of the proposed method was very good with the correlation of determination (r2) being greater than 0.99 (n = 9). The LODs based on S/N = 3 were reported at the range of 0.9–4.0 µg L−1 for different drugs. The preconcentration factors were determined as 133, 127.9 and 71 for KZ, CZ and MZ, respectively. The extraction percentage values were in the range of 17–32% (Table 2). The intra-day and inter-day RSDs for the drugs were less than 6.2% and 12.1%, respectively. The term inter-day RSD refers to relative standard deviations of replicate measurements during several days while, the term intra-day RSD refers to relative standard deviation of replicate measurements during one day. It is clear that inter-day RSDs are higher than intra-day RSDs.
| Analyte |
LOD (µg L−1) |
R2 |
LDR (µg L−1) |
PF |
Extraction (%) |
RSD% |
| Intra-day |
Inter-day |
|
All of the parameters were obtained based on 10 mL sample.
|
| KZ |
0.9 |
0.9903 |
5.0–500 |
133 |
32 |
2.2 |
9.1 |
| CZ |
1.8 |
0.9982 |
5.0–500 |
127.9 |
31 |
3.5 |
8.2 |
| MZ |
4.0 |
0.9907 |
8.0–500 |
71 |
17 |
6.3 |
12.1 |
Real sample analysis
In order to assay the applicability of the newly developed extraction system to the analysis of the drugs in the real samples with complex matrices, tap water, urine and plasma samples were extracted and analyzed using the proposed method under the optimum conditions. The sample preparation for the plasma and urine was performed according to Section 2.2. Since no drug was detected in the studied samples, different amounts of the drugs were added into the real samples and the extraction and determination procedure were performed. Table 3 shows that the results of three replicate analyses of each real sample obtained by the proposed method are in good agreement with the spiking amounts (error percents are located in the range of 0.8 to −7.6%). The proposed method showed a good reproducibility with the RSD values in the range of 2.1 to 11.3%. HPLC-UV chromatograms of the non-spiked, 15 µg L−1 spiked urine and 25 µg L−1 spiked plasma samples after the extraction with the proposed method are shown in Fig. 6. The chromatograms revealed a good clean up of the proposed approach to determine the drug concentrations in the urine and plasma samples. The present method was compared with the other methods in terms of validation and precision. As can be deducted, the method is quite comparable to those mentioned in Table 4.
Table 3 Determination of the drugs in different spiked samples
| Sample |
Ketoconazole |
Clotrimazole |
Miconazole |
|
The sample volume after dilution is 10 mL.
Concentration of the drugs in spiked sample.
Mean of three replicate measurements.
|
| Tap water |
| Cadded (µg L−1)a |
10 |
10 |
10 |
| Cfound (µg L−1)b |
9.7 |
9.9 |
9.8 |
| Error (%) |
−3.0 |
−1.0 |
−2.0 |
| RSD% c |
4.3 |
2.1 |
8.6 |
| Enrichment factor |
127 |
125 |
68 |
| Urine |
| Cadded (µg L−1)a |
25 |
25 |
25 |
| Cfound (µg L−1)b |
24.4 |
23.1 |
23.3 |
| Error (%) |
−2.4 |
−7.6 |
−6.8 |
| RSD% |
9.1 |
11.3 |
8.2 |
| Preconcentration factor |
89 |
97.7 |
52 |
| Plasma |
| Cadded (µg L−1)a |
25 |
25 |
25 |
| Cfound (µg L−1)b |
23.9 |
25.2 |
25.3 |
| Error (%) |
−4.4 |
0.8 |
1.2 |
| RSD% |
11.2 |
7.2 |
10.7 |
| Preconcentration factor |
20.1 |
24.5 |
31.3 |
Table 4 Comparison of the proposed method with other developed methods for the determination of target drugs
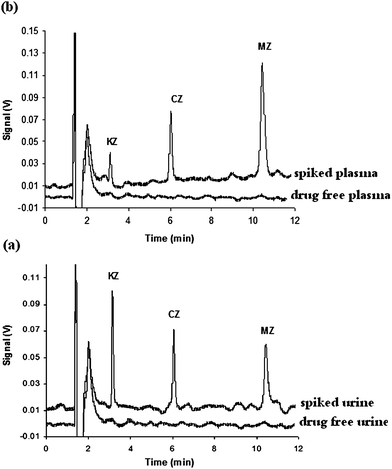 |
| | Fig. 6 HPLC-UV chromatograms of the non-spiked and spiked (a) urine and (b) plasma samples by 15 µg L−1 and 25 µg L−1of the target drugs, respectively, after HF-LPME. | |
Conclusions
The aim of the present work was to develop an efficient method for the simultaneous extraction, clean up and determination of trace amounts of anti-fungal drugs in biological and natural water samples. Three-phase hollow fiber liquid phase microextraction was used to obtain high clean up and good preconcentration factors for the extraction of ketoconazole, clotrimazole and miconazole. Due to simplicity and low cost of the extraction device, the hollow fiber can be discarded after each extraction to avoid carry over cross contamination. This serves to maintain reasonable intra-day and inter-day RSDs. The parameters related to the three phase HF-LPME, including organic solvent, stirring rate, salt concentration, pH of the source and receiving phases and extraction time were optimized using one variable at a time. Finally, the developed method was applied for the extraction of target drugs from the tap water, plasma and urine samples. Accordingly, it was concluded that HF-LPME is an effective method to extract and preconcentrate anti-fungal drugs from biological and natural water samples prior to HPLC analysis.
References
- J. C. Gallagher, E. S. Dodds Ashley, R. H. Drew and J. R. Perfect, Expert Opin. Pharmacother., 2003, 4, 147–164 Search PubMed.
- M. V. Vertzoni, C. Reppas and H. A. Archontaki, J. Chromatogr., B: Anal. Technol. Biomed. Life Sci., 2006, 839, 62–67 CAS.
- J. S. Hostetler, L. H. Hanson and D. A. Stevens, Antimicrob. Agents. Chemother., 1992, 36, 477–480 CAS.
-
W. Forth, D. Henschler, W. Rummel, K. Starke, Allgemeine und spezielle Pharmakologie und Toxikologie, sixth ed., issenschaftsverlag, Mannheim, Leipzig, Vienna, Zurich, 1992 Search PubMed.
- R. Hirsch, T. Ternes, K. Haberer and K. L. Kratz, Sci. Total Environ., 1999, 225, 109–118 CrossRef CAS.
- M. Kobylińska, K. Kobylińska and B. Sobik, J. Chromatogr., B: Biomed. Sci. Appl., 1996, 685, 191–195 CrossRef CAS.
- P. H. Roberts and P. Bersuder, J. Chromatogr., A, 2006, 1134, 143–150 CrossRef CAS.
- S. Bajad, R. K. Johri, K. Singh, J. Singh and K. L. Bedi, J. Chromatogr., A, 2002, 949, 43–47 CrossRef CAS.
- A. S. Low and J. Wangboonskul, Analyst, 1999, 124, 1589–1593 RSC.
- R. Hájková, H. Sklenářová, L. Matysová, P. Švecová and P. Solich, Talanta, 2007, 73, 483–489 CrossRef CAS.
- S.-P. Huang and S.-D. Huang, J. Chromatogr., A, 2007, 1176, 19–25 CrossRef CAS.
- K. E. Rasmussen and S. Pedersen-Bjergaard, Anal. Chem., 1999, 71, 2650–2656 CrossRef CAS.
- K. E. Rasmussen and S. Pedersen-Bjergaard, TrAC, Trends Anal. Chem., 2004, 23, 1–10 CrossRef CAS.
- K. E. Rasmussen, S. Pedersen-Bjergaard, M. Krogh, H. G. Ugland and T. G. Halvorsen, J. Chromatogr., A, 2000, 873, 3–11 CrossRef CAS.
- T. G. Halvorsen, S. Pedersen-Bjergaard and K. E. Rasmussen, J. Chromatogr., A, 2001, 909, 87–93 CrossRef CAS.
- H. Ebrahimzadeh, Y. Yamini, A. Sedighi and M. R. Rouini, J. Chromatogr., B: Anal. Technol. Biomed. Life Sci., 2008, 863, 229–234 CrossRef CAS.
- N. Larsson, E. Petersson, M. Rylander and J. Å. Jönsson, Anal. Methods, 2009, 1, 59–67 RSC.
- C. Yang, L. Guo, X. Liu, H. Zhang and M. Liu, J. Chromatogr., A, 2007, 1164, 56–64 CrossRef CAS.
- E. M. Abdol-Moety, F. I. Khattab, K. M. Kelani and A. M. AbouAl-Almein, Il Farmaco, 2002, 57, 931–938.
- S. M. Richoll and I. Colon, J. Chromatogr., A, 2006, 1127, 147–153 CrossRef CAS.
- M. Palit, D. Pardasani, A. K. Gupta and D. K. Dubey, Anal. Chem., 2005, 71, 711–717 CrossRef.
- J.-S. Chiang and S.-D. Huang, Talanta, 2007, 71, 882–886 CrossRef CAS.
- N. Vadisak and P. Varanusupakul, J. Chromatogr., A, 2006, 1121, 236–241 CrossRef CAS.
- F. Wienen, S. Laug, K. Baumann, A. Schwab, S. Just and U. Holzgrabe, J. Pharm. Biomed. Anal., 2003, 30, 1879–1887 CrossRef CAS.
- J.-B. Gordien, A. Pigneux, S. Vigouroux, R. Tabrizi, I. Accoceberry, J.-M. Bernadou, A. Rouault, M.-C. Saux and D. Breilh, J. Pharm. Biomed. Anal., 2009, 50, 932–938 CrossRef CAS.
|
| This journal is © The Royal Society of Chemistry 2010 |
Click here to see how this site uses Cookies. View our privacy policy here.