Single wavelength check isocratic reverse phase HPLC method for fast and direct estimation of alkyl aromatic oxidation products
Pradip
Munshi
*,
S. Muthukumaru
Pillai
and
G. S. Srinivasa
Rao
Research Centre, Reliance Technology Group, Reliance Industries Limited, Vadodara Manufacturing Division, P.O. – Petrochemicals, Vadodara, Gujarat 391346, India. E-mail: pradip.munshi@ril.com; Fax: +91 265 6693934; Tel: +91 265 6696049
First published on 26th January 2010
Abstract
An isocratic, reverse phase liquid chromatographic method has been developed for the quantitative determination of p-xylene oxidation products. The method represents a direct and fast analytical procedure to determine the assay. Separation is achieved on Waters μ-Bondapak C18, 300 mm × 3.9 mm × 10 μm column in a single wavelength 230 nm. The method has been validated with respect to linearity, limit of quantification, accuracy and robustness. Critical impurity 4-carboxy benzaldehyde (4-CBA) is found to be within the limit of quantification, 8 ppm, accuracy 97–98%, recovery 98 to 101% and resolution 1.97 from the closest peak. The sample solution is stable and can be used safely within 48 h. The method is verified by real sample reaction mixture.
Introduction
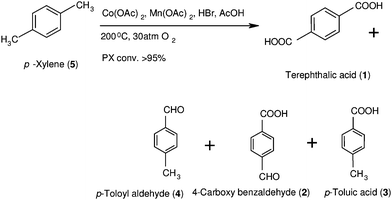
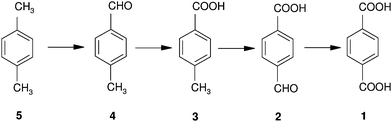
Oxidation of alkyl aromatics proceeds with stepwise oxidation via alcohol, ketone or aldehyde and acid, generating a number of products having different functionalities. This produces products of a wide range of polarity, which is reflected in their solubility and UV absorption (λmax). Analyses of reaction mixtures containing alkyl aromatic oxidation products are therefore difficult. Gradient mode of elution and diode array detectors to overcome the variation in solubility and λmax are employed in liquid chromatography (LC). This method, although time consuming, is found to be the most fruitful so far reported for analyses of these reaction mixtures. A diode array detector however restricts the use of a universal UV detector. Therefore, in order to obtain fast analysis, direct analysis of the reaction mixture in isocratic mode at single wavelength is most desirable.In this study p-xylene oxidation products (PXOX) are chosen for developing the analytical method. Considering terephthalic acid is an essential industrial material, this analysis will have a significant contribution, especially to the polyester industries. An increasing need for polyesters is keeping the production of purified terephthalic acid (PTA) always in demand. PTA is produced by liquid phase oxidation of p-xylene in acetic acid medium at a temperature of 200 °C and air pressure of 30 atm, using Co, Mn acetate catalysts in the presence of HBr (Scheme 1).1 Conversion of p-xylene is high but due to vigorous reaction conditions impurity generation exceeds its permissible level. Another reason for generation of impurities is likely due to stepwise oxidations involving several intermediates (Scheme 2). In a typical oxidation of p-xylene, using cobalt and manganese acetates as catalysts, terephthalic acid as product and p-toloyl aldehyde, p-toluic acid and p-carboxy benzaldehyde as impurities are produced.2
 | ||
| Scheme 2 Stepwise oxidation of p-xylene to terephthalic acid. | ||
Presence of these impurities in terephthalic acid is undesirable, because they slow down the polymerization process of polyester formation from ethylene glycol and PTA. They also impart coloration in the polymer. This effect is predominantly caused by p-carboxybenzaldehyde (4-CBA). The concentration of 4-CBA is therefore critically required to be maintained at level of <20 ppm. So in-process analysis to know the level of impurities generated is highly desirable.
A number of techniques are available to analyze PXOX by means of polarography,3 gas chromatography,4 electrophoresis,5 and liquid chromatography.6 But these procedures are time consuming because two independent techniques are employed to arrive at total analysis. In addition, these methods run in a gradient elution mode and require analysis at more than one wavelength (λmax).
Basically a series of products are generated during oxidation of p-xylene due to successive oxidations of methyl groups. The UV absorption maxima (λmax) for these oxidative products vary largely from one to other. So a fixed λmax may not cover all the products present in the reaction mixture. In addition, response of all components in single analytical tool may not be equal and therefore may cause problem, especially in case of components of very low sensitivity. These make more than one method of analysis or analytical tool to employ for estimation of all the components in reaction mixture.
The method presented in this paper exceptionally covers all the possible components of PXOX. So the present study reports the analysis of Liquid phase oxidation products of p-xylene in an isocratic mode by RP-LC method at single weave length and ambient temperature. Mixture of terephthalic acid (1), 4-carboxy benzaldehyde (2), p-toluic acid (3), p-toloyl aldehyde (4) and p-xylene (5) is analyzed. Level of quantitation (LOQ) for critical impurity 4-CBA is 10 ppm. The method may also be suggested to analyze the samples in periodic time intervals. To the best of our knowledge this is the first isocratic method that used a single wavelength for fast and direct analysis of PXOX. Results are verified by real reaction mixtures for authentication of the above findings.
Experimental
Reagents and chemicals
Analytical grade terephthalic acid, p-carboxybenzaldehyde, p-toluic acid, terephthaldehyde and p-xylene were purchased from Aldrich chemical company (USA). The solvents acetonitrile and DMSO used in this study were HPLC grade and purchased from J. T. Baker (USA). Water was purified by Milli-Q water purification system (Millipore, Billerica, MA). Acetic acid and tetraethyl ammonium hydroxide were purchased from Fluka (Buchs, Switzerland). Real sample mixtures RX-1 and RX-2 were obtained from in-house manufacturing unit as a gift.Apparatus
The experiments were conducted in Waters HPLC system (model CM4000), Applied Biosystems Div., Foster City, CA, USA), equipped with UV-Vis detector (model SM 4000) and Waters 745 B data module integrator. Samples were introduced by manual injection.Chromatographic condition
The separation was obtained in Waters μ-Bondapak C18 (300 mm × 3.9 mm × 10 μm) column while 1![[thin space (1/6-em)]](https://www.rsc.org/images/entities/char_2009.gif) :1 (v/v) mixture of acetonitrile and 0.5% aqueous acetic acid solution (w/v) was used as the mobile phase. Optimum separation was achieved at flow rate 0.7 mL min−1. The detection wavelength was fixed at 230 nm. The developed RP-LC method was validated with respect to specificity, linearity, accuracy and robustness. pH of mobile phase was checked and maintained at a range of 4–6. At ambient temperature, 1 mL sample of 100 ppm (in diluent) was injected every time with 20 μL injection loop. Mobile phase was filtered through a 0.45 μm filter paper after degassing through a sonicator. The chromatographic runtime was set at 30 min.
:1 (v/v) mixture of acetonitrile and 0.5% aqueous acetic acid solution (w/v) was used as the mobile phase. Optimum separation was achieved at flow rate 0.7 mL min−1. The detection wavelength was fixed at 230 nm. The developed RP-LC method was validated with respect to specificity, linearity, accuracy and robustness. pH of mobile phase was checked and maintained at a range of 4–6. At ambient temperature, 1 mL sample of 100 ppm (in diluent) was injected every time with 20 μL injection loop. Mobile phase was filtered through a 0.45 μm filter paper after degassing through a sonicator. The chromatographic runtime was set at 30 min.
The column was conditioned first for 30 min before running the actual analysis with the mobile phase.
Sample preparation
A 1:4 mixture of acetonitrile and 0.53 wt% NEt4OH aqueous solution was used as diluent for sample preparation.
Standard solutions
The stock solutions of each standard (500 ppm) material were prepared by dissolving appropriate amounts in the diluent. A working solution of 100 ppm was prepared from above stock solutions. The solutions for components 1, 2, 3, 4 and 5 are labeled as A1, A2, A3, A4 and A5. Similarly solution B, of mixture 1, 2, 3, 4 and 5, prepared at 100 ppm concentration for related substance study from a stock solution of 500 ppm.System suitability
System suitability of the method was checked for the parameters retention time (Rt), resolution (Rs) asymmetry factor (Af) and theoretical plate number (N) of the peak. RSD values based upon 5 injections were considered. Rt was obtained from the instrument at which the respective peaks eluted. Rs of adjacent peak was calculated by using formula Rs = 2(T2 − T1)/(W1 + W2). T1 and T2 are the retention time of two peaks and W1 and W2 are the base width of two peaks. Af of peak was determined by using the formula Af(asymmetry factor) = B100%h (right width at 100% height)/A100%h(left width at 100% height). N was calculated by using formula N = 5.55 (Rt/W1/2)2, W1/2 is width at half height.Method validation
Precision of the method was checked by injecting five times, six different concentrations (10, 20, 40, 60, 80 and 100 ppm) of each solution A1 to A5. RSDs of respective peak area and retention time were considered for precision of the method.Limit of detection (LOD) and limit of quantitation (LOQ) levels were evaluated from injections of a series of dilute solutions (A1 to A5) of known concentrations till signal-to-noise ratios reach 3:1 and 10:1 for LOD and LOQ respectively.7
The linearity range (RLn) was tested at six different concentration levels (5 ppm, 10 ppm, 25 ppm, 55 ppm, 75 ppm and 110 ppm) for the solution A2, consisting of critical impurity 4-CBA. For solutions A1, A3 and A4 concentrations were fixed at 10 ppm, 20 ppm, 50 ppm, 75 ppm, 100 ppm and 120 ppm. Each solution was injected in duplicate and mean area was considered. Peak area obtained for each component was plotted against respective concentrations and performed least-squares linear regression (R2) analysis. Closeness of regression value to 1 represents extent of proportionality of peak area and amount of component. Regression and Y intercept obtained accordingly. For solution A5 the linearity range (RLn) was tested 50, 75, 100, 120, 150, 200 ppm in similar manner.
The accuracy was checked in triplicate for solution B in three concentrations levels i.e. 50 ppm, 75 ppm and 100 ppm. Mean area obtained for each component in each concentration was compared with respect to the concentrations in linearity plot. The value reported as % accuracy (%Ac) of actual concentration against concentrations obtained from linearity plot.
Recovery of the method was examined by adding three different concentrations 50 ppm, 75 ppm and 100 ppm of 1, 2 and 3 to respective solutions A1 to A3 of 100 ppm. The final concentration of each solution was estimated from the area increase in each injection using linearity plot. The actual concentration increase versus what was obtained from the plot is reported as % recovery (% Rc). Each solution was injected in duplicate and the mean area was considered.
Purposeful variation of resolutions (Rs), retention time (Rt) and plate number (N) upon changing method parameters was carried using solution B to study robustness. Thus flow of ±10% analyte concentration and mobile phase ratio (A:B) of 45:55 and 55:45 were varied with respect to original values.
Solution stability and mobile phase stability
Solution B was kept in a tightly capped container and left for 48 h at 27–28 °C at ambient condition in the laboratory away from direct sunlight. Retention time, resolution, asymmetry factor, and peak area was examined. A comparative study on the above parameters every 6 h was conducted.Analysis of real sample reaction mixtures
Sample RX-1 and RX-2 were received as two samples of real sample reaction mixtures. 100 ppm of RX-1 was repeated as described above in diluent and analysed in the aforesaid chromatographic condition. Sample RX-2 was similarly analysed. Estimation of critical impurity, 2, was determined by an external standard method.Results and discussion
The main purpose of the present study was to develop a robust chromatographic method for the single step analysis of p-xylene oxidation products. Separation was achieved on a Waters μ-Bondapak C18, 300 mm × 3.9 mm × 10 μm column, by using 1:1 mixture of acetonitrile and 0.5% aqueous acetic acid solution as mobile phase. System suitability results were given in Table 1 on basis of retention time (Rt), resolution (Rs), asymmetry factor (Af) and number of theoretical plates (N). Rt is considered as the characteristic time it takes for respective analyte to pass through the system under set conditions. Repeated injections show consistency in the retention time. The minimum value of Rs, determines the ability of the column to separate chromatographic peaks at a given condition, is observed to be 1.97, between 1 and 2. Af, the factor describing the deviation from being perfectly symmetrical peak of value 1, defines the shape of chromatographic peak. Af of the peaks was found to be very close to 1 indicating the symmetrical nature of the peaks. Table 1 also represents the high efficiency of the column at given conditions, signified by N, the number of hypothetical zones in which mobile and stationary phases are in equilibrium with each other.
| Analyte | Rt | Rs | Af | N |
|---|---|---|---|---|
| a Rt = Retention time; Rs = Resolution; Af = Asymmetry factor; N = Number of theoretical plate. | ||||
| Terephthalic acid (1) | 4.47 | 1 | 1000 | |
| 4-Carboxybenzaldehyde (2) | 5.58 | 1.97 | 1.04 | 2597 |
| p-Toluic acid (3) | 7.32 | 3.32 | 1.01 | 2304 |
| p-Toloyl aldehyde (4) | 9.99 | 4.7 | 0.99 | 5771 |
| p-Xylene (5) | 21.01 | 15.72 | 1 | 9823 |
Thus at the given chromatographic conditions all the components (1 to 5) are well separated with high efficiency of the symmetrical peaks (Fig. 1).
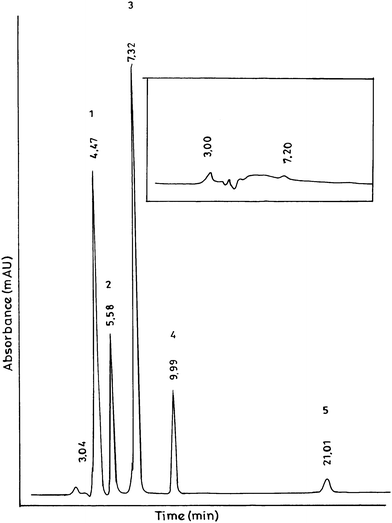 | ||
| Fig. 1 HPLC chromatogram of standard mixture of terephthalic acid (1), 4-carboxy benzaldehyde (2), p-toluic acid (3), p-toloyl aldehyde (4) and p-xylene (5) as p-xylene oxidation reaction mixture. Inset shows blank run. Concentration of each component is kept at 100 ppm. | ||
Individual solutions, as described in the experimental, of the components were made instead of their mixture, to avoid any possible reactions that may occur among the components, which were unfamiliar to us at the beginning. Moreover, initially, the relative response of each component was unknown to us. So be the analysis was begun with individual solutions only.
Method validation
The method was validated based upon precision, linearity, recovery, accuracy and robustness studies.7Precision studies on retention time and area obtained by repeated injections of 1–5 show a relative standard deviation (RSD) value within 2, indicating good precision of the method.
The limit of detection (LOD) and the limit of quantitation (LOQ) of analytes 1–5 are within the required limit of specification (20ppm).
Linearity of the method is observed in the concentrations 5 ppm, 10 ppm, 25 ppm, 55 ppm, 75 ppm and 110 ppm for critical impurity 4-CBA, 2. A plot of concentration versus area shows a linear relationship with regression (R2) 0.9967. The plot also provides the linearity range of concentrations 10 to 110 ppm (Fig. 2) for 4-CBA. This helped us to fix the concentrations of linearity (10 ppm, 20 ppm, 50 ppm, 75 ppm, 100 ppm and 120 ppm) to be tested for the rest of the components 1, 3, 4 and 5. Regression (R2) values, generated from the straight line obtained by plotting concentration versus area, in all components are greater than 0.99, indicating direct proportionality of concentration to the amount of analyte. One representative plot for 2 is shown in Fig. 2.
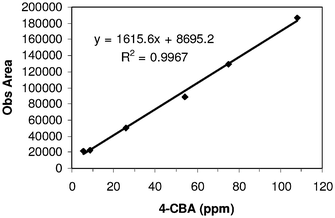 | ||
| Fig. 2 Linearity plot of 2 in concentration range 5 ppm to 110 ppm following a linear equation Y = 1615.6 X + 8695.2. | ||
Accuracies shown in Table 2 for all components are within ± 3%. Recovery of all components in three different concentrations were found within the range of 98.0 to 101.0. Such high accuracy signifies that the method can be used for in-process testing.
| Analyte | RLn/ppm | R2 | LOD/%, w/v, × 105 | LOQ/%,w/v, × 104 | Ac/% | R/% | ||
|---|---|---|---|---|---|---|---|---|
| 50/ppm | 75/ppm | 100/ppm | ||||||
|
a Column Waters μ-Bondapak C18 (300 mm × 3.9 mm × 10 μm), Mobile phase 1:1 (v/v) mixture of acetonitrile and 0.5% (w/v) aqueous acetic acid solution, flow rate 0.7 mL min−1, detection wavelength 230 nm. pH of mobile phase in range of 4–6, temperature ambient, sample injected 1 mL of 100 ppm (in diluent), injection volume 20 μL, chromatographic runtime was set at 30 min.
|
||||||||
| 1 | 10–100 | 0.998 | 4 | 8 | 98.7 | 99.0 | 98.8 | 99.0 |
| 2 | 10–100 | 0.996 | 5 | 1 | 98.2 | 101.5 | 99.5 | 99.6 |
| 3 | 10–100 | 0.996 | 4 | 6 | 97.7 | 101.0 | 100.3 | 101.0 |
| 4 | 10–100 | 0.997 | 6 | 2 | 96.9 | — | — | — |
| 5 | 50–100 | 0.996 | 2 | 5 | 97.3 | — | — | — |
Robustness is considered as a measure of the method to be capable of tolerating deliberate variations in parameters. It can partly be assured by good system suitability specifications. It is found that the parameters in specified range of variations do not affect the analysis adversely. Rs remains ∼1.8 (between 1 and 2), asymmetry factor of all the peaks is less than 1.2. Little variation in retention time is observed during change of flow and mobile phase ratio, but remains within ±15%.
Solution stability and mobile phase stability
Stability studies illustrate the deformation of chemical composition over time in the sample solution prepared. This helps to have an idea between sample collection and actual time when analyzing. Area obtained under terephthalic acid over time remains within the RSD value of 0.5%, showing virtually no change. Related substances are also found merely unchanged. Absence of any extra peak dictates that all the chemicals are compatible with each other and no detectable reactions occurred generating a substance that gets separated in present chromatographic conditions.Real sample analysis
Fig. 3 represents the chromatogram of two real samples [(a) RX-1, (b) RX-2], LOQ of standard mixture [(c) RX-LOQ] and a blank solution [(d) Blank]. It can be seen that all the peaks shown in Fig. 3 (a), (b) and (c) are different from the blank. Also, the analyses of real samples are replica of the standard one (Fig. 1) with similar retention time of the respective components. Analysis at LOQ in Fig. 3 (c) represents the measurable peaks that are visibly distinguishable from blank.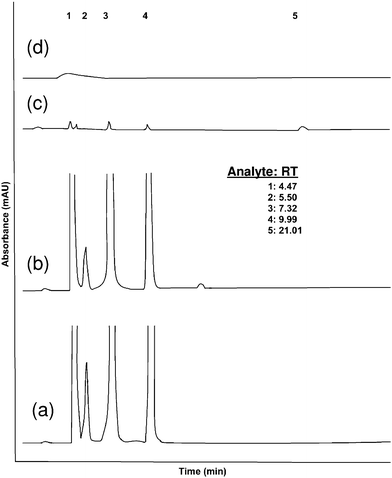 | ||
| Fig. 3 HPLC chromatogram of (a) real sample mixture (RX-1), (b) real sample mixture (RX-2), (c) standard sample at LOQ and (d) blank. RT represents retention time. 1, 2, 3, 4, and 5 represents the analytes terephthalic acid, 4-carboxy benzaldehyde, p-toluic acid, p-toloyl aldehyde and p-xylene respectively. 4-CBA concentration is found to be 276 ppm in RX-1 and 254 ppm in RX-2. | ||
RX-1 is generated as per normal Mid Century (MC) oxidation process involving Co(OAc)2 and Mn(OAc)2 as catalysts, 200 °C temperature and 30 atm oxygen (O2) pressure in acetic acid medium using HBr as promoter. On the other hand, RX-2 was generated at the higher temperature of 250 °C. It is revealed from Fig. 3 (a) and (b) that a rise in temperature lowers the 4-CBA concentration by promoting it to complete oxidation, but this may generate impurities as an extra peak appears at RT 14.2 min. This extra peak is also observed when high oxygen pressure is employed. HBr, as very reactive promoter, makes intermediates or transition states more prone to generate impurities in vigorous conditions. So the method presented here may also respond if any variation occurred in the manufacturing process.
4-CBA concentrations, 276 ppm and 254 ppm, were determined by the present method in both the samples that show close comparison with the values, 280 ppm and 255 ppm, obtained from the external method already practiced for sample RX-1 and RX-2 respectively.
Based on the previous discussion and the results presented (in Fig. 1 and 3) the method may be useful for analysis at periodical time intervals. Nevertheless, due to the high efficiency of the method, it may also be applicable to determining the OXOX components in polyester formation processes, provided the polymer is separated from rest.
Conclusions
The isocratic, single wavelength check RP-LC method developed for the assay and related substance determination of p-Xylene oxidation products are precise, accurate and specific. The method is validated by precision, linearity, recovery, accuracy and robustness studies. The solution prepared is found to be stable for 48 h. This method can also be used for routine analysis.Acknowledgements
The authors would like to acknowledge Mr G. Mehta for carrying out the work, Dr R. V. Jasra, Head, RTG, VMD for technical support and Reliance Industries Ltd. for financial supportReferences
- R. J. Sheehan, Ullmann's Encyclopedia of Industrial Chemistry; 2002, Wiley-VCH, Germany Search PubMed.
- S. J. Yoo, J. S. Hwa and L. K. Hwa, Appl. Catal., A, 2002, 223, 239 CrossRef CAS.
- V. J. Koshy, J. V. Prasad, G. Kalpana and S. Satish, Anal. Chim. Acta, 1995, 307, 55 CrossRef CAS.
- G. Cao, D. P. Cavalien, E. Danoczy and P. Roffia, Oxidation Comm., 1980, 1, 153 Search PubMed.
- M. L. L. Moraesa, J. C. Rubim, R. R. Realpozob and M. F. M. Tavares, J. Braz. Chem. Soc., 2004, 15, 400.
- A. Viola and G. Cao, J. Chromatographic Science, 1996, 34, 27 Search PubMed.
- ICH draft Guidelines on Validation of Analytical Procedures: Definitions and Terminology, Federal register, 1995, vol.60, pp.11260. IFPMA, Switzerland Search PubMed.
| This journal is © The Royal Society of Chemistry 2010 |