A simple assay for analyzing residues of carbaryl insecticide in buffalo meat by liquid chromatography–photodiode array detection
Ashim K.
Biswas†
*a,
Napa
Kondaiah
a,
Anne Seeta
Ram Anjaneyulu
a,
Gadam Setty
Rao
b and
Ram Prakash
Singh
c
aDivision of Livestock Products Technology, Indian Veterinary Research Institute, Izatnagar, Bareily, 243122, UP, India. E-mail: biswaslpt@gmail.com; Fax: +91-161-2400822; Tel: +91-161-2414025
bDivision of Pharmacology and Toxicology, Indian Veterinary Research Institute, Izatnagar, Bareily, 243122, UP, India
cDivision of Livestock Products Technology, Division of Post Harvest Technology, CARI, Izatnagar, Bareilly, 241 122, UP, India
First published on 3rd February 2010
Abstract
A simple and sensitive liquid chromatographic (LC) method was developed for determination of carbaryl residue in buffalo meat samples. This method is based on a solid-phase extraction technique followed by high-performance liquid chromatography (HPLC)–photo-diode-array (PDA) detection. Meat samples (0.5 g) were deproteinized by adding acetonitrile followed by centrifugation and filtration. The analyte was separated on a reverse-phase (RP-C18) column using isocratic elution. Acetonitrile along with water appears to be an excellent extractant as recovery of the analyte in spiked sample at maximum residue level (MRL) was 98.5%, with coefficient of variation (CV) of 4.97%. The limit of detection (LOD) and limit of quantification (LOQ) of the method was 0.015 and 0.03 μg g−1, respectively. The linearity of the carbaryl was 0.9992. Excellent method repeatability and reproducibility were also observed by intra- and inter-day assay precision. For robustness, the method was employed to analyze 122 buffalo meat samples, and intensities for the insecticide were found to be unaffected by the sample matrices interference.
Introduction
Carbaryl insecticide is one of the most extensively used chemicals in agriculture for crop protection, as an ectoparasiticide, and for regular household practices.1 The reason for this is that it proves to have high and broad insecticidal efficacy but low toxicity towards a variety of warm-blooded animals. In addition, this compound is less persistent than organochlorine pesticides and produces fewer or no toxicological products.2 However, the presence of residues of carbaryl in meat is of toxicological and regulatory concern as it could be an acetyl cholinesterase inhibitor and cause allergic hypersensitivity reactions in human beings. Therefore, in recent years, both legislators and consumers have shown increased interest in the safety of food products. Events such as the appearance of pesticide residues in food of animal origin have impelled governments in the United States, the European Union, Japan, India, and many other developed and developing countries in the world.3 The Codex Alimentarious Commission (CAC) and United States Department of Agriculture (USDA) set the maximum residue limits (MRLs) of 0.1 μg g−1 carbaryl in cattle meat. As the established tolerance for carbaryl insecticide in meat is low and metabolism in animals is high,4 the analytical method for monitoring carbaryl residues in meat is required to be simple, precise, inexpensive, and capable of detecting residues below the MRL.Methods for analysis of carbaryl insecticide by gas chromatography (GC) have proved to be problematic because of their polarity and heat labile characteristics. Liquid chromatography (LC) with flurogenic labeling technique was also mentioned.5 LC method involved a reverse-phase separation followed by a post column based hydrolysis that liberated methylamine, which further reacted with o-phthalaldehyde (OPA)-mercaptoethanol to form a highly fluorescent isoindole.6,7 Post column derivatization with fluorescence detection in LC and liquid chromatography-mass spectrometry (LC-MS) has high sensitivity and selectivity, but the required instrumentation is complicated and expensive. Further, all of the above methods were developed using high amounts of toxic solvents, require exhaustive cleanup techniques, and their applications are relied on only by crop residue analysis.8,9
The method described here in this study requires only a little toxic solvent and involves simple sample extraction and cleanup steps. The sample was deproteinized with acetonitrile, cleanup on aminopropyl-bonded silica cartridge and determined by photo-diode-array (PDA) detector. The method was partially validated, and this validated method was used for the determination of carbaryl residue in buffalo meat samples.
Materials and methods
Chemicals and reagents
Pure standard of carbaryl (1-napthyl methyl carbamate; assay 99.7%) was obtained from Sigma-Aldrich (USA). Aminopropyl bonded silica cartridges (3 cm3, 500 mg) and twelve-port vacuum manifold were procured from Supelco Co., USA. LC grade acetonitrile, methanol and water were obtained from E. Merck and Rankem (India). Deionized water was also obtained by a Milli-Q water purification system (Millipore, France) and was filtered using 0.45 μm cellulose filter prior to use. All other reagents were used of high analytical quality grade.Standard preparation
The standard stock solution at 1 mg mL−1 free base concentration of carbaryl standard prepared by dissolving pure standard in HPLC grade water and solution was maintained at 4 °C in the dark. Working standard solutions of 320, 160, 80, 40, 20, 10, 5, 2.5, 1.25, 0.62 and 0.3 μg mL−1 carbaryl were prepared daily in mobile phase [a mixture of acetonitrile–water (50![[thin space (1/6-em)]](https://www.rsc.org/images/entities/char_2009.gif) :
:![[thin space (1/6-em)]](https://www.rsc.org/images/entities/char_2009.gif) 50, v/v)] and stored at 4 °C.
50, v/v)] and stored at 4 °C.
Sample collection
A total of 122 buffalo meat samples composed of 92 Longissimus dorsi (LD) and 30 silver sides (SS) were collected from four different export meatpacking plants located across the country. Samples were collected over a 12 month period. The samples were collected from the deboning table where the chilled carcasses were cut, deboned, trimmed and packed. About 200 g of buffalo meat was cut aseptically from LD or SS randomly at different periods of deboning operations and transferred to self-sealing colorless low density polyethylene (LDPE) bags. The bags were labeled and blast frozen (−40 °C) and brought to the laboratory under frozen conditions in a foam box containing chiller packs. Both types of samples were stored at −20 °C before analysis, separately.Sample preparation, extraction and cleanup
Frozen meat samples were thawed overnight in a refrigerator (4 ± 1 °C). The muscle samples were made into small cubes with scissors after external fat and fascia were trimmed off. The finely cut samples were blended in a high speed (15 000 rpm) tissue blender (York Scientific Industries Pvt. Ltd., New Delhi, S.No.293) for 2 min. Ten grams of blended sample was taken into a 100 mL polypropylene centrifuge tube, and 10 mL of Milli-Q water was added; the mixture was homogenized for 1.5 min using an Ultra-Turrex T25 tissue homogenizer (Janke and Kenkel, IKA, Labor Technik, USA).For extraction, 0.5 g of meat homogenate was spiked with 50 µL of the working standard solution in a glass test tube. Then 1.5 mL of acetonitrile was added to it and the tube was held for 15 min at room temperature (27 ± 1 °C), and vortexed for 1.5 min. The mixture was kept for 5 min undisturbed, 1 mL of water was added and again vortexed at high speed for 1 min and finally centrifuged at 3000 rpm for 15 min in a refrigerated centrifuge (Biofuge, Heraeus, USA). Supernatant was collected into a separate test tube and cleanup of this sample extract was performed on aminopropyl-bonded silica cartridge preconditioned with 3 mL of methanol and 2 mL of water. The sample extract was passed through the cartridge under low vacuum at a flow rate of 3 mL min−1. The cartridge was then washed with methanol, sorbent bed was dried and finally the analyte was eluted with 2.5 mL of dichloromethane in a graduated tube. To dry up this eluted fraction, it was evaporated under a gentle stream of nitrogen at 40 °C. That is to accelerate the evaporation step a heating module was used to heat the aluminium block containing graduated tubes. The residue dissolved in mobile phase to a final volume of 0.5 mL. The aliquot was filtered using 0.22 μm nylon filter and directly injected into the LC system.
HPLC-PDA conditions
For the analysis of carbaryl, a high-performance liquid chromatograph (Shimadzu Corp., Kyoto, Japan) composed of an LC-10 AT quaternary gradient pump, a Rheodyne manual loop injector with a 20 μL loop, a column oven CTO-10AS vp, and a PDA detector was employed. Separation of carbaryl was achieved using a reverse phase octyldecylsilane C18 (RP-C18) stainless steel column; 250 × 4.6 mm i.d., 5 μm particle size, 100 A° pore size, (Phenomenex, Torrence, CA) with matching guard column as stationary phase and a mixture of acetonitrile–water (50![[thin space (1/6-em)]](https://www.rsc.org/images/entities/char_2009.gif) :
:![[thin space (1/6-em)]](https://www.rsc.org/images/entities/char_2009.gif) 50; v/v) as mobile phase. The eluent was monitored at a wavelength of 220 nm with a flow rate of 0.9 mL min−1 at a column oven temperature of 35 °C. The data collected were analyzed with class-vp 6.12 version software, taking into account the peak heights of analyte.
50; v/v) as mobile phase. The eluent was monitored at a wavelength of 220 nm with a flow rate of 0.9 mL min−1 at a column oven temperature of 35 °C. The data collected were analyzed with class-vp 6.12 version software, taking into account the peak heights of analyte.
Fortification of blanks and preparation of calibration curve
Blank homogenates of buffalo meat were prepared as described above. A working standard containing 320 μg mL−1 of carbaryl was prepared from the 1 mg mL−1 stock solutions kept at 4 °C. From this working standard different dilutions were made to spike the homogenates. Blank homogenates of 0.5 g were spiked with working standards to obtain final concentrations 2.0, 1.0, 0.5, 0.25, 0.125, 0.062, 0.031 and 0.015 μg g−1 of carbaryl and extracted as described previously and injected into the HPLC system. Calibration curves were plotted by taking peak height to the respective concentrations. This curve was used to quantify the residues of carbaryl in the buffalo meat samples analyzed.Analytical recovery and precision
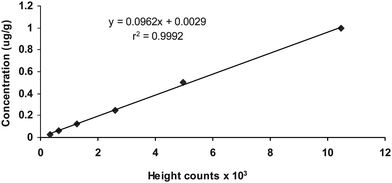
Analytical recovery was determined by spiking carbaryl to blank meat homogenates to yield concentrations of 0.02, 0.1, and 0.50 μg g−1of carbaryl and then analyzed. The amount of pesticide found by the assay method for each concentration was estimated using a linear regression equation after calibration of standard curve (y = 0.0962x + 0.0029, r2 = 0.9992; Where, y = peak height, x = carbaryl concentration, and r2 = correlation coefficient) considering peak heights (Fig. 1). Five determinants were made for each concentration, and the percent recovery was calculated. Both intra- and interday assay precisions were also determined by analyzing three spiked concentrations of 0.02, 0.1, and 0.5 μg g−1, five sets each with blank. However, intraday assay precision was determined at three occasions at least 6 h apart, whereas interday precision was determined at least 24 h apart for three successive days. The lowest and highest concentrations of standard routinely used were 0.02 and 0.50 μg g−1, respectively. The limit of detection (LOD) and limit of quantification (LOQ) for carbaryl was 0.015 and 0.031 μg g−1. | ||
| Fig. 1 Calibration curve for carbaryl in buffalo meat. | ||
Limits of detection (LOD) and limits of quantification (LOQ)
The limit of detection (LOD) and limit of quantification (LOQ) of the method was done as per proposed guidelines of CAC with slight modification. The limit of detection (LOD) was determined from injection of working standards and was defined as the amount corresponding to mean value plus three times the standard deviation for the blank sample. So, consideration was given only when the first condition was satisfied. The detection limit was computed with a signal to noise-ration of 3 (S/N-3). The limit of quantification (LOQ) measured on the fortified tissue sample from where standard calibration curve was satisfied. For measurement, the peak height to average background noise was determined. The background noise estimates were based on the peak-to-peak baseline near the analyte peak. LOQ was then calculated on the basis of minimal accepted value of the signal to noise ration of 6 (S/N-6).Results and discussion
Optimization of HPLC conditions
Chromatographic separation of carbaryl was carried out with isocratic elution of acetonitrile–water (50![[thin space (1/6-em)]](https://www.rsc.org/images/entities/char_2009.gif) :
:![[thin space (1/6-em)]](https://www.rsc.org/images/entities/char_2009.gif) 50 v/v) at the flow rate of 0.9 mL min−1 and at column oven temperature of 35 °C. At the initial stage of separation it has been observed that a slight change in the ratio of acetonitrile and water changed the polarity of the mobile phase reasonably and thereby peak resolution and retention time. The retention time of carbaryl was approximated to be 8.0 min. Many analysts reported various mobile phase profiles during separation of carbaryl compound in foods.2,5,8,9 Mobile phase containing acetonitrile
50 v/v) at the flow rate of 0.9 mL min−1 and at column oven temperature of 35 °C. At the initial stage of separation it has been observed that a slight change in the ratio of acetonitrile and water changed the polarity of the mobile phase reasonably and thereby peak resolution and retention time. The retention time of carbaryl was approximated to be 8.0 min. Many analysts reported various mobile phase profiles during separation of carbaryl compound in foods.2,5,8,9 Mobile phase containing acetonitrile![[thin space (1/6-em)]](https://www.rsc.org/images/entities/char_2009.gif) :
:![[thin space (1/6-em)]](https://www.rsc.org/images/entities/char_2009.gif) water, 40
water, 40![[thin space (1/6-em)]](https://www.rsc.org/images/entities/char_2009.gif) :
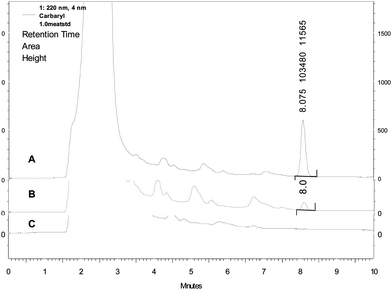
:![[thin space (1/6-em)]](https://www.rsc.org/images/entities/char_2009.gif) 60 v/v showed satisfactory result on isocratic elution.2 A photo-diode-array (PDA) detector set at a wavelength of 220 nm was used for the detection of carbaryl compound. The majority of literature focused on LC with fluorogenic detection techniques after post-column derivatization.5,8,10 Post-column derivatization with fluorescence detection in LC had higher sensitivity and selectivity, but the required processing step and instrumentation are complicated and expensive. Moreover, all the methods were employed in crop residue analysis such as fruits, vegetables and juices, which contain high amounts of chromophoric components that could interfere with carbamate residues analysis.8,9 In contrast to crop residues analysis, PDA detector response at 220 nm for meat was more than sufficient as only little interfering substances were observed in the chromatogram (Fig. 2). It has been observed that UV-spectrum below 210 nm wavelength matrices interference is higher, with increased peak resolution and sharpness. Sharpness of peaks above 230 nm was unacceptable. So, PDA detector was set at 220 nm wavelength.
60 v/v showed satisfactory result on isocratic elution.2 A photo-diode-array (PDA) detector set at a wavelength of 220 nm was used for the detection of carbaryl compound. The majority of literature focused on LC with fluorogenic detection techniques after post-column derivatization.5,8,10 Post-column derivatization with fluorescence detection in LC had higher sensitivity and selectivity, but the required processing step and instrumentation are complicated and expensive. Moreover, all the methods were employed in crop residue analysis such as fruits, vegetables and juices, which contain high amounts of chromophoric components that could interfere with carbamate residues analysis.8,9 In contrast to crop residues analysis, PDA detector response at 220 nm for meat was more than sufficient as only little interfering substances were observed in the chromatogram (Fig. 2). It has been observed that UV-spectrum below 210 nm wavelength matrices interference is higher, with increased peak resolution and sharpness. Sharpness of peaks above 230 nm was unacceptable. So, PDA detector was set at 220 nm wavelength.
 | ||
| Fig. 2 Liquid chromatogram of carbaryl spiked (A and B) and blank (C) buffalo meat homogenates. Samples spiked at 1.0 μg g−1 (A) and 0.031 μg g−1 (B) concentration. | ||
Sample extraction and cleanup
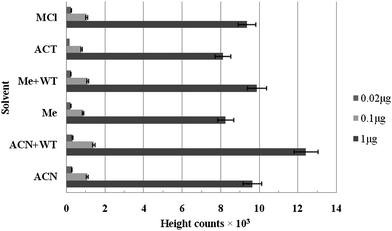
Acetonitrile along with water was considered to be an effective solvent for extraction of carbaryl in buffalo meat samples, leaving over 99% of fat and fiber behind (Fig. 3). Pre-extraction permits larger sample sizes to be taken and thus assured more representative sampling while removing a substantial amount of fat and other interfering substances present in meat. Use of water in extraction cell acts as an efficient medium for extraction of carbaryl,9 even a very small amount of amino acids may be present.2 But, these overwhelming interfering substances can be considerably reduced by the use of guard column, efficient clean-up and subsequent filtration. Therefore, sufficient reduction in the background signal was observed in the chromatogram. It has also been observed that cleanup of the sample extract with aminopropyl-bonded silica cartridge adds extra specificity to the reversed-phase mode of LC separation due to their strong feature in the normal-phase mode of solid phase extraction (SPE). Various workers reported extraction of carbaryl with acetone, acetonitrile, methanol and methylene chloride in their multi-residue analysis.5,8,9,11 The use of methanol as an extraction solution has been shown to have 15% more carbamate residues in the sample extract.11 Other analysts reported use of methanol–water or acetonitrile–water as an extraction solution in combination with SPE cleanup or supercritical fluid extraction has better acceptability for the recovery of moderately polar carbaryl component from sample matrix.12,13 | ||
| Fig. 3 Effects of different solvents on extraction efficiency of carbaryl. | ||
Validation of analytical methodology
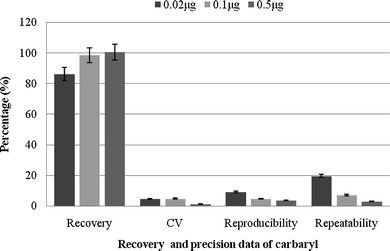
The analytical method was validated by evaluating % recovery, precision, linear dynamic range, sensitivity, limit of detection (LOD), and limit of quantification (LOQ) of the analytes. Results showed (Fig. 4) that the recovery range of the insecticide at different concentrations is good. The excellent recovery mainly occurred due to complete extraction of moderately polar insecticide.14 As the cleanup was conducted with SPE columns, unwanted interfering substances due to this might be avoided with an increased mean recovery value. Higher recovery value might also be due to repeated extractions.12 The coefficients of variation (CVs) were excellent for all of the three spiked concentrations (Fig. 4). In fact, the average recovery and CVs is more than sufficient than mentioned in the Codex guidelines. | ||
| Fig. 4 Recovery and precision data of carbaryl spiked into buffalo meat samples. | ||
Results of precision study indicated that intra- and inter-day precisions were adequate with the coefficients of variation ranged from 2.9 to 19.6 and 3.8 to 9.4%, respectively. Method standardized showed the linear dynamic range (0.03 to 1.0 μg g−1) of the detector response for the pesticide with the average correlation coefficient of 0.9992 (Fig. 1). The limit of detection (LOD) and limit of quantification (LOQ) of the method was 0.015 and 0.03 μg g−1, respectively.
Application in real samples
Results for residue data of pesticides in meat are shown in Table 1. The residual concentration of carbaryl pesticide in LD muscle ranged from 0.022 to 0.069 μg g−1 with the statistical mean of 0.045 μg g−1. However, no sample showed residues above the MRL of CAC, although 3 samples (3.1%) were positive for carbaryl. In contrast to LD muscle, mean residual concentration in SS muscle was 0.028 μg g−1 but only 2 samples (6.89%) out of 30 were positive for carbaryl residues. These results indicate that only very few samples contain carbaryl pesticide in buffalo meat, though market reports indicate use of this component in regular house hold practices, crop protection or even in animal husbandry practices as ectoparasiticide measures. Low incidence of this chemical component might be due to sufficient clearance time pre-slaughter or may be degraded very quickly in the environment.Conclusion
HPLC coupled with photo-diode-array detector and acetonitrile–water as the extraction medium was successfully employed to simple and sensitive determination of carbaryl residues in meat. In comparison to the pretreatment methods mentioned previously, the proposed HPLC method is environmentally friendly and inexpensive and easily determined. In addition, analysis was accomplished with high sensitivity and specificity. Therefore the proposed method will be useful and practical in future residue monitoring of carbaryl in meat.Acknowledgements
Authors of this manuscript are thankful to In-charge National Referral Lab (Residue monitoring) for providing sufficient facilities for sample analysis. We are also equally thankful to Director of Indian Veterinary Research Institute, and Agricultural and Processed Food Export Development Authority, Govt. of India for their financial support.References
- EMEA, European Medicines Agency, 2004. Available at: http://www.emea.in.int/ Search PubMed.
- R. J. Argauer, K. I. Eller, M. A. Ibrahim and R. J. Brown, J. Agric. Food Chem, 1995, 43, 2774–2778 CrossRef CAS.
- M. Takino, K. Yamaguchi and T. Nakahara, J. Agric. Food Chem, 2004, 52, 727–735 CrossRef CAS.
- JECFA, Fifty-eight report of the Joint FAO/WHO Expert Committee on Food Additives, 2002, 907 Search PubMed.
- M. J. Page and M. French, J. AOAC-Int, 1992, 75, 1073–1083 Search PubMed.
- R. J. Bushway, J. Chromatogr, 1988, 457, 437–444 CrossRef CAS.
- G. S. Nunes, M. P. Marco, M. L. Riberio and D. Barcelo, J. Chromatogr. - A, 1998, 823, 109–120 CrossRef CAS.
- G. Ozhan, S. Topur and B. Alpertunga, J. Food Prot, 2003, 66, 1510–1513 CAS.
- S. Bogialli, R. Curini, A. D. Carcia, M. Nazzari and D. Tamburro, J. Agric. Food Chem, 2004, 52, 665–671 CrossRef CAS.
- B. D. McGarvey, J. Chromatogr, 1989, 481, 445–451 CrossRef CAS.
- R. T. Krause, J. Assoc. Off. Anal. Chem, 1985, 68, 726–733 CAS.
- A. Kok and M. Hiemstra, J. AOAC-Int, 1992, 75, 1063–1072 Search PubMed.
- J. W. Wong, M. G. Webster, C. A. Halverson, M. J. Hengel, K. K. Ngim and S. E. Ebeler, J. Agric. Food Chem, 2003, 51, 1148–1161 CrossRef CAS.
- D. M. Holstege, D. L. Scharberg, E. R. Tor, L. C. Hart and F. D. Galey, J. Assoc. Off. Anal. Chem, 1994, 77, 1263–1274 CAS.
Footnote |
| † Present Address: Department of Livestock Products Technology, COVS, GADVASU, PAU Campus, Ludhiana-141 004 (Punjab), India |
| This journal is © The Royal Society of Chemistry 2010 |
