Determination of piroxicam in pharmaceutical preparations by continuous-flow chemiluminescence
J. A. Murillo
Pulgarín
*,
A. Alañón
Molina
and
N.
Boras
Department of Analytical Chemistry and Foods Technology, University, Castilla-La Mancha, 13071, Ciudad Real, Spain. E-mail: joseantonio.murillo@uclm.es
First published on 17th November 2009
Abstract
A simple and rapid chemiluminescent method for the assay of piroxicam in pure and in pharmaceutical formulations by flow analysis is proposed. The method is based on the reaction of this drug with N-bromosuccinimide (NBS) in alkaline medium in the presence of fluorescein as sensitizer. The emission intensity is greatly enhanced by the presence of cetyltrimethylammonium bromide (CTAB). The optimum chemical conditions for the chemiluminescence emission were investigated. The calibration graph was linear for the concentration range from 2.0 to 12.0 μg mL−1. The detection limit, according to Clayton et al.(C. A. Clayton, J. W. Hines and P. D. Elkins, Anal. Chem., 1987, 59, 2506), was 0.72 μg mL−1. For analysis of 10 solutions of 8.0 μg mL−1 of this anti-inflammatory, if error propagation theory is assumed, the relative error was less than 1.5%. The present chemiluminescence procedure was applied to the determination of piroxicam in Spanish pharmaceutical formulations, with excellent recoveries, as the determination is free from interference from common excipients.
Introduction
Piroxicam is a member of the oxicam group of nonsteroidal anti-inflammatory drugs (NSAIDs). The chemical name for piroxicam is 4-hydroxyl-2-methyl-N-2-pyridinyl-2H-1,2-benzothiazine-3-carboxamide 1,1-dioxide. It exhibits a weakly acidic 4-hydroxy proton (pKa 5.1) and weakly basic pyridyl nitrogen (pKa 1.8). Its molecular formula is C15H13N3O4S and the structural formula is shown in Fig. 1.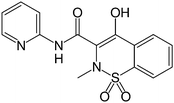 | ||
| Fig. 1 Piroxicam structure. | ||
This nonsteroidal anti-inflammatory drug is used to relieve the symptoms of arthritis, primary dysmenorrhoea, pyrexia and as an analgesic, especially where there is an inflammatory component. It is also used in veterinary medicine to treat certain neoplasias expressing cyclooxygenase (COX) receptors, such as bladder, colon, and prostate cancers.
The piroxicam is a non-selective COX inhibitor possessing both analgesic and antipyretic properties; the piroxicam use can result in gastrointestinal toxicity, tinnitus, dizziness, headaches, rashes, and pruritus. The most severe adverse reactions are peptic ulceration and gastrointestinal bleeding.
Owing to the wide variety of analogous products developed in recent years, the clinical, forensic, and antidoping analyst require informative and unambiguous data about administered pharmaceuticals. Therefore, different analytical techniques, such as high-performance liquid chromatography,1–4 capillary electrophoresis,5,6 spectrophotometry,7–15 spectrofluorimetry16,17 and polarography,18,19 have been used for its determination in pharmaceuticals preparations. Most of the reported methods suffer from disadvantages such as complicated procedure, long response time, requirement of expensive instruments, or low detection ability.
Flow-injection (FI) is by now a consolidated excellent technique for rapid, automated, quantitative analyses that combines on-line chemical and physical sample treatment with a wide range of flow-through detection systems in an enclosed, continuous flow environment. The mentioned advantages of FI have led to a continuously increasing interest in pharmaceutical analysis and quality control.20–23
The use of chemiluminescence (CL) methods in pharmaceutical and biomedical analysis seems to have become quite important during recent years. Simplicity of detection, low detection limits, wide calibration ranges, and short analysis times are some of the characteristics that make the method attractive. When coupled with automated controlled-flow methodologies, the method provides cheap, rapid, simple and reproducible means of detection and, therefore, has been successfully applied to many drugs detection.24–34
Regarding the determination of piroxicam by CL, three methods have been described in the bibliography.35–37 The first method was based35 on the quenching effect of piroxicam on the chemiluminescence intensity produced by acridine orange-KMnO4-OH− system. The second method was established by post-chemiluminescence phenomenon, when piroxicam was injected in the mixture after the finish of the CL reaction of alkaline N-bromosuccinimide and luminol.36 The last one is based on the chemuiluminescence reaction of this analgesic with an acidic potassium permanganate and Ru(bipy)32+ in the presence of quinine sulfate as a sensitizer.37
As an extensively used brominating and oxidizing reagent, N-bromosuccinimide (NBS) has been successfully introduced into CL reactions.36,38–40 In aqueous solutions, its oxidizing properties were attributed to hypobromous acid generated by its hydrolysis. NBS has similar oxidation properties to hypobromite, but is more stable.41,42 Many analytical procedures have been successfully developed for drugs analysis using NBS as a CL oxidant.43–47 For a class of compounds called oxicams, NBS was used as an oxidant in an acidic medium, followed by a reaction of excess oxidant with chloranilic acid to bleach its purple color.48 The system obeyed Beer's law over a concentration range of 10–160 μg mL−1 for piroxicam. Previously, a CL method was proposed for the determination of meloxicam based on its reaction with NBS in alkaline medium in the presence of fluorescein.46
The aim of the present study is the development of a new analytical methodology that studies the information provided by time resolved chemiluminescence, not requiring sophisticated instruments. The method was based on the recording of the whole chemiluminescence intensity-versus-time profile, based on stopped-flow chemistry, that ensures rapid, and efficient mixing of chemiluminescent reagent and sample, immediately before reaching the detector; this results in high precision and detectability, particularly with fast, short-lived emissions.
The method proposed is based on the CL reaction between piroxicam and NBS in alkaline medium using fluorescein as energy transfer agent. Use of cetyltrimethylammonium bromide (CTAB) as sensitizer enhances the signal magnitude about 100 times. It has been successfully applied to the determination of piroxicam in different pharmaceutical formulations. The developed method exhibits several advantages over that using chemical derivatization48 and involving some complicated procedures or sophisticated instrumentation, as reported in previous papers. Moreover the method is simple, robust and unlike fluorescence and phosphorescence49,50 detection, no excitation source is required (a single light detector such as a photomultiplier tube suffices), nor is a monochromator or even a filter usually needed, so the method is very suitable for routine drug quality control.
Experimental
Reagents
Analytical reagent-grade chemicals and doubly distilled water were used throughout.Piroxicam was obtained from Aldrich (Steinheim, Germany). A stock solution of piroxicam (5 mg of piroxicam dissolved in 100 ml of water) was prepared in basic medium and diluted in water to prepare working solutions. The stock solution of piroxicam was stored in refrigerator at 4 °C. Under these conditions, it was stable for at least one month.
NBS, fluorescein and CTAB were obtained from Aldrich (Steinheim, Germany). A stock solution of NBS was prepared daily by dissolving 0.3559 g in 50 mL of water in an amber-colored flask.
Fluorescein stock solution (2.0 10−3 M) was prepared dissolving 0.188 g in 250 mL of water. CTAB stock solution (0.1 M) was prepared by dissolving 3.645 g of CTAB in water, and diluting to 100 mL with water.
Concentrated sulfuric acid and sodium hydroxide was obtained from Panreac (Barcelona, Spain). Tween80 was obtained from Acros (Belgium).
Apparatus
The flow system was installed in a conventional manifold as shown in Fig. 2. The reaction reagents were pumped through the four-line manifold by peristaltic pump (Gilson, Minipuls 3). The pump rate was 0.32 mL s−1 and the reagents went through poly(tetrafluoroethylene) (PTFE) flow tubes (0.8 mm i.d) for mixing in detector cell. At an appropriate time, the flow was stopped abruptly (0.5 min after the beginning, in this time all the reagents have arrived in the cell) and the measurement commenced; chemiluminescence-time data pairs were acquired using a Camspec Chemiluminescence Detector CL 2 IR (photosensor module Hamamatsu spectral response from 300 to 600 nm; spiral-type flow cell, volume 120 μl; Sawston, Cambridge).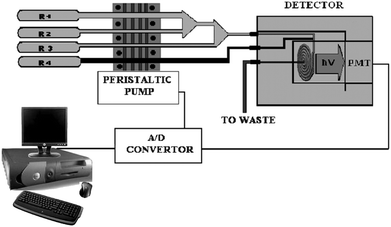 | ||
| Fig. 2 Schematic diagram of the continuous-flow manifold. R1, analyte; R2, fluorescein solution + CTAB; R3, NaOH solution; R4, NBS solution; PMT, photomultiplier tube. | ||
The detector was connected to a computer by digital analogical converser; data were acquired using Chromatography Station for Windows CSW32 program (Data Apex Ltd, Prague, The Czech republic) and processed by us.
Procedure
Results and discussion
A series of experiments were conducted to establish the optimum analytical conditions for the CL oxidation of piroxicam by NBS in alkaline medium and in the presence of fluorescein and CTAB surfactants.Effect of sodium hydroxide concentration
The alkalinity of the solution is an important parameter in determining the magnitude of the chemiluminescence response. It was found that almost no CL emission was observed in acid or neutral conditions.The effect of NaOH concentration on the chemiluminescence intensity was investigated from 5 10−4 to 0.5 M. The results are shown in Fig. 3. The CL intensity was found to strongly increase with increasing the concentration of NaOH in the range of 0.0005 to 0.025 M. When the concentration exceeded the last one, a decrease in intensity was observed. Because the maximum chemiluminescence intensity was obtained at 0.025 M NaOH, this value was chosen as optimum for the consequent experiments.
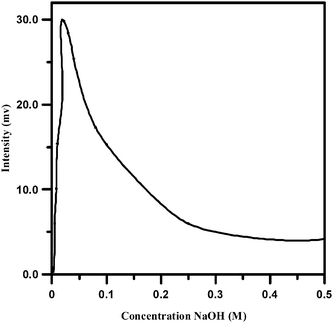 | ||
| Fig. 3 Effect of NaOH concentration on the CL intensity. (Piroxicam: 20 μg mL−1, NBS: 0.04 M, fluorescein: 0.002 M). | ||
Effect of NBS concentration
NBS was found to be the most optimum oxidant for the chemiluminescence reaction of piroxicam through studying various oxidants commonly used in chemiluminescence reaction system. The results show that the biggest chemiluminescence signal is obtained when NBS is used accompanied with fluorescein, so this was chosen as optimum oxidant in the experiment.The CL intensity was found to increase with increasing the concentration of NBS up to 0.002 M. Further increase in NBS concentration resulted in a reduction of CL intensity as can be seen in Fig. 4. The maximum responses were obtained at 0.002 M. Thus, this concentration was chosen as the most suitable for further studies.
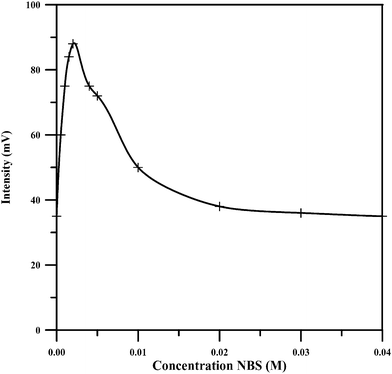 | ||
| Fig. 4 Effect of NBS concentration on the CL emission. (Piroxicam: 20 μg mL−1, fluorescein: 0.002 M, NaOH: 0.025 M). | ||
Effect of surfactants
Surfactants are commonly used to increase efficiency of CL and the sensitivity of the measurement. Therefore, the effect of some typical surfactants including cationic surfactant as cetyltrimethylammonium bromide (CTAB) and dodecyltrimethylammonium bromide (DTAB), cationic surfactant as sodium dodecyl sulfonate (SDS) and sodium dodecylbenzene sulfonate (SDBS), non-ionic as TritonX-100 and tween-80, on the CL emission from the reaction of NBS with piroxicam in the presence of fluorescein in alkaline medium was investigated. The results showed that CTAB could be selected as the most suitable sensitizer for the CL system attributing to its strong effect on the CL intensity. The effect of its concentration on the CL intensity was investigated from 2.0 × 10⁻⁴ to 0.1 M. When the CTAB concentration was varied the CL profile changed resulting in different kinds of signal. CTAB of 2.5 × 10⁻³ M was chosen although it was not a higher intensity, the chemiluminescence intensity-versus time profile was more resolved (Fig. 5).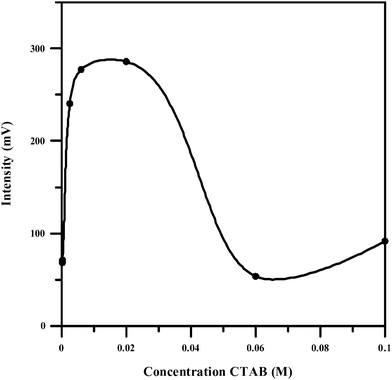 | ||
| Fig. 5 Effect of CTAB concentration on the CL emission. (Piroxicam: 20 μg mL−1, NBS: 0.002 M, fluorescein: 0.002 M, NaOH: 0.025 M). | ||
Effect of fluorescein
Most CL reactions have small quantum efficiencies and thus show weak luminescence. In this case, a sensitizer, normally a highly fluorescent compound, is added to the reaction system. Energy is transferred from the excited species to the sensitizer, emitting the characteristic radiation of the sensitizer. Since the sensitizer has higher quantum efficiency, more photons are emitted, facilitating measurement.The influence of sensitizers like rhodamine 6G, rhodamine B, quinine and fluorescein were studied. The results show that the most obvious chemiluminescence signal is observed when fluorescein is present. So this compound was selected for subsequent studies.
The effect of fluorescein concentration on the chemiluminescence intensity was examined from 2.0 × 10 −4 to 10−2 M. Fig. 6 shows the intensity-time profile for different concentration of fluorescein.
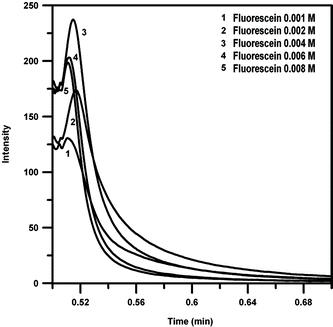 | ||
| Fig. 6 Intensity-time profile for different concentration of fluorescein. (Piroxicam: 20 μg mL−1, NBS: 0.002 M, CTAB: 0.0025 M, NaOH: 0.025 M). | ||
The strongest chemiluminescence signal is obtained when the concentration of fluorescein is 4.0 × 10⁻³ M in the chemiluminescence system. Thus, the fluorescein concentration of 4.0 × 10⁻³ M was chosen for the consequent experiment.
Effect of flow rate
The flow rate is an important parameter in CL detection because the time taken to transfer the excited product into the flow cell is critical for maximum collection of the emitted light.51 Too low or too high flow rates result in a decrease or even absence of CL in the flow cell. The optimum flow rate was found to be 0.32 mL s−1.Intensity-time profile
The CL emission intensity versus time profile of the CL reaction of NBS in basic medium and piroxicam in the presence of fluorescein and CTAB shows an initial sharp rise in the signal; the maximum emission intensity was attained within 0.52 s (Fig. 7) and then decayed slowly.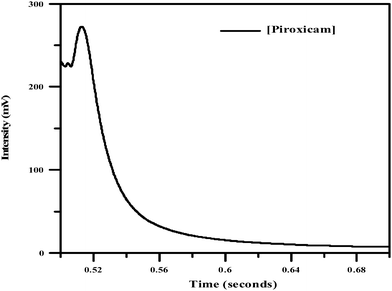 | ||
| Fig. 7 Intensity-time profile (Piroxicam: 20 μg mL−1, NBS: 0.002 M, fluorescein: 0.004 M, CTAB: 0.0025 M, NaOH: 0.025 M). | ||
Analytical performance
With the described manifold and under the optimum experimental conditions (NBS 2 mM, NaOH 25 mM and fluorescein 4 mM in CTAB 2.5 mM), we propose a method to determine piroxicam by measuring a CL curve development in the concentration range of 2.0 to 12.0 μg mL−1. The calibration graph was constructed, with three replicates per point, by measuring the maximum intensity.The least median of squares regression (LMS)52 was applied to test for the presence of outliers. LMS is a robust regression method, capable of accurately detecting outliers which introduce errors in the true line when the experimental data are fitted by least squares regression. No outliers were detected in our method. The proposed method was then evaluated by statistical analysis of the experimental data by fitting the overall least squares line according to y = a + bx.53,54Table 1 gives the results of the statistic analysis. From the random residual distribution obtained it follows that the calibration curve was homoscedastic, i.e. the variance was constant and independent of the concentration throughout the dynamic range, so chemiluminescence intensity was linearly related to the piroxicam concentration over the concentration range studied.
| Parameter | Least median of squares |
|---|---|
| Intercept on ordinate, a | 1.50 |
| Slope, b | 8.95 |
| Standard deviation of regression, syx | 2.5 |
| Determination coefficient, R2 | 0.998 |
| Parameter | Least squares |
|---|---|
| Intercept on ordinate, a | −0.29 |
| S.D. of intercept on ordinate, sa | 1.2 |
| Slope, b | 9.07 |
| S.D. of slope, sb | 0.16 |
| S.D. of regression, syx | 2.3 |
| Coefficient of determination, R2 | 0.995 |
If the error propagation is considered, the values of the detection limit is consistent with the reliability of the blank measurements and the signal measurements of the standards.55,56 In this case, the detection limit was 0.20 μg mL−1. The detection limit according to Clayton et al.57 considers the probability of positive false and negative false values, the detection limit being 0.72 μg mL−1 (α = β = 0.05; n-2 = 16).
The repeatability of the proposed method was determined by analysing a series of ten standard samples containing 8.0 μg mL−1 of the piroxicam. Application of the theory of error propagation (95% confidence level) to the calibration graph provided a relative standard error of 1.24%. The respective standard deviation for the replicates was 2.76% μg mL−1.
Validation of method
The determination of piroxicam was validated by least-squares regression.54 The performance of the proposed method in the determination of piroxicam was compared with that of a chromatographic method,58 by analysing 10 samples containing the analgesic at levels within the application range. The concentrations, provided by the currently accepted method and the proposed method were subjected to least-squared pair analysis. This procedure considers the effects of various types of error. The presence of random of errors in the test method causes points to scatter around the least-squares line and the calculated slope and intercept to slightly depart from unity and zero, respectively. The random error can be estimated from the standard deviation in the y-direction (also called the standard deviation of the estimate of y on x). A proportional systematic error leads to a change in b, so the difference between b and unity provides an estimate of the proportional error. A constant systematic error shows up in a non-zero value for the intercept. If both methods provided identical concentrations, in the same samples, then the least-squares analysis would give a zero intercept and a unit slope. Fig. 8 shows the 95% confidence region for the true slope and estimated intercept. As can be seen, the point corresponding to the zero intercept and unity slope falls within the joint confidence region, which means that the accuracy of the proposed method and the currently accepted method is not significantly different.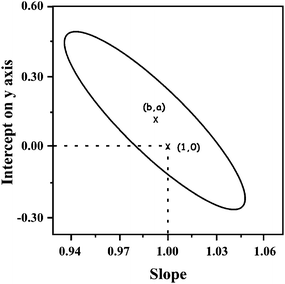 | ||
| Fig. 8 Comparison of the proposed method and the chromatographic method. The ellipse bounds the 95% confidence region for the true slope and intercept on y-axis, estimated from the overall least squares regression performed with the concentration calculated in reverse with both methods. The point (b,a) is the centre of the ellipse corresponding to the true intercept and estimated slope. The point (1,0) corresponds to a zero intercept and unity slope. | ||
Applications
In order to assess the possible analytical applications of the CL method described above, the effect of some common excipients (glucose, lactose, magnesic estearate starch and microcrystalline cellulose) used in pharmaceutical preparations were studied. The procedure consists of preparing five different synthetic solutions, each one containing piroxicam (5 μg mL−1) and different amounts of only one excipients (5, 50 and 100 μg mL−1). Later, the CL signal of these solutions were measured using fixed conditions and no interference was observed from these excipients.The proposed method was satisfactorily applied to analysis of piroxicam in the Spanish pharmaceutical products that contain this anti-inflammatory agent in different formulations, as is showed in Table 2. The assay results, expressed as a percentage of the nominal contents, resulting from the average of three determinations of three different samples, are summarized in Table 2. The recoveries agree well enough with the nominal content and the precision is quite satisfactory.
| Commercial formulations | Nominal content | Piroxicam found (recovery ± SD,%) |
|---|---|---|
| Doblexan® (capsule) | 20 mg | 104.1 ± 0.9 (3) |
| Feldene®Flas (tablet) | 20 mg | 103.2 ± 1.2 (3) |
| Feldene® (suppository) | 20 mg | 97.8 ± 1.5 (3) |
| Improntal® (tablet) | 20 mg | 97.5 ± 2.2 (3) |
| Vitaxicam (capsule) | 20 mg | 95.7 ± 1.8 (3) |
| Vitaxicam (suppository) | 20 mg | 95.8 ± 2.1 (3) |
| Piroxicam ratiopharm (capsule) | 20 mg | 91.8 ± 1.6 (3) |
| Piroxicam Pharmagenus (capsule) | 20 mg | 93.7 ± 2.0 (3) |
| Feldene® (injection) | 20 mg | 97.8 ± 1.8 (3) |
Conclusions
In the present work, an energy-transfer based CL system for the determination of piroxicam was successfully developed. The proposed method is based on chemiluminescence generated by piroxicam mixed with NBS, fluorescein and CTAB in alkaline medium. The method offers the advantages of simplicity, rapidity, sensitivity, and accuracy for the determination of piroxicam in pharmaceuticals preparations. It does not require sophisticated reagents and equipment, and has a wide calibration range and a relatively low detection limit. Moreover, it does not require prior extraction or pre-treatment of the sample as other reported methods such as spectrophotometry and chromatography, for the determination of piroxicam in its different commercial formulations.Acknowledgements
The authors gratefully acknowledge financial support from the “Consejería de Educación y Ciencia, Junta de Comunidades de Castilla-La Mancha” (Project N° PCI-08-0120).References
- S. Ge, Q. Cheng, X. Wang and N. Xi, Yaoxue-Xuebao, 1988, 23, 38 CAS.
- H. Chen, Z. Y. Mi and W. Z. Liu, Fenxi-Kexue-Xuebao, 2000, 16, 470 Search PubMed.
- L. P. Wang, Z. Liu, G. R. Chen and L. Wang, Yaowu-Fenxi-Zazhi, 1999, 19, 48 Search PubMed.
- A. Savaser, A. Baratas, Y. Ozkan, N. Yuksel, S. A. Ozkan and T. Baykara, Chromatographia, 2004, 59, 555.
- Y. L. Chen and S. M. Wu, Anal. Bioanal. Chem., 2005, 381, 907 CrossRef CAS.
- S. Khalil, N. Borham and M. A. El-Ries, Anal. Chim. Acta, 2000, 414, 215 CrossRef CAS.
- E. R. M. Hackmann, E. A. Dos-Santos-Gianotto and M. I. Rocha-Miritello-Santoro, Anal lett, 1993, 26, 259 CAS.
- B. E. Rao, S. Raghuveer, C. M. R. Srivastav and D. K. Vatsa, Indian-Drugs, 1993, 30, 194 Search PubMed.
- M. A. El-Reis, G. Mohamed, S. Khalil and M. El-Shall, Chem. Pharm. Bull., 2003, 51, 6 CrossRef.
- B. G. Gowda, J. Seetharamappa and M. B. Melwanki, Anal. Sci., 2002, 18, 671 CAS.
- J. Parasrampuria and V. Das-Gupta, Drug Dev. Ind. Pharm., 1990, 16, 629 CrossRef CAS.
- C. S. P. Sastry, A. S. R. P. Tipirneni, M. V. Suryannarayana and T. N. V. Prasad, Indian-J-Pharm-Sci., 1988, 50, 293 Search PubMed.
- M. A. El-Reis, Anal-Lett., 1998, 31, 793 CAS.
- B. S. Nagaralli, J. Seetharamppa and M. B. Melwanki, J. Pharm. Biomed. Anal., 2002, 29, 859 CrossRef CAS.
- C. Sanchez-Pedreno, M. S. Garcia, M. I. Albero and J. Rodriguez, J. Pharm. Biomed. Anal., 1993, 11, 933 CrossRef CAS.
- P. C. Damián, M. Bearzotti, M. Cabezon and A. C. Olivieri, J. Pharm. Biomed. Anal., 1998, 17, 233 CrossRef CAS.
- G. M. Escandar, A. J. Bystol and A. D. Campiglia, Anal. Chim. Acta, 2002, 466(2), 275 CrossRef CAS.
- J. L. Manzoori and M. Amjadi, Microchim. Acta, 2003, 143(1), 39 CrossRef CAS.
- H. L. Ma, M. T. Xu and J. F. Song, Fenxi-Shiyanshi, 2005, 24, 51 CAS.
- J. M. Calatayud; Flow inyection analysis of pharmaceutical, in: Automation in the laboratory, Taylor&Farancis, London, 1996 Search PubMed.
- L. Hlabangana, S. Hernández-Cassau and J. Saurina, Curr. Pharm. Anal., 2006, 2, 127 Search PubMed.
- P. Pavlina and M. Polasek, Cesk.Slov. Farm., 2001, 50, 107 Search PubMed.
- P. D. Tzanavaras and D. G. Themelis, Anal. Chim. Acta, 2007, 588, 1 CrossRef CAS.
- P. Solich, H. Sklenarova, M. Polasek and R. Karlicek, J. Flow Injection Anal, 2001, 18, 13 Search PubMed.
- B. X. Li, Z. J. Zhang, L. X. Zhao and C. L. Xu, Anal. Chim. Acta, 2002, 459, 19 CrossRef CAS.
- B. X. Li, Z. J. Zhang, L. X. Zhao and C. L. Xu, Talanta, 2002, 57, 765 CrossRef CAS.
- J. X. Du, Y. H. Li and J. R. Lu, Anal. Lett., 2002, 35, 2295 CrossRef CAS.
- Y. Y. Sun, Y. H. Tang, H. Yao and X. H. Zheng, Talanta, 2004, 64, 156 CrossRef CAS.
- M. Catalá Icardo, M. Misiewicz, A. Ciucu, J. V. García Mateo and J. Martínez Calatayud, Talanta, 2003, 499, 57.
- Y. Fuster Mestre, M. Fernández Lozano and J. Martínez Calatayud, J. AOAC Int., 2001, 84, 13 CAS.
- Z. H. Song and L. Wang, Phytochem. Anal., 2003, 14, 216 CrossRef CAS.
- J. A. Murillo Pulgarín, A. Alañón Molina and G. Pérez-Olivares Nieto, Anal. Chim. Acta, 2004, 518, 37 CrossRef CAS.
- J. A. Murillo Pulgarín, A. Alañón Molina and P. Fernández López, Talanta, 2006, 68, 586 CrossRef.
- J. A. Murillo Pulgarín, A. Alañón Molina and G. Pérez-Olivares Nieto, Microchim. Acta, 2007, 159, 349 CrossRef CAS.
- J. Z. Wang, B. Liu and Y. M. Zhou, Fenxi-Ceshi-Xuebao, 2005, 24, 110 Search PubMed.
- H. Bai, F. Nie and J. Lu, Anal. Sci., 2007, 23, 1301 CrossRef CAS.
- F. Yu, F. Chen, S. Zheng, L. Chen and M. Cui, Anal. Lett., 2008, 41, 2412 CrossRef CAS.
- S. A. Halvatzis, M. M. Timotheou-Potamia and A. C. Calokerinos, Analyst, 1990, 115, 1229 RSC.
- J. Michalowski and A. Kojlo, Talanta, 2001, 54, 107 CrossRef CAS.
- A. Safavi and M. R. Baezat, Anal. Chim. Acta, 1998, 368, 113 CrossRef CAS.
- S. A. Halvatzis and M. M. Timotheou-Potamia, Talanta, 1993, 40, 1245 CrossRef CAS.
- A. Safavi and M. R. Baezat, Anal. Chim. Acta, 1998, 358, 121 CrossRef CAS.
- S. A. Halvatzis, M. M. Timotheou-Potamia and A. C. Calokerinos, Analyst, 1993, 118, 633 RSC.
- S. A. Halvatzis, M. M. Timotheou-Potamia and T. P. Hadjioannou, Anal. Chim. Acta, 1993, 272, 251 CrossRef CAS.
- A. Safavi and M. A. Karimi, Anal. Chim. Acta, 2002, 468, 53 CrossRef CAS.
- H. Y. Liu, L. Zhang, Y. H. Hao, Q. J. Wang, P. G. He and Y. Z. Fang, Anal. Chim. Acta, 2005, 541, 185 CrossRef.
- Z. Wang, Z. Zhang, Z. Fu, W. Luo and X. Zhang, Anal. Lett., 2003, 36, 2683 CrossRef CAS.
- I. F. Al-Momani, Anal. Sci., 2006, 22, 1611 CrossRef CAS.
- S. M. Z. Al-Kindy, A. Al-Wishahi and F. E. O. Suliman, Talanta, 2004, 64, 1343 CrossRef CAS.
- S. M. Z. Al-Kindy, F. E. O. Suliman, A. A. Al-Wishahi, H. A. J. AL-Lawati and M. Aoudia, J. Lumin., 2007, 127, 291 CrossRef CAS.
- Z. D. Zhang, W. Baeyens, W. Zhang and G. Van-der-Weken, J. Pharm. Biomed. Anal., 1996, 14, 939 CrossRef CAS.
- P. J. Rousseeuw; A. M. Leroy; Robust Regression and Outlier Detection, Wiley, New York, 1987 Search PubMed.
- P. D. Lark; B. R. Craven; R. C. L. Bosworth; The Handling of Chemical Data, Pergamon, Exeter, 1968, Chapter 4 Search PubMed.
- D. L. Massart; B. G. M. Vandeginste; S. N. Deming; L. Kaufman; Chemometrics: A Textbook, Oxford, 1988, pp. 75 Search PubMed.
- J. N. Miller, Analyst, 1991, 116, 3 RSC.
- G. Long and J. D. Winefordner, Anal. Chem., 1983, 55, 712A CrossRef CAS.
- C. A. Clayton, J. W. Hines and P. D. Elkins, Anal. Chem., 1987, 59, 2506 CrossRef CAS.
- J. Joseph-Charles and M. Bertucat, J. Liq. Chromatogr. Relat. Technol., 1999, 22, 2009 CrossRef CAS.
| This journal is © The Royal Society of Chemistry 2010 |
