Characterization of Escherichia coli suspensions using UV/Vis/NIR absorption spectroscopy
Johannes
Kiefer
*a,
Nina
Ebel
b,
Eberhard
Schlücker
b and
Alfred
Leipertz
a
aLehrstuhl für Technische Thermodynamik (LTT) and Erlangen Graduate School in Advanced Optical Technologies (SAOT), Universität Erlangen-Nürnberg, Am Weichselgarten 8, 91058, Erlangen, Germany. E-mail: jk@ltt.uni-erlangen.de; Fax: 0049 9131 8529901; Tel: 0049 9131 8529766
bLehrstuhl für Prozessmaschinen und Anlagentechnik (iPAT), Universität Erlangen-Nürnberg, Cauerstraße 4, 91058, Erlangen, Germany
First published on 26th November 2009
Abstract
In this paper we demonstrate that conventional absorption spectroscopy in the ultraviolet, visible and near-infrared spectral range facilitates characterization of Escherichia coli (E. coli) suspensions. Two kinds of samples have been studied: (1) Untreated E. coli suspensions with systematically varied cell concentration and (2) E. coli treated by different inactivation procedures. For the purpose of inactivation the bacteria have been treated by either heat at elevated temperature as an established method or by hydrostatic or dynamic high pressure. The results show that at cell concentrations above a certain threshold extinction measurements in the ultraviolet region can yield a quantitative measure of the cell number density with optimal sensitivity and precision. Furthermore, examining suitable spectral regions the absorption spectra reveal characteristic features hence allowing identification of the treatment procedure later on. In conclusion, this study establishes a simple and cost-efficient approach for online and in-situ monitoring of processes for the inactivation of microbiological organisms. Moreover, the method provides a tool for the investigation of the inactivation mechanisms.
Introduction
Nowadays consumers strongly rely on the quality of food assuming that no harmful substances are contained. Such substances can either be toxic non-organic matter like biocide residuals or microbiological organisms such as bacteria and fungi. The latter are mainly responsible for the storage life of food, but in principle both matters can lead to serious illnesses and be life threatening. For this reason, the development of inactivation methods is of utmost importance in the field of food technology in order to warrant high quality and hence satisfied customers. However, along with the inactivation procedure it is also vital to find reliable techniques which facilitate the characterization of the treated samples and thus allow process control.In the past numerous approaches to inactivate microbiological organisms have been demonstrated and applied. As this work focuses on Escherichia coli as an example bacterium a short overview over selected, recent activities is given considering E. coli only. A common method to achieve inactivation is the direct exposure of the contaminated sample to certain additives. For instance, gaseous ozone and hot water or steam may be employed in this context. Dorsa et al.1 investigated the dependence of the decontamination efficiency on temperature applying steam, hot water spray washes and a steam-vacuum sanitizer to sheep and beef carcasses aiming at a reduction of fecal bacteria like E. coli. Selma and co-workers2 investigated the potential of hot water and gaseous ozone employed to cantaloupe melons. They reported that both methods allow efficient reduction of the total microbial population, however the combination of both was found to be most successful. Moreover, the sensory quality of the samples was not affected by the treatment. Another promising approach is the use of dense phase or supercritical carbon dioxide. For instance, Liao et al.3 investigated the inactivation kinetics of E. coli at different pressure and temperature revealing a change of the mechanism with exposure time. In a follow-up study4 they compared the experimental results with model calculations and obtained good agreement. Furthermore, photocatalytic inactivation of E. coli can be achieved using ultraviolet radiation in combination with suited catalysts like titania, TiO2,5 or silver ions.6
However, all methods mentioned above are based on the exposure of the samples to additional substances; hence they either require a further removal step or they may exert a long-lasting influence on the food. Both may be not wanted. For this reason more or less non-invasive methods have been developed employing heat at elevated temperature, electric fields or pressure for instance. Sterilization employing heat is by far the oldest, most common and effective way to inactivate microbial matter, but it may also cause destruction of valuable nutrients. A more gentle procedure in this respect is the application of electric fields. A short overview over past activities along with a description of inactivation mechanisms using pulsed electric fields to E. coli has recently been given by El Zakhem et al.7 Other processes of increasing interest employ high hydrostatic pressure (HHP) in single- or multiple-cycle applications, see e.g.8–10 The physiological aspects of HHP on eukaryotic cells have recently been discussed by Frey et al.11 However, although these methods do not require the exposure of the food samples to additional substances the characterization of the samples after the treatment is usually complicated.
The most common approach to enumerate viable cells after inactivation treatment is the total plate count (TPC) method. Small parts of the sample, before and after treatment, are diluted with sterile 0.9% sodium chloride solution and subsequently incubated on plates, e.g., at 37 °C for 24 h. Eventually, the colonies are counted. In general, this procedure is time consuming and complicated.
In contrast, optical spectroscopic methods in principle allow online and in-situ measurements. Techniques based on light scattering phenomena like Raman spectroscopy are actually well suited in this respect, see for instance Ref. 12, however in complex systems such as suspensions containing microorganisms and biochemical substances the interpretation of the spectra can be rather complicated as almost all molecules contribute to the signal. For this reason, more specific methods especially absorption based techniques have gained major impact in numerous fields in engineering applications and fundamental science, see e.g.13–15, as they provide both qualitative and quantitative information of selected species. During the last decade such methods have also entered the area of microbiology and food technology, where most studies investigated the near-infrared spectral range around 1000 nm. For instance, Sasic and Ozaki16 quantitatively analyzed fat, proteins and lactose in milk in the 800–1100 nm spectral region. Büning-Pfaue17 investigated the state of water in different food samples using NIR spectroscopy between 730 and 2300 nm. Wu et al.18 measured the fat, protein and carbohydrate content in milk powder samples using absorption spectroscopy in the 800–1050 nm spectral range. Spectroscopy in the ultraviolet and visible spectral range has also been used to study bacterial cells and their suspensions.19 For instance, Alupoaei et al. employed UV/Vis absorption spectroscopy to obtain quantitative information from E. coli suspensions in order to study the growth behavior of the bacteria.20,21 For analyzing the spectra they developed an interpretation method based on the theory of light scattering, an approximation of the constituents' optical properties and spectral deconvolution approaches.22
In this paper we show the application of absorption spectroscopy in the ultraviolet, visible and near-infrared spectral ranges for the characterization of Escherichia coli samples. E. coli has been selected as an example microorganism because it is well known and therefore often employed for this purpose. E. coli is a gram-negative bacterium with a size of approximately one micron and contains a large number of different proteins, RNAs and ribosomes. The spectroscopy is applied before and after different inactivation procedures employing heat and high-pressure or combinations of both. The results are discussed and compared to the conventional total plate count method.
Experimental
Bacterial strain and growth conditions
A stock culture of E. coli K12MG1655 was maintained on Standard 1 (St1) agar plates (all chemicals from Carl Roth GmbH & Co. KG, Karlsruhe, Germany). E. coli was subcultured by transferring a single colony from the stock plate to an Erlenmeyer flask containing 50 mL of St1 broth (pH 7.5), which was then incubated statically at 30 °C for 10 h. The main culture was inoculated with 2 mL of the starter culture into 200 mL of St1 broth and was grown statically at 30 °C for 14 h, until it reached stationary phase.Sample preparation
For the cell number density determination experiments the main culture was diluted in several steps with St1 to obtain suspensions with cell concentration covering a range of approximately 8 orders of magnitude.For the inactivation experiments the main culture was diluted with St1 to obtain a 106 cells/mL suspension. Samples of approximately 2 mL were transferred aseptically to 1.8 mL Cryo.S reaction vials (Greiner bio-one GmbH, Frickenhausen, Germany), which were additionally sealed tightly with Parafilm (Brand GmbH & Co. KG, Wertheim, Germany). The vials had to be filled completely with the liquid in order to avoid air bubbles. The samples were then placed on ice until further handling. For control purposes cell death was induced by heating for 20 min at 65 °C.
High-pressure treatment
High-pressure treatment was performed using a pressure vessel of 70 mL inner volume, which was capable for operation at pressures as high as 700 MPa. Pressure was generated using a pneumatically driven pressure intensifier (Maximator G 400 2L 01, Schmidt, Kranz & Co GmbH, Zorge/Südharz, Germany). Hydraulic oil (Tivela S220, Shell, Hamburg; Germany) was used as pressure transmitting fluid. The pressure inside the autoclave was monitored using a strain gauge (HBM, Darmstadt, Germany) and the measuring software based on LabVIEW 7.1 (National Instruments, Austin; USA). The samples were treated with ten single pressure pulses of 300 MPa at 30 sec intervals. Some samples were subsequently additionally treated by heat at elevated temperature (20 min at 65 °C). All procedures guaranteed a complete inactivation of the samples.Enumeration of viable cells
The total plate count method was used to determine the number of viable cells. Treated samples were plated undiluted onto St1 agar plates. These were incubated for 18 h at 30 °C after which the colony forming units (CFU) were counted. The samples were additionally recultivated in fresh St1 medium at 30 °C for 72 h to ensure no further cell growth.Absorption spectroscopy
For the spectroscopic measurements a commercially available spectrometer (Perkin Elmer UV/VIS Spectrometer Lambda 40) has been employed. The device has two modes of operation: either the temporal evolution of the absorption can be recorded at a fixed wavelength (e.g., for flow injection analysis23) or scanning the wavelength for recording a spectrum. The second option has been used herein obtaining absorption spectra in the spectral range between 300 and 1100 nm at 1 nm scanning interval. For this purpose the samples have been filled into disposable cuvettes made of polystyrene with an absorption length of 10 mm.Results and discussion
Cell number determination
In order to investigate the capability of the employed spectroscopic technique for the determination of the cell concentration the spectra of a series of diluted suspension samples were investigated. Note, that a small part of the samples was removed and analyzed using the total plate count method as a reference. The latter revealed that the following cell contents were obtained: 0 (medium), 5*102 (sample e2), 6*104 (e4), 7*106 (e6), 7*107 (e7) and 7*108 (e8) cells/mL. The corresponding absorption spectra are displayed in Fig. 1. In the UV around 300 nm the entire light is absorbed by the samples even in the pure medium (the spectrum will be further discussed in the subsequent section). Another feature present in all spectra is a broad absorption band between 900 and 1050 nm which can be attributed to a water vibrational combination band (2v1 + v3 with v1, symmetric stretching; v3, anti-symmetric stretching).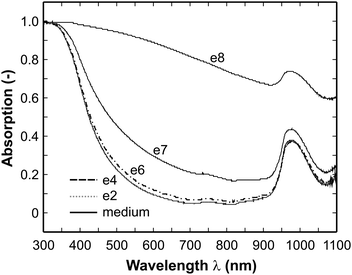 | ||
| Fig. 1 Absorption spectra of suspensions with different cell content (cell concentrations: 0 (medium), 5*102 (e2), 6*104 (e4), 7*106 (e6), 7*107 (e7) and 7*108 (e8) cells/mL). In this diagram the curves of the medium and the samples e2 and e4 overlap with each other and can not be distinguished. | ||
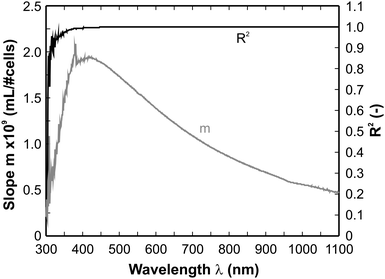
In principle, the spectra at cell concentrations below 105 cells/mL do not differ from each other at all. This defines the lower limit of the sensitivity of the method. In this concentration range the medium is dominating. Going to higher cell number densities the absorption increases in the full spectral range under investigation, hence it can in principle be utilized for cell number determination. In order to select an appropriate or rather the optimal wavelength a computational procedure has been used for the analysis of the spectra. This method has been developed in a previous study for the evaluation of infrared spectra24 and can be described in a nutshell as follows.
The quantification of data obtained from absorption-based techniques is usually based on the Beer–Lambert relation as given in Equation (1)
| E = −log10(1 − A) = ε(λ)cd | (1) |
| E = m·c + b | (2) |
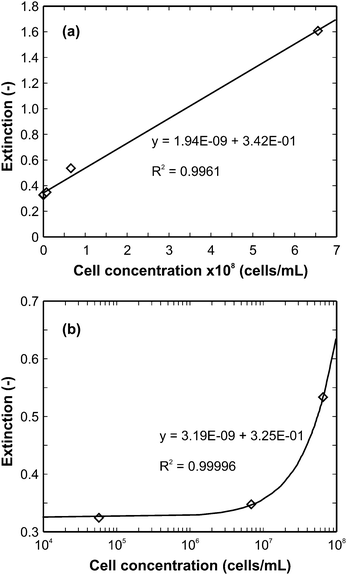 | ||
| Fig. 3 Extinction as a function of cell concentration at 420 nm absorption wavelength: (a) entire cell concentration range investigated, (b) selected range on a log-scale. The diamonds represent experimental data, the solid lines show the best-fit linear functions. | ||
Inactivation experiments
In the second series of experiments the spectra from E. coli samples have been recorded after inactivation treatment. Typical absorption spectra of different samples are displayed in Fig. 4 showing the full spectral range from 300 to 1100 nm. In detail, spectra of neat water, the pure medium without microbial content and an E. coli sample before treatment (106 cells/mL) are shown along with spectra after a dynamic high-pressure treatment, heat treatment and a combination of both (the plate count method revealed that all 106 cells/mL have been completely inactivated). Like in the data shown beforehand between 900 and 1050 nm a broad absorption feature can be identified in all spectra which can be attributed to the water vibrational combination band. However, looking at the full spectra only, characterization of the samples seems to be difficult or even impossible as the spectra look almost identical. In principle, only the water transmission curve can clearly be distinguished from the others in the region below 900 nm as it shows prominently no absorption in the visible and ultraviolet spectrum while the other samples do. Therefore a close look is required. In general, it should be mentioned that in the ultraviolet (typically around 350 nm and below), where strong absorption is observed in Fig. 4, the absorption behavior is typically caused by nucleic acids.27 Since in our experiment also the pure medium shows strong absorption in this range there is obviously a substantial amount of absorbing species present, which is not DNA or RNA. Owing to the preparation procedure of the medium it is likely that Maillard reaction products were formed from glucose and amino acids. These substances can absorb light in the UV and visible spectrum,28 hence in our spectra they superpose the contributions from the microorganisms.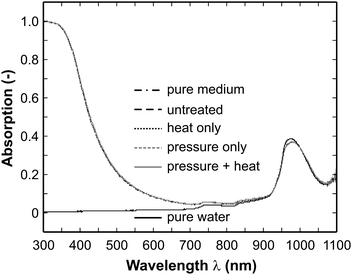 | ||
| Fig. 4 Absorption spectra of selected samples in the spectral range 300–1100 nm (untreated: 106 cells/mL, heat, pressure, combination: completely inactivated (6 log reduction)). Except for the water spectrum all spectra are in close vicinity to each other and can not be distinguished in this diagram. Differences are visible in the enlarged spectra shown in Figs. 5, 6 and 7. | ||
Fig. 5 illustrates the enlarged spectra in the range between 350 and 400 nm. Obviously, two branches can be distinguished in this spectral range. While the spectra of the untreated sample and that one after high-pressure treatment strictly follow the absorption of the pure medium, the spectra after application of heat (also in combination with high-pressure) show higher absorption. Interestingly, all spectra in the respective branches overlap perfectly. The total plate count method revealed that no microorganisms survived the inactivation treatment (neither high-pressure nor heat or combined). As commonly known the heat treatment destroys the cell membrane and hence the released substances in particular the nucleic acids result in stronger absorption in the spectrum displayed in Fig. 5.
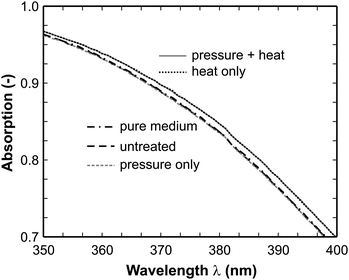 | ||
| Fig. 5 Enlarged absorption spectra in the range 350–400 nm (untreated: 106 cells/mL, heat, pressure, combination: completely inactivated (6 log reduction)). The spectra after pressure and heat, and after only heat treatment form one branch (upper) and all other spectra form another branch (lower) where the individual spectra perfectly overlap with each other. | ||
In Fig. 6 the enlarged spectra from 800 to 900 nm are displayed. There they split up into three branches, where pure water shows the weakest absorption. The strongest absorption occurs in the spectrum of the sample which was treated with pressure and heat. However, in contrast to the spectral range 350–400 nm the absorption of the sample inactivated by heat only does not follow here. From this result we assume that the pure high-pressure treatment does not affect the cell membrane but causes major damage inside the E. coli bacteria and finally leads to inactivation. Several groups have reported strong influences of high-pressure to the structure of proteins and other biomolecules, see for instance 29–31. This supports our theory. In the spectral range between 800 and 900 nm the damaged cell constituents which are released after heat treatment lead to a stronger absorption, while the undamaged cell contents (also released after heat treatment only) do not show this behavior. As mentioned above the high-pressure treatment influences the structure of, e.g., proteins which in turn can change their optical properties. In the spectrum shown in Fig. 6 it is likely that a modified behavior of some overtone or combination bands of the NH and OH groups lead to a slightly enhanced absorption.
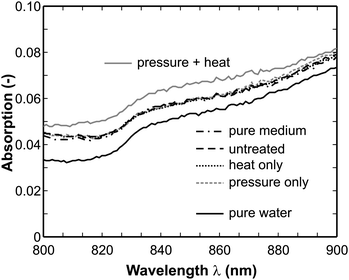 | ||
| Fig. 6 Enlarged absorption spectra in the range 800–900 nm (untreated: 106 cells/mL, heat, pressure, combination: completely inactivated (6 log reduction)). The spectra form three different branches: the upper one is the spectrum after heat and pressure treatment, the lower one is the spectrum of pure water; in between all other spectra form one branch and overlap with each other. | ||
Fig. 7 shows the spectra between 900 and 1000 nm, i.e. the range where the water absorption occurs. There the water and the pure medium spectra form one branch, while all E. coli containing samples show weaker absorption. At first glance this might be attributed to the fact that the pH value changes in the presence of E. coli compared to water and medium and thus might influence the water vibrational structure. However, we recorded spectra of a number of diluted hydrochloric acid samples in a corresponding pH range and did not see a similar behavior. Therefore, this can not be the true explanation. A more likely reason may be that the water molecules coat the cells in a defined way and as a result the vibration of the water combination band is influenced. However, this requires further investigation in future works as it is beyond the scope of the present paper.
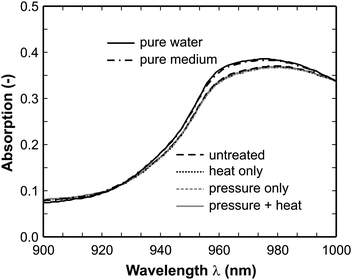 | ||
| Fig. 7 Enlarged absorption spectra in the range 900–1000 nm (untreated: 106 cells/mL, heat, pressure, combination: completely inactivated (6 log reduction)). The spectra of pure water and the pure medium form the upper branch and all other spectra overlap with each other forming the lower branch. | ||
Summary and conclusion
In the present paper we have investigated the capability of absorption spectroscopy in the ultraviolet, visible and near-infrared spectral range for the characterization of Escherichia coli suspensions. E. coli samples have been prepared with and without different inactivation procedures employing heat, high-pressure or a combination of both. In conclusion, UV/Vis/NIR absorption spectroscopy provides an easily applicable and cost-effective tool for the characterization of E. coli suspensions. A computational analysis of absorption spectra recorded in suspensions with systematically varied cell number density revealed that the spectral range around 420 nm provides a high sensitivity for the quantitative determination of the amount of cells. In the range 350–400 nm it seems possible to distinguish between cells with a damaged and those with an undamaged membrane. In the range between 800–900 nm it is possible to detect cell contents that have been released after destruction of the cell membrane.The differences in the spectra of untreated samples and samples after heat and high-pressure treatments are probably due to different inactivation mechanisms. Obviously, heat treatment causes significant damage of the cell membrane while the applied pure high-pressure procedures cause intracellular damage only. When the cell membrane is damaged the cell contents, i.e., mainly nucleic acids, are released and lead to an enhanced absorption in the ultraviolet. The high-pressure treatment affects the structure of proteins and other biomolecules. However, this manifests in a change in the NIR spectral range, but only when the substances are released into the suspension by a subsequent heat treatment for example. For the sake of completeness it should be mentioned that our experiments have been repeated several times at different days showing similar results, hence indicating the reproducibility of the technique.
Acknowledgements
Part of the work was financially supported by the German Research Foundation (DFG) which also funds the Erlangen Graduate School in Advanced Optical Technologies within the framework of the Excellence Initiative of the German Federal and State Governments.References
- W. J. Dorsa, C. N. Cutter, G. R. Siragusa and M. Koohmaraie, J. Food Prot., 1996, 59, 127–135.
- M. V. Selma, A. M. Ibánez, A. Allende, M. Cantwell and T. Suslow, Food Microbiol., 2008, 25, 162–168 CrossRef CAS.
- H. Liao, X. Hu, X. Liao, F. Chen and J. Wu, Int. J. Food Microbiol., 2007, 118, 126–131 CrossRef CAS.
- H. Liao, Y. Zhang, X. Hu, X. Liao and J. Wu, Int. J. Food Microbiol., 2008, 126, 93–97 CrossRef CAS.
- A. K. Benabbou, Z. Derriche, C. Felix, P. Lejeune and C. Guillard, Appl. Catal., B, 2007, 76, 257–263 CrossRef CAS.
- J. Y. Kim, C. Lee, M. Cho and J. Yoon, Water Res., 2008, 42, 356–362 CrossRef CAS.
- H. El Zakhem, J.-L. Lanoiselle, N. I. Lebovka, M. Nonus and E. Vorobiev, Int. J. Food Microbiol., 2007, 120, 259–265 CrossRef CAS.
- P. Morales, J. Calzada, M. Avila and M. Nunez, J. Food Prot., 2008, 71, 811–815.
- S. Buzrul, H. Alpas, A. Largeteau and G. Demazeau, Int. J. Food Microbiol., 2008, 124, 275–278 CrossRef CAS.
- N. Narisawa, S. Furukawa, T. Kawarai, K. Ohishi, S. Kanda, K. Kimijima, S. Negishi, H. Ogihara and M. Yamasaki, Int. J. Food Microbiol., 2008, 124, 103–107 CrossRef CAS.
- B. Frey, C. Janko, N. Ebel, S. Meister, E. Schlücker, R. Meyer-Pittroff, R. Fietkau, M. Herrmann and U. S. Gaipl, Curr. Med. Chem., 2008, 15, 2329–2336 CrossRef CAS.
- J. Kiefer, T. Seeger, S. Steuer, S. Schorsch, M. C. Weikl and A. Leipertz, Meas. Sci. Technol., 2008, 19, 085408 CrossRef.
- J. Kiefer, J. Fries and A. Leipertz, Appl. Spectrosc., 2007, 61, 1306–1311 CrossRef CAS.
- J. Kiefer, D. N. Kozlov, T. Seeger and A. Leipertz, J. Raman Spectrosc., 2008, 39, 711–721 CrossRef CAS.
- J. Kiefer, Z. S. Li, J. Zetterberg, M. Linvin and M. Aldén, Opt. Commun., 2007, 270, 347–352 CrossRef CAS.
- S. Sasic and Y. Ozaki, Anal. Chem., 2001, 73, 64–71 CrossRef CAS.
- H. Büning-Pfaue, Food Chem., 2003, 82, 107–115 CrossRef.
- D. Wu, Y. He and S. Feng, Anal. Chim. Acta, 2008, 610, 232–242 CrossRef CAS.
- D. G. Brown and P. R. Jaffé, Biotechnol. Bioeng., 2001, 74, 476–482 CrossRef CAS.
- C. E. Alupoaei and L. H. García-Rubio, Biotechnol. Bioeng., 2004, 86, 163–167 CrossRef CAS.
- C. E. Alupoaei, J. A. Olivares and L. H. García-Rubio, Biosens. Bioelectron., 2004, 19, 893–903 CrossRef CAS.
- C. E. Alupoaei and L. H. García-Rubio, Chem. Eng. Commun., 2005, 192, 198–218 CrossRef CAS.
- J. Kiefer and A. Leipertz, Chem. Ing. Tech., 2009, 81, 441–446 CrossRef CAS.
- J. Kiefer, K. Obert, A. Bösmann, T. Seeger, P. Wasserscheid and A. Leipertz, ChemPhysChem, 2008, 9, 1317–1322 CrossRef CAS.
- J. Kiefer, K. Obert, S. Himmler, P. S. Schulz, P. Wasserscheid and A. Leipertz, ChemPhysChem, 2008, 9, 2207–2213 CrossRef CAS.
- J. Kiefer, K. Obert, J. Fries, A. Bösmann, P. Wasserscheid and A. Leipertz, Appl. Spectrosc., 2009, 63, 1041–1049 CrossRef CAS.
- J. Sambrook, E. F. Fritsch and T. Maniatis, eds., Spectrophotometric determination of the amount of DNA and RNA, in: Molecular Cloning, 2nd ed., Cold Springs Harbor Laboratory Press, New York, 1989 Search PubMed.
- J. S. Kim and Y. S. Lee, Amino Acids, 2009, 36, 465–474 CrossRef CAS.
- K. Heremans, Annu. Rev. Biophys. Bioeng., 1982, 11, 1–21 Search PubMed.
- K. Heremans and L. Smeller, Biochim. Biophys. Acta, Protein Struct. Mol. Enzymol., 1998, 1386, 353–370 Search PubMed.
- R. Winter and W. Dzwolak, Cell. Mol. Biol., 2004, 50, 397–417 Search PubMed.
| This journal is © The Royal Society of Chemistry 2010 |

