Rapid analysis of polybrominated diphenyl ethers by ion attachment mass spectrometry
Yuka
Sato
*,
Mitsuhiro
Oki
,
Asato
Kondo
,
Miyuki
Takenaka
and
Hideki
Satake
1, Komukai-Toshiba-cho, Saiwai-ku, Kawasaki, 212-8582, Japan. E-mail: yuka.mastumoto@toshiba.co.jp; Fax: + 81 44 520 1307; Tel: +81 44 549 2175
First published on 18th March 2010
Abstract
Novel rapid analytical method was developed for evaluating polymers for the presence of polybrominated diphenyl ethers (PBDEs), which have been prohibited by the RoHS directive, using ion attachment mass spectrometry (IAMS). IAMS requires no chemical pretreatment or separation process for the individual organic compounds before analysis because of its “soft” ionization feature. When measurement was performed for a standard solution of decabromodiphenly ether (decaBDE), no fragment ions were detected. The optimum analysis conditions for polymers were determined using reference materials. When polymers containing decaBDE were analyzed by IAMS under the optimum conditions, a decaBDE concentration of approximately 300 ppm (in the case of 1-mg solid sample for analysis) could be detected with no fragmentation. Even if other brominated compounds, such as ethylene (bis-tetrabromophthal)imide (EBTBPI) and bis(pentabromophenyl)ethane (BPBPE) were present in the sample together with decaBDE, each compound could be identified successfully. In addition, with respect to the validation of IAMS, it was confirmed the limit of detection (LOD) and the limit of quantification (LOQ) for decaBDE were 13.5 and 45.0 ppm (in the case of 1-mg solid sample for analysis), respectively, and that the calibration curve showed good linearity (R2 = 0.9962) within the range of 0.04 to 2.00 μg. The recovery of the decaBDE from the certified reference materials was 81.4% for the 317-ppm sample and 85.4% for 886-ppm sample.
Introduction
Since the “Directive on the restriction of the use of certain hazardous substances in electrical and electronic equipment” (commonly referred to as the Restriction of Hazardous Substances directive of the RoHS directive) came into force in the European Union (EU) in July 2006,1 some of the same regulations on chemical management have been adopted in other parts of the world.2,3 The RoHS directive restricts the amount of polybrominated biphenyls (PBBs) and polybrominated diphenyl ethers (PBDEs) contained in electrical and electronic equipment to less than 1000 ppm.PBBs and PBDEs are among the large variety of brominated flame retardants (BFRs) used in plastics and textiles. PBBs are no longer produced, but PBDEs were in widespread use before the RoHS directive came into effect, and various recycled polymers may contain PBDEs.4 Thus it is now necessary for manufacturing companies to control PBDEs right from the upstream stage of the manufacturing process, such as the design or procurement stage. However, the supply of materials and components is increasingly globalized, and the number of components in products has increased to the level of thousands. Therefore, quality control for all materials and components needs to be not only reliable, but also efficient.
Recently, IEC 62321 has been published as an international standard for RoHS testing.5 The IEC 62321 method consists of two steps, screening and high-precision chemical analysis. Regarding PBDEs, the suggested method is screening by fluorescent X-ray analysis (XRF), followed by precision analysis by solvent extraction GC-MS. However, this method is only included in the informative annex because its reliability has not been confirmed. Other precision analysis methods, such as HPLC-UV/MS,6 GPC-HPLC-UV,6 GC-ECD,7 GC-AED,8 and GC-ICP-MS,9 have been previously reported for PBDEs. However, these methods have various problems. Some are time-consuming, while others require the use of toxic solvents for sample preparation for quality control. Therefore a determination analysis method that does not need the use of a toxic solvent in the confirmatory analysis is required.
Several spectroscopic methods, such as Fourier transform infrared (FT-IR) spectroscopy10 and Raman spectroscopy11 are used for the rapid analysis of PBDEs in polymers. Although these methods require no solvent and are relatively quick, they cannot identify all PBDE congeners. Additionally, in the analysis of actual samples, the polymer matrix may interfere in the detection of PBDEs.
When mixtures, such as actual samples, are analyzed by mass spectrometry methods, it is usually necessary for each component of the mixture to be separated by chromatography (such as GC or HPLC), because peaks of fragment ions may be detected from one of the components. As a solution to these problems, ion attachment mass spectrometry (IAMS), a “soft” ionization method, is noteworthy.12 In this method, alkali-metal ions are attached to the sample molecules and the resulting adduct ions are detected. Mass spectrometry using ionization by alkali-metal ion attachment was first developed in 1971 by Beauchamp,13 then the technique has used for research related to free radical species,14 perfluoro compounds,15 and so on.
Recently, a mass spectrometer that produces ionization by alkali-metal ion attachment using direct injection probe was placed on market. This mass spectrometer can analyze solid samples without dissolution. Lithium ions (Li+) are commonly used for ionization in IAMS. Fragmentation is difficult because the attachment energy of Li+ (< 2 eV) is lower than the atomic binding energies of most molecules. Therefore, solely ion per component is detected in most cases, and the identification of the components of mixtures is very simple, because separation of the components is not required. As a result, the analysis time can be shortened to within 10 min. In addition, this mass spectrometer with direct injection probe enables the analysis of industrial materials such as polymers without the use of any toxic solvent.
In this paper, we demonstrate that IAMS is an effective for rapid solvent-free determination analysis method for PBDEs in polymers by comparing it with FT-IR spectroscopy, which is one of the conventional rapid and solvent-free analysis methods. Decabromodiphenyl ether (decaBDE), which was recently included in the list of compounds restricted by the RoHS directive,16 was used widely till a short time ago;4 therefore, the probability that decaBDE is present in recycled polymers is higher than other PBDEs. In addition, decaBDE has the largest molecular weight and the highest boiling point among the PBDEs. Therefore, decaBDE is the most difficult PBDE to measure. For this reason, we selected decaBDE as the target compound for this study.
Experimental
Chemicals and samples
For confirmatory mass spectrum of decaBDE by IAMS, a standard solution of decaBDE (50 μg ml−1 in isooctane: toluene 9:1) purchased from AccuStandard (Connecticut, USA) was used. The calibration curve was obtained by dissolving decaBDE (DE-83R, 98.6 wt%, Great Lakes Chemical Corp. (Indiana, USA)) in toluene (Wako Pure Chemical Industries, Ltd., Osanka, Japan). For confirmatory absorptions of decaBDE by FT-IR, decaBDE (Wako Pure Chemical Industries, Ltd., Osanka, Japan, 98 wt%) was used.The polymer samples used for this research are as shown in Table 1. The samples were of two types: reference materials containing known concentrations of decaBDE and industrial parts (parts of commercial products) whose Br content was detected by XRF. Reference materials No. 1 to 3 in Table 1 were obtained from Analysis Center Co., Ltd (Tokyo, Japan). Certified reference materials NMIJ CRM 8108-a (No. 4 in Table 1) and NMIJ CRM 8110-a (No. 5 in Table 1) were obtained from Advanced Industrial Science and Technology (AIST, Tsukuba, Japan), while IRMM-310 (No. 6 in Table 1) was obtained from the Institute for Reference Materials and Measurements (Geel, Belgium). The industrial parts samples were analyzed by GC-MS and the brominated compounds contained in the samples were identified beforehand. Recovery for this optimal method of IAMS was carried out using certified reference materials No. 4 and No. 5 in Table 1.
| No. | Type | Matrix polymer | DecaBDE (ppm)a | |
|---|---|---|---|---|
| a The decaBDE concentrations of the reference materials were the values indicated by the manufacturers. The decaBDE concentrations of the industrial parts were determined by GC-MS. b N.D. = Not detected. | ||||
| 1 | Reference materials | ABS | 890 | |
| 2 | ABS | 9500 | ||
| 3 | ABS | 98000 | ||
| 4 | Certified reference materials | CRM 8108-a | PS | 317 ± 14 |
| 5 | CRM 8110-a | PS | 886 ± 28 | |
| 6 | IRMM310 | PET | 689 | |
| 7 | Industrial parts | PBT | 930 | |
| 8 | PS | 3900 | ||
| 9 | ABS | N.D.b | ||
Equipment
Screening of the individual samples was performed by X-ray fluorescence spectrometry using an SEE2210A made by SII Nanotechnology Japan (Tokyo, Japan). To determine the decaBDE in the industrial samples, GC-MS analysis was performed on a Hewlett-Packard Model 6890 gas chromatograph equipped with an HP 5973 mass spectrometer (Agilent Technologies, California, USA) after cryogenic grinding with liquid nitrogen followed by Soxhlet extraction.IAMS analysis
IAMS analysis was performed with an L-250G-IA (IA-Lab) made by Canon Anelva Technix (Kanagawa, Japan).17 The IAMS equipment consists of the Li+ attachment reaction chamber with Li+ emitter, the ion focusing system, and the quadropole mass spectrometer. The samples were put into aluminium pans, which were put on the direct injection probe (DIP) of the IAMS equipment. The polymer samples were cut into small pieces of around 1 mg using nippers or a box cutter before they were put into the pans (up to 5 pans can be placed on the DIP at one time). In the case of standard solution, around 2 ml using micro syringes were also put into the pans. The samples on the DIP were sent into the reaction chamber one by one and were thermally desorbed by programming the DIP so that temperature was held at 100 °C for 1 min and then raised to 300 °C at a rate of 256 °C min−1. Primary Li+ are produced by heating Li+ emitter, which is small bead (a sintered compact composed of Li2O, Al2O3, and SiO2) fused to filament Ir wire. The thermal desorbed sample molecules (M) form adducts ((M + Li)+) with Li+ in the reaction chamber. Nitrogen gas of 100 Pa is introduced to the reaction chamber, which decelerate Li+ in order to bring more energy balance to formed Li+ adducts in the reaction chamber. Additionally, Nitrogen gas has a function to remove excess energies of Li+ adducts equivalent to Li+ affinities for sample molecules in order to stabilize adducts. The Li+ adducts pass through the ion focusing system, then they are detected by the quadropole mass spectrometer subsequently. The mass spectrometer was operated in scan mode with an m/z range of 50 to 1000. Acetone gas was introduced into the Li+ attachment reaction chamber. The sample intensity was decreased as the increase of matrix polymers and acetone was also shown the same tendency like sample intensity. Therefore acetone was used in order to correct the sample intensity. The peak areas of decaBDE per the average of the acetone intensities during detecting decaBDE were used as the y-axis for the calibration curve.FT-IR spectroscopy analysis
FT-IR spectroscopy analysis was performed using ATR mode. The analysis was performed on a Nicolet 6700 spectrometer equipped with a DTG-S detector and a 45° diamond ATR crystal (Thermo Scientific, Yokohama, Japan). Spectra were obtained using advanced ATR correction. To confirm the absorptions of decaBDE, a KBr tablet containing decaBDE was analyzed for reference.Results and discussion
Determination of decaBDE by IAMS
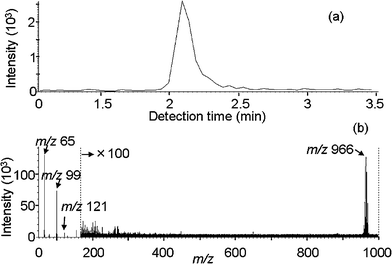 | ||
| Fig. 1 IAMS data for a decaBDE standard solution of 0.5 μg ml−1. The injection volume was 2 ml. (a) Ion current of m/z 966. (b) Mass spectrum for the detection time period of 2 to 2.5 min. | ||
Sample heating conditions. In the case of the analysis of polymers by IAMS, the sample heating conditions are extremely important for the efficient extraction of the target components from the matrix.
First, in order to determine the optimum initial temperature, the sample was heated from room temperature to 500 °C at a rate of 64 °C min−1. As shown in Fig. 2, the Li+ adduct of decaBDE (m/z 966, (M + Li)+) began to be detected from 100 °C to 150 °C and stopped being detected at 350 °C to 400 °C. The optimum initial temperature was therefore determined to be 100 °C, and the hold time was set to 1 min for stabilization of the temperature.
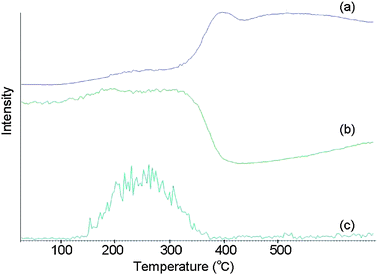 | ||
| Fig. 2 IAMS data for reference material No. 1 (890 ppm of decaBDE in ABS). (a) Total ion current. (b) Ion current for m/z 65. (c) Ion current for m/z 966. | ||
Next, in order to determine the optimum rate of temperature increase, the samples were analyzed by increasing temperature from 100 °C to 300 °C at 64 °C min−1, 128 °C min−1 and 256 °C min−1, and the ion currents of m/z 966 were compared. All the peak areas of decaBDE were almost the same, and the sharpest peak was obtained at 256 °C min−1. Therefore, the optimum rate of temperature increase was determined to be 256 °C min−1.
The final temperature should be determined so that the target components are extracted completely. However, setting a temperature that is too high can cause sensitivity degradation and instrument contamination, because low-volatile components may also be extracted. The chromatograms in Fig. 2 indicate that decaBDE (c) was extracted by 350 °C to 400 °C. However, at the same time, the intensity of acetone (b) decreased because many unnecessary compounds began to be extracted as indicated in the total ion chromatogram (c). Therefore, we compared chromatograms at the final temperatures of 250 °C, 300 °C, 350 °C, and 400 °C. When the final temperature was set at 250 °C, the decaBDE peak was broad, and extraction of decaBDE continued for 10 min after the temperature reached 250 °C. The sharpest peak was obtained at 400 °C, but a significant decrease of acetone intensity was seen. The decaBDE peaks at 300 °C and 350 °C could be obtained within a retention time of 6 min, and the intensity of acetone did not change dynamically, but the peaks were broader than that at 400 °C. The peak shapes at 300 °C and 350 °C were similar to each other with no significant differences. Based on these results, we decided on 300 °C as the optimum final temperature for extraction without unnecessary low-volatile compounds.
Sample amount. We investigated the obtained peak area per mg of sample for various sample amounts from 0.5 mg to 3 mg to determine the optimum sample amount for polymer analysis by IAMS (n = 5). As shown in Fig. 3, the peak area per mg of sample began to decrease at around 2 mg. In addition, the standard deviation was large at less than 0.1 mg and at more than 2.5 mg, and was minimum (6%) at 1 mg. These results indicate that heat conduction to the internal parts of the sample became more difficult as the sample size increased, resulting in the decrease in extraction efficiency when the sample size was large. The optimum sample amount was determined to be approximately 1 mg.
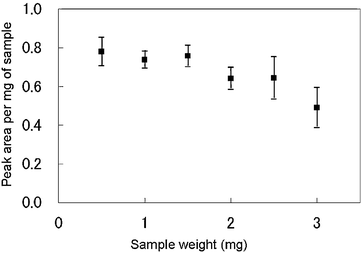 | ||
| Fig. 3 Variations of the decaBDE peak area per mg of sample with the sample amount used for IAMS. | ||
Sample matrix. The reference materials with decaBDE in ABS were used in above steps to determine analytical conditions. We also analyzed samples of PS (No. 5 in Table 1) and PET (No. 6 in Table 1) using the determined optimum conditions, and the obtained coefficients of variation were compared. The coefficients of variation for ABS, PS, and PET were 6.0%, 2.6%, and 4.4%, respectively. These results showed that the decaBDE contained in all the three matrix types of matrix could be determined using IAMS with the optimum conditions.
Reference materials. It was confirmed that decaBDE could be detected easily by IAMS even in the sample with the smallest decaBDE concentration (317 ppm in PS, No. 4 in Table 1) as can be seen in Fig. 4.
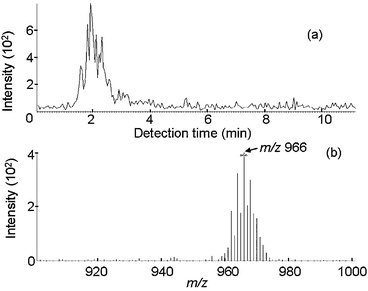 | ||
| Fig. 4 IAMS data for certified reference material No. 4 (317 ppm of decaBDE in PS). (a) Ion current for m/z 966. (b) Mass spectrum for the retention time period of 1 to 3 min. | ||
On the other hand, in FT-IR spectroscopy, distinctive decaBDE absorptions appear at around 1350, 1320, and 1310 cm−1 (Fig. 5 (b), (d)). In these absorption regions, there is a tendency of interference by the absorptions corresponding to the matrix polymers. Thus, the absorptions at around 615 and 555 cm−1 were also used for determination, even though these absorptions were relatively weak even at high concentrations of decaBDE. When reference materials were analyzed by FT-IR spectroscopy, the characteristic absorption of decaBDE were barely distinguishable for the sample with 98000 ppm of decaBDE (No. 3 in Table 1) as shown in Fig. 5 (a), and were not distinguishable for the sample with 890 ppm of decaBDE (No. 1 in Table 1). For this sample, even the strongest characteristic decaBDE absorption at 1350 cm−1 could not be distinguished (Fig. 5(c)). Thus IAMS can detect much lower concentrations of decaBDE than FT-IR spectroscopy.
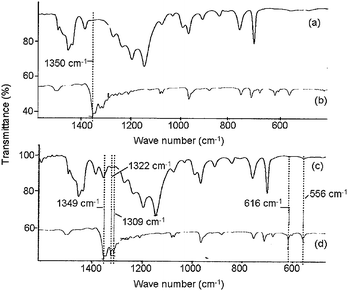 | ||
| Fig. 5 FT-IR spectra for reference materials. (a) Sample No. 3 (98000 ppm of decaBDE in ABS). (b) Reference (KBr tablet containing decaBDE). (c) Sample No. 1 (890 ppm of decaBDE in ABS). (d) Reference (KBr tablet containing decaBDE). | ||
Actual samples. Actual samples such as electronic equipment, polymers, and so forth sometimes contain several BFRs, especially in the case of recycled polymers. Therefore, the identification of PBDEs from other BFRs is also an important factor in qualitative analysis. We investigated the ability of the two analytical methods to identify PBDEs in samples that contain several BFRs.
The PBT sample (No. 7 in Table 1) whose decaBDE concentration was determined to be 930 ppm by GC-MS was analyzed by IAMS. The presence of decaBDE (m/z 966, (M + Li)+) and ethylene (bis-tetrabromophthal)imide (EBTBPI, m/z 958, (M + Li)+), another brominated compound, could be confirmed as can be seen in Fig. 6. In addition, the PS resin sample (No. 8 in Table 1) was also analyzed and the presence of decaBDE (m/z 966, (M + Li)+) and bis(pentabromophenyl)ethane (BPBPE, m/z 978, (M + Li)+) was confirmed as can be seen in Fig. 7. The molecular weights of DecaBDE and BPBPE are similar and their chromatograms overlap, but each compound could be identified based on their mass spectrum.
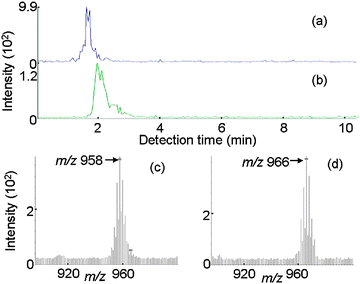 | ||
| Fig. 6 IAMS data for an actual sample (No. 7, 930 ppm of decaBDE in PBT). (a) Ion current for m/z 966. (b) Ion current for m/z 958. (c) Mass spectrum for the retention time period of 1 to 2 min. (d) Mass spectrum for the retention time period of 2 to 3 min. | ||
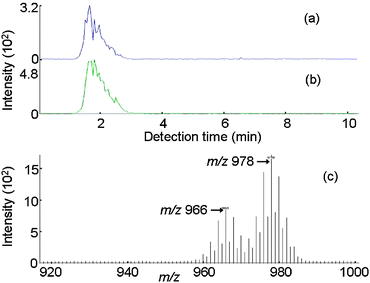 | ||
| Fig. 7 IAMS data for an actual sample (No. 8, 3900 ppm of decaBDE in PS). (a) Ion current for m/z 966. (b) Ion current for m/z 978. (c) Mass spectrum for the retention time period of 1 to 3 min. | ||
In the case of sample No. 9 (in Table 1), which Br was detected by XRF, whereas a PBDE was not detected by GC-MS, tetrabromobisphenol-A (TBBPA, m/z 551, (M + Li)+) could be detected by IAMS based on its mass spectrum as can be seen in Fig. 8.
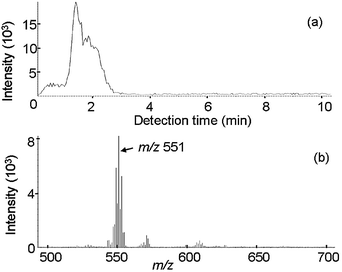 | ||
| Fig. 8 IAMS data for an actual sample (No. 9, ABS in which decaBDE was not detected). (a) Ion current for m/z 551. (b) Mass spectrum for the retention time period of 1 to 3 min. | ||
Therefore, these results show that the ability of IAMS to identify BFRs is excellent.
Validation of the IAMS method
The above results indicate that the IAMS method is applicable to the qualitative analysis of samples to check whether their decaBDE levels satisfy the restrictions prescribed by regulations such as the RoHS directive.
Conclusions
It was found that IAMS is well suited for rapid qualitative analysis of PBDEs, and can be used for the quality control of materials and parts. Comparison with FT-IR spectroscopy, a conventional analysis method for PBDEs in polymers, showed that decaBDE concentrations of around 1000 ppm which in the maximum level permitted by the RoHS directive, could not be detected by FT-IR spectroscopy because of its low sensitivity. In fact, decaBDE concentrations of even around 100,000 ppm in industrial parts could not be identified by FT-IR spectroscopy due to interference by the matrix.In contrast, IAMS was able to detect a decaBDE concentration of approximately 300 ppm in polymer (analysis conditions: sample weight of 1 mg, extraction temperature of 100 °C to 300 °C with a temperature increase rate of 256 °C min−1). IAMS could also identify other BFRs, such as EBTBPI and BPBPE, and decaBDE could identify in mixtures of BFRs.
These results indicate that IAMS can detect decaBDE in polymer with less interference from the matrix and with higher sensitivity than FT-IR spectroscopy. The validation results confirmed that IAMS could be used to detect lower concentrations of PBDEs than the maximum concentrations permitted by the RoHS directive, and has a possibility of application to quantitative analysis in the future in accordance with its improvement.
Notes and references
- ‘European Parliament and Council of the European Union Directive 2002/95/EC of 27 January 2003 on the restriction of the use of certain hazardous substances in electrical and electronic equipment’, Off. J., 2003, L37, vol. 46, pp. 19–23 Search PubMed.
- California Integrated Waste Management Board, Electronic Waste Recycling Act of 2003: Covered Electronic Waste Payment System (SB 20/SB 50), http://www.ciwmb.ca.gov/Electronics/Act2003/; last accessed 22 Jul 2009.
- AeA's Translation of FINAL China RoHS, Management Methods for Controlling Pollution by Electronic Information Products (Ministry of Information Industry Order #39), http://www.aeanet.org/governmentaffairs/gabl_ChinaRoHS_FINAL_March2006.asp; last accessed 22 Jul 2009.
- Bromine Science and Environmental Forum in Japan, http://www.bsef-japan.com, 2007; last accessed 22 Jul 2009.
- International Standard IEC 62321 Ed.1.0, Electrotechnical products – Determination of levels of six regulated substances (lead, mercury, cadmium, hexavalent chromium, polybrominated biphenyls, polybrominated diphenyl ethers), International Electrotechnical Commission, Geneva, Switzerland, 2008 Search PubMed.
- M. Schlummer, F. Brandl, A. Maurer and R. V. Eldik, J. Chromatogr., A, 2005, 1064, 39 CrossRef CAS.
- A. Binelli, C. Roscioli and L. Guzzella, J. Chromatogr., A, 2006, 1136, 243 CrossRef CAS.
- A. Johnson and N. Olson, Arch. Environ. Contam. Toxicol., 2001, 41, 339 CrossRef CAS.
- Q. Xiao, B. Hu, J. Duan, M. He and W. Zu, J. Am. Soc. Mass Spectrom., 2007, 18, 1740 CrossRef CAS.
- A. Ohnishi, T. Tsujii and M. Morimoto, Periknelmer Application Note AN1340J = IR, http://https%3A//perkinelmer.smartseminar.jp/public/menu/document/download/%3Fid%20%3D%20119, last accessed 22 Jul 2009.
- S. Kikuchi, K. Kawauchi, S. Ooki, M. Kurosawa, H. Honjo and T. Ygishita, Anal. Sci., 2004, 20, 1111 CAS.
- T. Fujii, Mass Spectrom. Rev., 2000, 19, 111 CrossRef CAS.
- J. R. Beauchamp, Annu. Rev. Phys. Chem., 1971, 22, 527 CrossRef CAS.
- T. Fujii and M. Kareev, J. Appl. Phys., 2001, 89, 2543 CrossRef CAS.
- T. Fujii and S. Arulmozhiraja, Anal. Chem., 2001, 73, 2937 CrossRef CAS.
- ‘Commission decision 2005/717/EC of 13 October 2005 amending for the purposes of adapting to the technical progress the Annex to Directive 2002/95/EC of the European Parliament and of the Council on the restriction of the use og certain hazardous substances in electrical and electronic equipment’, Off. J., 2005, L271, Vol. 48, pp. 48 Search PubMed.
- Description of IA-Lab, Compilation prepared by Canon Anelva Technix Corporation, http://www.canon-anelvatx.co.jp/english/products/ia-lab/index.html; last accessed 6 Sep 2009.
| This journal is © The Royal Society of Chemistry 2010 |