Sol-Gel-Au nano-particle modified carbon paste electrode for potentiometric determination of sub ppb level of Al(III)
Mohammad Hossein
Mashhadizadeh
* and
Hadi
Khani
Faculty of Chemistry, Tarbiat Moallem University, Tehran, Iran. E-mail: mashhadizadeh@tmu.ac.ir; Fax: +98 21 88820993; Tel: +98 21 88848949
First published on 16th November 2009
Abstract
This work describes a new carbon paste electrode modified by Sol-Gel-Au nano-particle (SGAN) in the presence of 2,2′-dihydroxy-1-naphthylidine-1′-naphthyl methyl amine (DNMA) as ionophore for determination of Al(III) by potentiometric method. Gold nano-particles (GNPs) were self-assembled onto silica Sol-Gel network and incorporated within carbon paste. The nano-structured matrix with DNMA shows well-defined potentiometric behavior for the determination of Al3+ in aqueous solutions. The sensor exhibits significantly enhanced selectivity toward Al3+ ions over a wide concentration range of 5.0 × 10⁻¹⁰ to 5.0 × 10⁻² M with a lower detection limit of 2.0 × 10⁻¹⁰ M (0.054 ppb) and a Nernstian slope of 20.0 ± (0.1) mV decade−1 of Al3+ activity. It has a fast response time of 5 s and can be used for at least 70 days without any considerable divergence in potentials. The potentiometric response of the electrode is independent of pH of test solution in the pH range 3–7. The interaction between DNMA and Al3+ was studied spectrophotometrically and it exhibits that stoichiometry of complex is 1![[thin space (1/6-em)]](https://www.rsc.org/images/entities/char_2009.gif) :1 in methanol solution. Finally, this electrode was successfully used as an indicator electrode for potentiometric determination of Al3+ in some real samples.
:1 in methanol solution. Finally, this electrode was successfully used as an indicator electrode for potentiometric determination of Al3+ in some real samples.
1. Introduction
The development of new determination methods is a key area for analytical chemists. For this reason extensive research has been focused on developing sensitivity, relative simplicity, accurate, speed and cost effective methods for determination of metals which have industrial importance and affect human health. One of the metals that need precise control in the environment is aluminium. This is the third most abundant element in the Earth's crust (8.1% by weight), and is a non-essential element to which humans are frequently exposed.1 Aluminium is widespread throughout nature, air, water, plants and consequently in all the food because of its wide use. However, relatively recent studies in the last 40 years have revealed that when aluminium reached a certain concentration in the human body it caused and catalysed many diseases such as osteomalacy and osteodistrophy,2,3 anemia,4 encephalopathy,5 dementia,6 gastrointestinal diseases,7 cardiotoxicity8 and most frequently Alzheimer's disease.9 As a result, the determination of very low levels of aluminium has become increasingly important in environmental and clinical chemistry due to its negative roles in the human life. The determination of trace levels of Al has been reported by various methods, such as spectrophotometry,10–12spectrofluorimetry,13,14graphite furnace atomic absorption spectrometry (GF-AAS),15 absorption spectroscopy with a laser diode,16inductively coupled plasma atomic emission spectrometry (ICP-AES)17,18 and ICP mass spectrometry (ICP-MS). Most of these methods are either time consuming, involving multiple sample manipulations, or too expensive for most analytical laboratories. A potentiometric method using an ion sensor as an indicator electrode is an alternative method for determination of aluminium. The development and application of ion-selective electrodes for sensing of metal cations continues to be an interesting area of analytical research as they provide accurate, rapid, non-destructive and low cost methods of analysis.19,20Carbon paste electrodes are commonly used in electroanalysis due to their broad potential window, low background current, rich surface chemistry, low cost, chemical inertness and suitability for various sensing and detection applications. Chemical modification of electrode surfaces is a strategy for improving the analytical performance of conventional electrode materials for specific applications in various fields, especially electroanalysis and sensors. Gold nano-particles have demonstrated to be very appropriate for the development of modified electrodes. Owing to their small dimensional size, good conductivity and excellent catalytic activity, gold nano-particles have potential applications in the construction of electrochemical sensors and biosensors where they function as “electron antennae” efficiently channeling electrons between the electrode and the electroactive species promoting better electron transfer between the electrode surface and the electrolyte.21–23 Sol-Gel technology has been the subject of many studies, because it provides a unique low-temperature methodology to prepare a three-dimensional network suited for the encapsulation of many different molecules.24–26
In our previous reports sulfur-containing compounds were used for self-assembled gold nano-particle modified carbon paste electrodes and applied for potentiometric determination of Cu(II) and Cd(II) cations.27,28
In this paper, we used 3-(mercaptopropyl)trimethoxysilane (MPTS) for designing a three-dimensional interfacial structure of silica gel on gold nano-particles via the direct coupling of Sol-Gel and self-assembled technology. The Sol-Gel of thiolated silicon alkoxides develops a three-dimensional structure that is full of –SH and GNPs can be assembled both inside the network and on the surface of the MPTS Sol-Gel.29–31 This technology will exhibit the benefits of self-assembly, nano-particles, and the increased surface area of three-dimensional electrodes.
In this work, a novel sensor for potentiometric determination of Al(III) was constructed by GNPs that were self-assembled onto silica Sol-Gel network and followed by incorporating DNMA (Fig. 1) as an ionophore to this nano-structure matrix. This electrode was applied as indicator electrode for potentiometric determination of ultra trace amounts of Al(III) ion in some real samples.
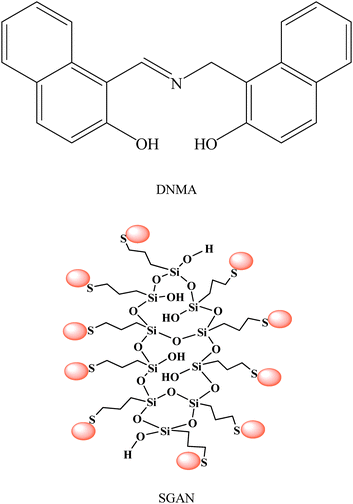 | ||
| Fig. 1 Structures of DNMA and SGAN used as modifier in the proposed electrode. | ||
2. Experimental
2.1. Reagents and materials
All analytical reagent grade chemicals and distilled water were used for preparing all aqueous solutions. Hexamethylenetetramine, 2-naphthol, acetic acid, hydrogen tetrachloroaurate (HAuCl4·3H2O), trisodium citrate and aluminium nitrate were obtained from Merck. Graphite powder, 3-(mercaptopropyl)trimethoxysilane (MPTS), and paraffin oil were purchased from Fluka. Salts of metal nitrates (all from Merck) were of the highest purity available and used without any further purification except for vacuum drying over P2O5.2.2. Instrumentation
All potentiometric measurements were made with a pH/mV meter (Metrohm-827) using proposed sensor in conjunction with a double junction Ag/AgCl (Azar electrode, Iran) reference electrode. UV–vis absorption spectra were recorded with a Philips-PU8750 spectrophotometer. Elemental analysis was performed by a CHN-O- Rapid Heraeus elemental analyzer. IR spectra was found on a Perkin-Elmer model 843, the 1H NMR and 13C NMR spectra were obtained using BRUKER AVANCE DPX 300 MHz apparatus.2.3. Preparations
:3 HNO3–HCl and rinsed thoroughly with distilled water. The two solutions were heated up to 60 °C. The final mixture of red color was boiled for 15 min. The preparation was stored in dark glass bottles at 4 °C. The resulting solutions of gold colloidal particles were characterized by a UV–vis spectrophotometer in the wavelength range from 360 to 800 nm. The UV–vis spectrum shows a peak at 540 nm which is indicative of the formation of GNPs in the colloidal solution.27
:3:3 molar ratio of MPTS, methanol and water in the form of 0.1 M HCl. The mixture was stirring vigorously for 30 min until a clear and homogeneous solution resulted and was subsequently stored at room temperature for 2–3 h. The resulting solutions of Sol-Gel silica network were characterized by FT-IR.
FT-IR spectra of the silica film have shown the presence of a very strong and broad overlapping band at ∼3425 cm−1 for H-bonded silanol with water and molecular water, strong bands in the 1000–1150 cm−1 region characterizing the Si–O–Si asymmetric stretching vibration and a weak band around 940 cm−1 corresponding to Si–OH stretching vibration. These observations confirm the existence of an extensive silica network in the film.30
:GNP (10:1 molar ratio)) under stirring for 5 min. The mixture solution immediately turned grey, indicating the dispersion and self assembling of GNP in MPTS Sol-Gel. The absorption spectrum of MPTS Sol-Gel:GNP (SGAN) solution showed the band at 600 nm (Fig. 2).
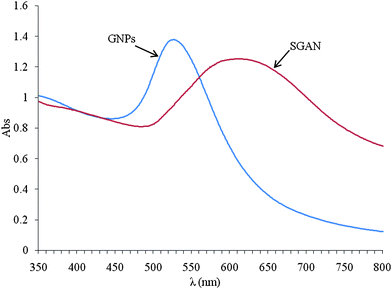 | ||
| Fig. 2 Absorption spectra of (a) gold nano-particle (GNP) and (b) Sol-Gel-Au nano-particle (SGAN). | ||
| No | Composition | Electrode characteristics | |||||||
|---|---|---|---|---|---|---|---|---|---|
| SGAN/μL | GP/mg | PO/mg | DNMA/mg | Slope (mV/decade) | LR/M | LOD/M | R2 | RT/s | |
| a Values in parentheses are SDs based on four replicate analyses. b SGAN: Sol-Gel-Au nano-particle; GP: Graphite powder; PO: Paraffin oil; DNMA: 2,2′-dihydroxy-1-naphthylidine-1′-naphthyl methyl amine; LR: Linear range; LOD: Lower detection limit; RT: Response time. | |||||||||
| 1 | — | 64 | 30 | — | — | — | — | — | — |
| 2 | 100 | 64 | 30 | — | 10.0(±1.2) | 1.0 × 10⁻⁴–5.0 × 10⁻² | 8.0 × 10⁻⁵ | 0.95 | ≤ 10 |
| 3 | 100 | 65 | 32 | 3 | 14.0(±1.0) | 6.0 × 10⁻⁷–2.0 × 10⁻² | 4.0 × 10⁻⁷ | 0.96 | ≤7 |
| 4 | 100 | 65 | 31 | 4 | 16.0(±0.7) | 1.0 × 10⁻⁷–3.0 × 10⁻² | 8.0 × 10⁻⁸ | 0.98 | ≤ 5 |
| 5 | 100 | 64 | 32 | 5 | 18.0(±0.2) | 4.0 × 10⁻⁸–5.0 × 10⁻² | 1.0 × 10⁻⁸ | 0.99 | ≤ 5 |
| 6 | 100 | 64 | 30 | 6 | 20.0(±0.1) | 5.0 × 10 −10–5.0 × 10⁻² | 2.0 × 10⁻¹⁰ | 0.99 | ≤ 5 |
| 7 | — | 64 | 30 | 6 | 17.0(±0.8) | 8.0 × 10⁻⁷–6.0 × 10⁻² | 5.0 × 10⁻⁷ | 0.94 | ≤ 15 |
| 8 | 100 | 62 | 31 | 7 | 23.0(±0.5) | 9.0 × 10⁻⁸–2.0 × 10⁻² | 5.0 × 10⁻⁸ | 0.98 | ≤ 8 |
| 9 | 100 | 60 | 32 | 8 | 24.0(±1.0) | 9.0 × 10⁻⁸–1.0 × 10⁻² | 6.0 × 10⁻⁸ | 0.97 | ≤ 10 |
| 10 | 100 | 59 | 31 | 9 | 18.0(±0.5) | 1.0 × 10⁻⁷–1.0 × 10⁻² | 8.0 × 10⁻⁷ | 0.97 | ≤ 10 |
| 11 | 100 | 58 | 32 | 10 | 17.0(±0.7) | 5.0 × 10⁻⁷–1.0 × 10⁻² | 3.0 × 10⁻⁷ | 0.96 | ≤ 10 |
2.4. Procedure
All emf measurements were carried out with the following cellassembly:Ag/AgCl | sample solution | CPE
The carbon paste electrode was connected to the pH/mV meter as an indicator electrode and the Ag/AgCl reference electrode was connected to the reference terminal of the meter.
For all measurements the two electrodes were immersed in a 50 ml beaker containing de-ionized water, and the solution was stirred using a magnetic stirrer. The pH of test solutions were adjusted by about 5 by introducing small drops of nitric acid (0.1 mol L−1) or sodium hydroxide (0.1 mol L−1). The CPE was allowed to equilibrate until a steady state response was achieved (about 10 s). An accurately measured volume of standard Al(III) solution was added by microsyringe to the stirred solution and the potential was recorded after 5 s. Consecutive amounts of Al(III) were added so that a final Al(III) concentration in the range from 1.0 × 10⁻¹⁰ to 1 × 10⁻² M was obtained. The potential of the electrode against the Ag/AgCl reference electrode was recorded after each Al(III) addition, and then plotted as a logarithmic function of Al(III) activity. The activities of metal ions were calculated according to the Debye–Hückel procedure. All the metal nitrate solutions were freshly prepared by accurate dilution from their stock standard solution of 0.1 M, with distilled, deionized water.
2.5. Complex study
In order to determine the stoichiometry of the resulting DNMA complex with Al(III) ion in a methanol solution the spectra of a series of solutions containing a constant concentration of ligand (1.0 × 10⁻⁴ M) and varying amounts of the metal ion were obtained and the results are shown in Fig. 3a. It is seen that on the addition of metal to DNMA, the absorbance band of DNMA at wavelength 354 nm increases and at 308 and 420 nm decreases. Thus changes indicate complexation. The obtained mole ratio plots (absorbance versus [Al(III)]/[DNMA]) at wavelength 354 and 420 nm for DNMA are shown in Fig. 3b. The absorption mole ratio plots revealed a level off at [Al(III)]/[DNMA] molar ratio of 1, indicating the formation of complex in solution.![a) Electronic absorption spectra of DNMA (1.0 × 10⁻⁴ M) in MeOH in the presence of increasing amounts of Al(iii) (b) Absorbance versus [Al(iii)]/[DNMA] molar ratio plots.](/image/article/2010/AY/b9ay00103d/b9ay00103d-f3.gif) | ||
| Fig. 3 a) Electronic absorption spectra of DNMA (1.0 × 10⁻⁴ M) in MeOH in the presence of increasing amounts of Al(III) (b) Absorbance versus [Al(III)]/[DNMA] molar ratio plots. | ||
2.7. Procedure for determination of Al3+ in tea leaves and Al–Mg samples
For the preparation of Al–Mg sample, 1 mL of Al–Mg syrup (prepared by Alborz Darou Co., Tehran, Iran) was heated in a furnace to dryness. The remainder was dissolved in nitric acid and the clear solution was quantitatively transferred into a 50 mL volumetric flask and diluted to mark with water.34 For determination of Al3+ in tea leaves, 20 mL of a boiling water was poured over 2.00 g of tea leaves (Black tea, prepared by Golestan Co., Iran), left for 10 min, decanted, filtered and after equilibration to room temperature Al3+ in the tea infusions analysed.35Another sample was prepared by spiking suitable amounts of aluminium nitrate into drinkingwater. After these pretreatment, working solutions were prepared by taking a suitable aliquot of the sample, the pH adjusted to about 5, and its aluminium content was determined with the proposed electrode and by ICP method. For adjustment of the ionic strength a 10−2 mol L−1 NaNO3 was added both to the sample solutions.3. Results and discussion
Metal nano-particles have been extensively used for the development of highly sensitive nano-devices because of their unusual physical and chemical properties. Among them the Au nano-particles are of great interest for analytical and bio-analytical applications.23,36,37Electrochemical studies have revealed that GNPs can enhance electrode conductivity, facilitating the electron transfer and improving the detection limit for bio-molecules.38,39
Modification of electrode surfaces with self-assembly of thiols in silica network provides a simple way to design tailored materials that can be further used as functionalized sites to immobilize GNPs.
GNPs immobilized onto three dimensional Sol-Gel network allow the construction of electrode nano-arrays in one or several dimensions, with conductivity, electrocatalytic activity and signal-to-noise several orders of magnitude higher than those achieved at conventional electrodes.40,41 Based on these investigations, we have used SGAN and DNMA compound to modify the carbon paste electrode and used it as an ion selective electrode for potentiometric determination of Al(III) ions activity.
3.1. Response characteristics of the CPEs and electrode composition
It is well known that the sensitivity, linearity and other analytical characteristics of the CPEelectrodes depend significantly on the paste composition.42 Thus, the influence of the type and amount of modifier, paraffin oil and specially ratio of GNP to Sol-Gel on the potential response of the electrode to Al(III) ion activity were investigated and the results are summarized in Table 1. As seen, in the absence of DNMA modifier the electrode shows a nonlinear potentiometric response towards Al(III) ion (no 1 and 2). Clearly, an increase at the DNMA level in the CPE and in the presence of constant amount of SGAN caused a slope increase of the calibration curve. Further addition of the ionophore (no 10 and 11), however, resulted in a little decrease in the response of the electrode, most probably due to some inhomogeneities and possible saturation of the paste.43In addition, the electrodes without SGAN gave a limited working concentration range and a relatively high detection limit (no 7). It is probably due to the power of gold to self-assembly with –SH groups of silica Sol-Gel network used as matrix modifier that leads to the expanding of the surface of paste by fabrication of three-dimensional nanostructures; as well as diminishing the Ohmic resistance of the paste.28
In the other hand existence of siloxane (Si–O–Si) and silane (Si–OH) groups that, in a specific manner, are capable of interacting with aluminium species causes the enhanced selectivity of Al(III) ions over a wide variety of other cations. Also SGAN may interact with DNMA by hydrogen bonding and solvation and this adjusts the mobility of ionophore.
As it is seen from Table 1, the DNMA-SGAN-modified electrode with the graphite powder/paraffin oil/DNMA percentage ratio of 64/30/6 with 100 μL SGAN was selected as the one with the optimal membrane ingredient composition (no 6). It exhibited a Nernstian slope of 20.0 ± (0.1) mV decade−1 in a wide aluminium ion concentration range between 5.0 × 10⁻¹⁰ and 5.0 × 10⁻² M (Fig. 4). The LOD for the electrode was equal to 2.0 × 10⁻¹⁰ M (0.054 ppb). This LOD was calculated when the linear regions of the calibration graphs were extrapolated to the baseline potentials. This detection limit value for the electrode no 6 was at least two to three orders below than that of the conventional Al(III) polymeric membraneelectrodes.
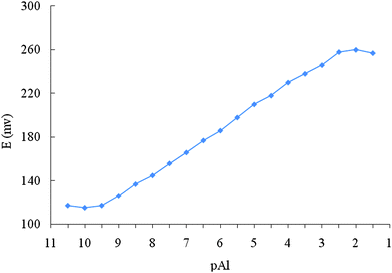 | ||
| Fig. 4 Calibration curve of the Aluminium electrode, based on Sol-Gel-Au nano-particles. | ||
These results show that the DNMA modifier used is an excellent ionophore for Al(III) ion, also, addition of SGAN to the paste improves the linear range, detection limit and response time of the electrode.
3.2. Effect of ionic strength
As indicated by the Nernst equation and the Nicolsky-Eisenman equation, the EMF of an ion-selective electrodecellassembly is directly dependent on the ion activity, and only indirectly dependent on the ion concentration. If the ionic strength of all solutions is held constant at the same value, the activity coefficient of the test substance remains constant for all concentrations of the substance. Since the ionic strength of an unknown solution is usually not known, a high concentration of an electrolyte is added both to the standards and to the samples to maintain about the same ionic strength.In this work, for adjustment of the ionic strength a 10−2 mol L−1 NaNO3 was added both to the sample and the conditioning solutions containing Al3+ ions. When the results were compared with those obtained in the absence of NaNO3 we found the modified electrode immersed in solution containing NaNO3, showed a better standard deviation and measuring range than those of the electrode. On the other hand, the preconditioned electrode in solution containing 1.0 × 10⁻² mol L−1 NaNO3, being conditioned in the presence of 1.0 × 10⁻² mol L−1Al(III), shows a low response toAl(III) ions in the test solution. This is possibly related to the non-specific sites that saturates the surface of carbon paste Sol-Gel with sodium ions.
3.3. Effect of pH
The effect of pH on the determination of Al(III) ions from water samples was studied for 1.0 × 10⁻³ and 1.0 × 10⁻⁴ M Al(NO3)3 solutions in the pH range of 1.0–9.0. The pH of the solution was adjusted at the required value by the addition of 1.0 M sodium hydroxide or 1.0 M hydrochloric acid. As can be seen in Fig. 5 the potential was constant and quantitative in the pH range of 3–7. At higher pH (>7), the potential sharply decreased, due to the formation of some hydroxy complexes of Al(III) ions in solution. On the other hand, at pH < 3, the electrode response increased rather irregularly with increased analyte acidity. At such high acidic solutions, the observed increase in potential indicates that the protonated ionophore possesses a poor response to the Al(III) ions and strong response to H3O+ ions in solution.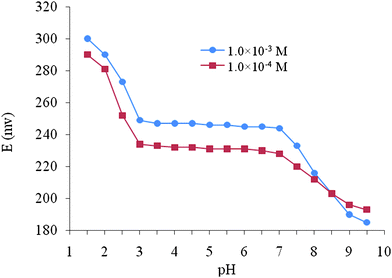 | ||
| Fig. 5 Effect of pH of test solutions on the response of the proposed Al(III) carbon paste electrode. | ||
3.4. Response time and reversibility
The response time is a significant factor for any ion selective electrode in analytical application. The optimum equilibration time and concentration of the conditioning solution for the electrode based on DNMA was ∼2 h in 1.0 × 10⁻² M Al(III) solution. After these conditions, the electrode generated stable potentials in contact with the aluminium solution. The critical emf response of the electrode was assessed according to IUPAC recommendations.44 The average time required for the mentioned electrode to reach a potential within ±1 mV of the final equilibrium value after successive immersion of Al(III) ion solutions, each having a 10-fold difference in concentration, was investigated. The measurements of potential versus time were carried out with the Al(III) nitrate solutions from lower (1.0 × 10⁻⁹ M) to higher (1.0 × 10⁻² M) concentrations (Fig. 6).This potential time plot for these concentrations clearly indicates that the potentiometric response time of the electrode was 5 s. It should be noted that the equilibrium potentials essentially remained constant for more than 30 min, after which only a very slow divergence within the months without any measurable change in response time, slope, or detection limit. To evaluate the reversibility of the electrode, the emf measurements were performed in the sequence high-to-low sample concentrations. The results showed that the response of the electrode was reversible; although the time needed to reach equilibrium values (9 s) was longer than that for low-to-high sample concentrations (5 s), because residual aluminium will still be adsorbed on the surface of the CPE, which will lead to less response time.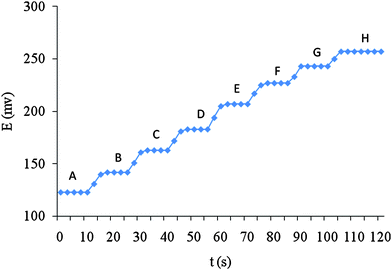 | ||
| Fig. 6 Dynamic response of the carbon paste electrode for changes in concentration of Al(III); A) 1.0 × 10⁻⁹ M; B) 1.0 × 10⁻⁸ M; C) 1.0 × 10⁻⁷ M; D) 1.0 × 10⁻⁶ M; E) 1.0 × 10⁻⁵ M; F) 1.0 × 10⁻⁴ M; G) 1.0 × 10⁻³ M; H) 1.0 × 10⁻² M. | ||
3.5. Repeatability and reproducibility
The repeatability of the proposed electrode was carried out by performing periodic calibration (week to week) with standard solutions and calculating the response and slope over the range 1.0 × 10⁻¹⁰ to 1.0 × 10⁻² M Al(III) solution. The standard deviation of 10 replicate measurements with one paste within 7 weeks was 1.6%. The electrode was stored within a refrigerator in distilled water or dry when not in use. If the electrode was stored dry, it was squeezed and conditioned in a 1.0 × 10⁻² M aluminium nitrate solution for 2 h.To evaluate the reproducibility of this electrode, a series of pastes (five) with optimum composition (no 6) was prepared and the responses of these electrodes were tested to Al(III) ion concentration. The results showed the average of slopes, detection limits and linear dynamic ranges were 20.0 ± (0.1) mV decade−1, 2.0 ± (0.2) × 10−9 M, and 5.0 ± (0.4) × 10−9 to 5.0 ± (0.3) × 10−2 M respectively. The standard deviation of measurements of 1.0 × 10⁻⁶ M of Al(III) solution was ±0.5 mV with these five electrodes.
3.6. Selectivity
The potentiometric selectivity coefficients KPotAl,M of an electrode as one the most important characteristics is defined by its relative response for the primary ion over other ions present in the solution.45 In this work, the potentiometric selectivity coefficients were determined graphically by the fixed interference method that is on the Nicolsky-Eisenman equation.44,45 According to this method, the potentiometric selectivity coefficients, KPotAl,J, can be evaluated from the plots of E vs. log aAl and using the expression ln KPotA,B = ln(aA/a3/ZBB), the selectivity coefficients were determined. The value of aA that is estimated by determining the Al3+ activity for which the linear and rising portion of the graph deviates by 2.303 RT log Z/F mV from the curved part and the value of a3/ZBB (aB and ZB are the activity and charge of interference ion, respectively) were used to calculate the potentiometric selectivity coefficients. In this work, the concentration of the aluminium ion is varied over a wide range (1.0 × 10⁻⁹–1.0 × 10⁻² mol L−1) while that of the interfering ions is keep at 1 × 10⁻² mol L−1. The pH of test solutions is fixed at about 5. The resulting selectivity coefficient values thus obtained for the proposed Al(III) sensor are given in Table 2. As it is evident, most of the interfering ions show low values of selectivity coefficients, indicating no interference in the performance of the carbon paste electrodeassembly.| Interfering ions | K Pot Al,M | Interfering ions | K Pot Al,M |
|---|---|---|---|
| K+ | 1.0 × 10⁻⁵ | La3+ | 8.6 × 10⁻⁴ |
| Na+ | 5.0 × 10⁻⁵ | Ag+ | 1.0 × 10⁻⁴ |
| Pb2+ | 1.0 × 10⁻⁵ | Tl+ | 5.0 × 10⁻⁵ |
| Ca2+ | 4.0 × 10⁻⁴ | Cu2+ | 7.5 × 10⁻⁴ |
| Mg2+ | 1.5 × 10⁻⁴ | Cd2+ | 1.0 × 10⁻⁴ |
| Zn2+ | 1.0 × 10⁻⁴ | Mn2+ | 2.5 × 10⁻⁴ |
| Ga3+ | 8.0 × 10⁻⁴ | Co2+ | 1.0 × 10⁻⁴ |
| Cr3+ | 8.0 × 10⁻⁴ | Ni2+ | 4.4 × 10⁻⁴ |
| Fe3+ | 1.0 × 10⁻³ | Fe2+ | 1.3 × 10⁻⁴ |
There are many redox systems of importance in chemistry and biochemistry. Such redox systems can influence the electrode potential especially when an inert electrode is used as indicator electrode in potentiometric or voltammetric methods. On the other hand, in this work the indicator electrode is an ion selective electrode and many redox systems have no effect on the electrode potential. However, the potential of the proposed electrode is proportional to the ion Al(III) activity and any parameters affecting this ion activity alters the electrode potential.
The adsorption of electroinactive species on an electrode surface occurs frequently. Such adsorption can inhibit (or poison) an electrode reaction or it can accelerate the electrode reaction. Indeed, in many studies with solid electrodes, one observes a slow change in the electrochemical response with time, which can be ascribed to the buildup of adsorbed impurities on the electrode surface at a rate limited by their diffusion from the bulk solution. A great advantage of carbon paste electrodes is the possibility of easily renewing the surface, and thus allowing repetitive measurements at surfaces essentially free of adsorbed species.
3.7. Comparison of the characteristics of the proposed and previously reported Al(III)electrodes
The selectivity coefficients, working activity range, Nernstian slope, pH range, response time and detection limit of the proposed electrode are compared with the corresponding values previously reported for Al3+-selective electrodes based on different modifiers.34,43,46–51 After comparison it is obvious that its detection limit is lower than found for the other electrodes and its working range is wider than the others. In the other hand selectivity behavior of the proposed electrode is among the most selective for Al3+ ion sensors reported. Thus, overall evaluation indicates this electrode is more useful in such applications.3.8. Real sample analysis and analytical performance
For accessing the capability of the method for real samples with different matrices containing varying amounts of diverse ions, the method was applied to determination of Al(III) in some real samples. For this purpose, the Al(III) content of Al–Mg syrup and tea leaves samples were determined by this method and compared with the inductively coupled plasma (ICP) method. The results obtained by the DNMA-SGAN-modified electrode in combination with those obtained by ICP are depicted in Table 3. As it is derived from this Table, the determined Al3+ concentration in these samples, using simple aqueous standard solutions for calibration, was in good agreement with the certified ICP method. These results demonstrated the applicability of the developed sensor with the employment of the DNMA and silica Sol-Gel-Au nano-particle for interference-free determination of Al(III) traces in the environmental samples.This electrode was also successfully applied to direct determination of aluminium in river (Karoun, Iran), tap (laboratory) and mineral (Damavand MineralWaterCo. Iran) water samples and the results are given in Table 4. As can be seen, the accuracy of aluminium determination in different water samples is almost quantitative.
| Al added/M | River water (Karoun) | Tap water | Mineral water | |||
|---|---|---|---|---|---|---|
| Found | Recovery (%) | Found | Recovery (%) | Found | Recovery (%) | |
| a Values in parentheses are SDs based on four replicate analyses. | ||||||
| 5.0 × 10⁻⁴ | 4.9 (±0.3) × 10−4 | 98.2 | 4.9 (±0.3) × 10−4 | 99 | 4.9 (±0.1) × 10−4 | 98 |
| 5.0 × 10⁻⁶ | 4.9 (±0.3) × 10−6 | 97.4 | 5.0 (±0.2) × 10−6 | 100 | 4.9 (±0.2) × 10−6 | 98 |
| 5.0 × 10⁻⁸ | 5.1 (±0.3) × 10−8 | 101 | 5.1 (±0.3) × 10−8 | 102.2 | 5.0 (±0.1) × 10−8 | 100 |
4. Conclusions
The nano-structured electrode based on DNMA and SGAN is highly sensitive and selective towards Al(III) and it can detect sub-ppb level of Al(III) without any interference from coexisting other metal ions and surface active compounds. This electrode is highly stable and can be used for repeated measurements. The ultra sensitivity of the electrode towards Al(III) is ascribed to (i) enhanced conductivity of the electrode, (ii) good interaction of DNMA and SGAN toward Al(III), and (iii) the large surface area of the nano-particles on the electrode surface. Because the electrode shows excellent sensitivity, selectivity and stability, it may find application in the analysis of real samples.References
- J. Tria, E. C. V. Butler, P. R. Haddad and A. R. Bowie, Anal. Chim. Acta, 2007, 588, 153–165 CrossRef CAS.
- M. R. Wills, Clin. Chem., 1985, 31, 5–13 CAS.
- P. E. Gardiner, J. M. Ottaway, G. S. Fell and D. J. Halls, Anal. Chim. Acta, 1981, 128, 57–66 CrossRef CAS.
- I. S. Parkinson and M. K. Ward, J. Clin. Pathol., 1981, 34, 1285–1294 CAS.
- J. A. Robertson, A. J. Felsenfeld, C. C. Haygood, P. Wilson, C. Clarke and F. Lach, Kidney Int., 1983, 23, 327–335 CrossRef CAS.
- J. McClure and P. S. Smith, J. Pathol., 1984, 142, 293–299 CAS.
- S. P. Andreoli, J. M. Bergstein and D. J. Sherrard, N. Engl. J. Med., 1984, 310, 1079–1083.
- S. Sideman and D. Manor, Nephron, 1982, 31, 1–10 CrossRef CAS.
- J. Savory, C. Exley, W. F. Forbes, Y. Huang, Y. G. Joshi, T. Kruck, D. R. C. McLachlan and I. Wakayama, J. Toxicol. Environ. Health, 1996, 48, 615–636 CrossRef CAS.
- M. A. Zanjanchi, H. Noei and M. Moghimi, Talanta, 2006, 70, 933–939 CrossRef CAS.
- M. J. Ahmed and J. Hossan, Talanta, 1995, 42, 1135–1142 CrossRef CAS.
- B. Fairman and A. Sanz-Medel, Anal. Chim. Acta, 1994, 286, 401–409 CrossRef.
- X. Zhu, L. Bao, R. Guo and J. Wu, Anal. Chim. Acta, 2004, 523, 43–48 CrossRef CAS.
- E. Yamada, T. Hiwada, T. Inaba, M. Tokukura and Y. Fuse, Anal. Sci., 2002, 18, 785–792 CAS.
- I. Narin, M. Tuzen and M. Soylak, Talanta, 2004, 63, 411–418 CrossRef CAS.
- M. Soylak, U. Sahin, A. Ülgen, L. Elc and M. Dogan, Anal. Sci., 1997, 13, 287–289 CAS.
- S. Recknagel, U. Rosixk and P. Bratter, J. Anal. At. Spectrom., 1994, 9, 1293–1297 RSC.
- T. Bantan, R. Milacic and B. Pihlar, Talanta, 1998, 46, 227–235 CrossRef CAS.
- V. K. Gupta and L. P. Singh, in Ion-Selective Electrodes for Sensing of Metal Cations for the ‘Encyclopedia of Sensors’Volume 5, ed. C. A. Grimes and B. Dickey, American Scientific Publishers, 2006, pp.133–150 Search PubMed.
- V. K. Gupta, Chimia, 2005, 59, 209–217 CrossRef CAS.
- K. R. Brown, A. P. Fox and M. J. Natan, J. Am. Chem. Soc., 1996, 118, 1154–1157 CrossRef CAS.
- A. R. Raj, T. Okajima and T. Ohsaka, J. Electroanal. Chem., 2003, 543, 127–133 CrossRef CAS.
- M. C. Daniel and D. Astruc, Chem. Rev., 2004, 104, 293–346 CrossRef CAS.
- C. J. Brinker and G. W. Scherer, Sol–Gel Science, Academic Press, New York, 1990 Search PubMed.
- L. L. Hench and J. K. West, Chem. Rev., 1990, 90, 33–72 CrossRef CAS.
- B. Wang, B. Li, Z. Wang, G. Xu, Q. Wang and S. Dong, Anal. Chem., 1999, 71, 1935–1939 CrossRef CAS.
- M. H. Mashhadizadeh, Kh. Eskandari, A. Foroumadi and A. Shafiee, Electroanalysis, 2008, 20, 1891–1896 CrossRef CAS.
- M. H. Mashhadizadeh, Kh. Eskandari, A. Foroumadi and A. Shafiee, Talanta, 2008, 76, 497–502 CrossRef CAS.
- J. Wang, P. V. A. Pamidi and D. R. Zanette, J. Am. Chem. Soc., 1998, 120, 5852–5853 CrossRef CAS.
- S. Bharathi, M. Nogami and S. Ikeda, Langmuir, 2001, 17, 1–4 CrossRef.
- J. Jia, B. Wang, A. Wu, G. Cheng, Z. Li and S. Dong, Anal. Chem., 2002, 74, 2217–2223 CrossRef CAS.
- B. K. Jena and C. R. Raj, Talanta, 2008, 76, 161–165 CrossRef CAS.
- B. K. Jena and C. R. Raj, Chem.–Eur. J., 2006, 12, 2702–2708 CrossRef CAS.
- A. Yari, L. Darvishi and M. Shamsipur, Anal. Chim. Acta, 2006, 555, 329–335 CrossRef CAS.
- J. Ščančar, V. Stibilj and R. Milačič, Food Chem., 2004, 85, 151–157 CrossRef CAS.
- A. N. Shipway, E. Katz and I. Willner, ChemPhysChem, 2000, 1, 18–52 CrossRef CAS.
- M. Zayats, R. Baron, I. Popov and I. Willner, Nano Lett., 2005, 5, 21–25 CrossRef CAS.
- W. Song, M. Okamura, T. Kondo and K. Uosaki, J. Electroanal. Chem., 2003, 554–555, 385–393 CrossRef CAS.
- S. I. Stoeva, J.-S. Lee, C. S. Thaxton and C. A. Mirkin, Angew. Chem., Int. Ed., 2006, 45, 3303–3306 CrossRef CAS.
- B. K. Jena and C. R. Raj, Talanta, 2008, 76, 161–165 CrossRef CAS.
- P. Kalimuthu and S. A. John, J. Electroanal. Chem., 2008, 617, 164–170 CrossRef CAS.
- M. H. Mashhadizadeh, E. Pour Taheri and I. Sheikhshoaie, Talanta, 2007, 72, 1088–1092 CrossRef CAS.
- M. Arvand and S. A. Asadollahzadeh, Talanta, 2008, 75, 1046–1054 CrossRef CAS.
- IUPAC, Analytical chemistry division, commission on analytical electrodes, Pure Appl. Chem., 1979, 48, 127–131.
- E. Bakker, P. Buhlmann and E. Pretsch, Chem. Rev., 1997, 97, 3083–3132 CrossRef CAS.
- V. K. Gupta, R. N. Goyal, A. K. Jain and R. A. Sharma, Electrochim. Acta, 2009, 54, 3218–3224 CrossRef CAS.
- V. K. Gupta, A. K. Jain and G. Maheshwari, Talanta, 2007, 72, 1469–1473 CrossRef CAS.
- M. B. Saleh, S. M. Hassan, A. A. Abdel Gaber and N. A. Kream, Anal. Chim. Acta, 2001, 434, 247–253 CrossRef CAS.
- M. B. Gholivand, F. Ahmadi and E. Rafiee, Electroanalysis, 2006, 18, 1620–1626 CrossRef CAS.
- A. Abbaspour, A. R. Esmaeilbeing, A. A. Jarrahpour, B. Khajeh and R. Kia, Talanta, 2002, 58, 397–403 CrossRef CAS.
- M. Shamsipur, S. Ershad, A. Yari, H. Sharghi and A. Salimi, Anal. Sci., 2004, 20, 301–306 CAS.
| This journal is © The Royal Society of Chemistry 2010 |