Cyclic voltammetry on recessed nanodisk-array electrodes prepared from track-etched polycarbonate membranes with 10-nm diameter pores†
D. M. Neluni T.
Perera
and
Takashi
Ito
*
Department of Chemistry, Kansas State University, 213 CBC Building, Manhattan, Kansas 66506-0401, USA. E-mail: ito@ksu.edu; Fax: +1 785-532-6666; Tel: +1 785-532-1451
First published on 4th November 2009
Abstract
This paper described cyclic voltammograms (CVs) on a recessed nanodisk-array electrode (RNE) prepared from a track-etched polycarbonate membrane (TEPCM) with 10-nm diameter pores. A RNE was prepared via sputtering of a gold thin film onto a TEPCM whose pores were coated with polyvinylpyrrolidone. CVs of such a RNE changed from peak-shaped to sigmoidal with decreasing scan rate due to the transition of diffusion modes of redox-active molecules, as with previous reports. However, faradic currents in these CVs were larger than theoretical currents calculated from the membrane thickness, pore density, and pore diameter. The larger faradic currents may reflect the presence of a surface layer on TEPCM nanopores to which the redox species preferentially distribute as compared with the nanopore cavity. The limiting current of uncharged 1,1′-ferrocenedimethanol was not affected by solution pH or supporting electrolyte concentration. In contrast, those of anionic ferricyanide and cationic ferrocenylmethyltrimethylammonium decreased and increased, respectively, with increasing pH from 4 to 9. These pH-dependent changes in limiting current were larger at lower supporting electrolyte concentration. The dependence of the CVs on solution pH and supporting electrolyte concentrations was attributed to electrostatic interaction between the redox species and the charged TEPCM nanopores.
Introduction
Due to the nearly cylindrical shapes and narrow size distribution of their pores, track-etched polycarbonate membranes (TEPCMs) have been employed as filtration membranes,1 as model systems for studying hindered mass transport,2 and as templates for synthesizing nanowires and nanoelectrode ensembles.3,4 TEPCMs incorporated into microfluidic devices could be used as diffusion-controlled separators between two channels,5 as potential-controlled gates6–10 and for the electrokinetic preconcentration of molecules.6,11,12 In addition, electroless deposition of gold on TEPCM nanopores and their subsequent chemical functionalisation with thiolate self-assembled monolayers provided a means for controlling the selectivity in molecular separation and detection based on size-exclusion and chemical interactions.13,14 All these applications involve the mass transport of solvated molecules that reflects the surface properties (e.g., charge, hydrophobicity) of TEPCM nanopores.Previously, the surface charge of unmodified TEPCM nanopores was assessed by measurements of streaming potential,15–17 electroviscous effects,17 and flux of fluorescent molecules.18,19 Results obtained using these measurements suggested the presence of surface charge on the solution-filled TEPCM nanopores that possibly originates from functional groups developed during membrane processing or adsorption of ions from aqueous solution.16,18,19 Whereas these methods have provided information reflecting the net properties of nanopores, they have not been employed to discuss the heterogeneous nature of the nanopores (e.g., surface vs. cavity). The surface of TEPCM nanopores is often coated with a thin polyvinylpyrrolidone (PVP) layer that may play an essential role in the molecular mass transport behavior.18,19
In contrast to the above methods, electrochemical methods have been used to discuss the heterogeneous natures of nanoporous media deposited on electrode surfaces.20 A faradic current reflects the diffusion coefficients and concentrations of redox species in the media, the kinetics of the electrode reaction, the time-scale of measurements (e.g., scan rate in voltammetry), solution convection and electrode geometry.21 Thus, detailed analysis of faradic currents measured under controlled conditions made it possible to discuss the distinct electron/mass transport modes within nanoporous media. For example, the properties of two bicontinuous phases within anodic aluminium oxide (AAO) nanopores modified with an organic polymer or bilayer assemblies were investigated using voltammetry and chronocoulometry on AAO-based recessed nanodisk-array electrodes (RNEs).22–25 The mass/electron transport properties and concentration of redox species within a thin organic layer on the nanopore were different from those within the nanopore cavity, resulting in observations of enhanced redox reaction.23–25
In this study, the surface properties of 10-nm diameter TEPCM nanopores coated with PVP were investigated using cyclic voltammetry on TEPCM-based RNEs. Due to their higher surface-to-volume ratio, TEPCMs with 10-nm diameter pores were expected to offer a faradic current more significantly reflecting the nanopore surface properties as compared to those containing 50-nm diameter pores.26 TEPCM-based RNEs were characterized using several different approaches, including measurements of charging and faradic currents, profilometry to measure the membrane thickness, and scanning electron microscopy (SEM) to determine the pore density and diameter. As compared to AAO membranes3,14,22–25,27 and nanoporous membranes derived from block copolymers28–34 that contain an array of densely-packed cylindrical nanopores, the pore density in the TEPCM was much lower. The low pore density provided a means for characterizing the RNEs from the transition of cyclic voltammogram (CV) shapes measured at different scan rates.26,35–39 At slower scan rates, sigmoidal CVs reflecting the steady-state, radial diffusion of redox molecules from a solution into the nanopores were observed on these RNEs, which facilitated our discussion on the electrochemical data. The charge within the TEPCM nanopores was assessed from the limiting currents in sigmoidal CVs of charged and uncharged redox species measured at different pH and supporting electrolyte concentrations.
Experimental section
Chemicals and materials
All solutions were prepared with water having a resistivity of 18 MΩ cm or higher (Barnstead Nanopore Systems). Potassium nitrate (Fisher Chemical), potassium dihydrogen phosphate (Fisher Chemical), potassium hydrogen phosphate (Fisher Chemical), potassium hydroxide (Fisher Chemical), potassium ferricyanide (K3Fe(CN)6; Arcos Organics), ferrocenylmethyltrimethylammonium iodide (TMAFc+I−; Strem Chemicals), and 1,1′-ferrocenedimethanol (FcDM; Aldrich) were of reagent grade quality and used without further purification. Ferrocenylmethyltrimethylammonium nitrate (TMAFc+NO3−) was prepared by passing a TMAFc+I− solution through NO3−–form anion exchange resin (Amberlite IRA-900, Aldrich), and characterized using ion chromatography (column: Hamilton PRP-X100). TEPCMs with pore diameters of 10 nm (25 mm membrane diameter) were obtained from Osmonics. The thickness of a TEPCM was measured using a profilometer (Ambios Technology XP-2 Stylus Profiler). SEM images of a TEPCM were measured using a Zeiss Leo 32 SEM at the Microscopy & Analytical Imaging Laboratory, the University of Kansas, upon deposition of a 5-nm thick Pd/Au alloy film on the sample.Fabrication of TEPCM-Based RNEs
TEPCM-based RNEs were prepared according to the procedures described previously.26 In short, the rougher face of a TEPCM was coated with a gold layer (≥ 200nm thick) via sputtering (EFFA Coater, Ernest F. Fullam), and then the gold side was mounted on a glass slide (ca. 1 × 1 cm2) coated with a thin film of PDMS (Sylgard 184, Dow Corning). Electrical contact to the Au surface was made using conducting copper tape (Electron Microscopy Sciences) to use the RNE as a working electrode (Fig. 1).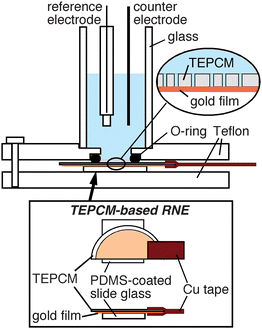 | ||
| Fig. 1 Schematic illustration of the experimental apparatus used for measuring CVs on a TEPCM-based RNE. | ||
Electrochemical measurements
Electrochemical data was obtained using a CH Instruments Model 618B electrochemical analyzer. Electrochemical experiments were carried out in a three-electrode cell containing a Ag/AgCl (3 M KCl) reference electrode and a Pt counter electrode (Fig. 1).26 The area of the RNE in contact with solution was 0.34 cm2. In addition, a 25-μm diameter gold microelectrode was used to measure the diffusion coefficients of Fe(CN)63−, TMAFc+ and FcDM in 0.1 M KNO3. CV measurements were taken at scan rates ranging from 5 mV s−1 to 1000 mV s−1 at room temperature.Results and discussion
Electrochemical characterization of TEPCM-based RNEs with 10-nm diameter pores
First, TEPCM-based RNEs were characterized by measuring (a) capacitive currents and (b) CVs of uncharged FcDM at different scan rates. The former provides a means for determining the total active area of a RNE that makes it possible to directly assess the seal between the gold layer and TEPCM.40 The latter offers the scan rate that gives the transition between sigmoidal and peak-shaped CVs, permitting us to discuss the diffusion behavior of FcDM within the TEPCM nanopores.26,35,41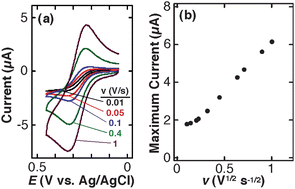 | ||
| Fig. 2 (a) Cyclic voltammograms for a TEPCM-based RNE (10 nm in pore diameter) in a solution of 3.0 mM FcDM containing 0.01 M KNO3 and 0.01 M KH2PO4–K2HPO4 buffer (pH 6.3) at five different scan rates (0.01, 0.05, 0.1, 0.4 and 1 V s−1). (b) Relationship between the maximum oxidation current of 3.0 mM FcDM and the square root of scan rate. Measured in 0.01 M KNO3 and 0.01 M KH2PO4–K2HPO4 buffer (pH 6.3) on the TEPCM-based RNE that gave CVs shown in Fig 2a. | ||
Fig. 2b summarizes the relationship between the maximum oxidation current (i.e., a limiting current (ilim) in a sigmoidal CV; a peak current (ip) in a peak-shaped CV) and scan rate, i.e., v1/2. The maximum current was similar at lower v, and then linearly increased for v greater than 0.05 V s−1. Similar results were obtained on four separate TEPCM-based RNEs with 10-nm diameter pores. These observations are qualitatively consistent with the following theoretical equations regarding ilim in a sigmoidal CV and ip in a peak-shaped CV on a RNE:35,43
 | (1) |
 | (2) |
However, in contrast to previously reported results obtained on TEPCM-based RNEs containing 50-nm diameter pores,26 the currents observed on the RNEs with 10-nm diameter pores were larger than those calculated using the theoretical equations. For example, the average and standard deviation of ilim measured on four separate RNEs was 2.3 ± 0.7 μA, and was larger than 1.4 μA that was obtained from eqn (1) by assuming Dp = Ds = 6.1 × 10⁻⁶ cm2 s−1 for FcDM. In addition, ip was much larger than the theoretical one calculated using eqn (2) at Cp = Cs = 3.0 mM and Dp = Ds: For example, ip obtained at 0.4 V s−1 from the four RNEs was 4.5 ± 0.4 μA, whereas the theoretical value was 0.8 μA. The large currents suggest the involvement of enhanced electron/mass transport (i.e., larger apparent Dp) within the nanopores such as electron hopping through a nanopore surface layer that contains the redox species at higher concentration.20 The surface layer may originate from a PVP layer immobilized on the nanopore surface, considering its hydrophobic nature as compared with aqueous solution within the nanopore cavity. An enhanced faradic current was previously reported on AAO-based RNEs whose pore surface was covered with such an organic polymer layer.22–25
On the other hand, the scan rate that gave the transition (vt) was ca. 0.05 V s−1 (Fig. 2b), which was much slower than the scan rate (0.8 V s−1) estimated using eqn (3) under the assumption of L = 6.4 μm and Dp ∼ Ds.26,27
 | (3) |
Smaller Dp than Ds due to strong interactions with nanopores and/or larger L due to the tilted track angle may explain the slower vt, but are not consistent with the larger ilim and ip (vide supra). Currently, we do not have a comprehensive model that can explain both the larger faradic current and smaller vt.
CV measurements of uncharged and charged redox species on TEPCM-based RNEs at different pH and supporting electrolyte concentrations
Subsequently, CVs of three different redox species were measured at different pH (pH 4–9) and supporting electrolyte concentrations ([KNO3] = 0.1 and 0.01 M in addition to 0.01 M KH2PO4–K2HPO4). Here, we discuss a series of sigmoidal CVs measured at 0.01 V s−1 on an identical TEPCM-based RNE: Limiting currents in such CVs may be affected by the gaps suggested by the capacitive current measurements (vide supra) less significantly than peak currents in peak-shaped CVs, because they reflect the diffusion of redox species from the outside of the nanopores. Eqn (1) suggests that difference in ilim can be attributed to changes in Dp. Dp reflects the partition of the redox species into the nanopores in addition to the mass/electron transport properties of the nanopores.20,44 Thus, comparison of the sigmoidal CVs of charged and uncharged redox species at different pH will permit us to discuss interactions between the redox species and the 10-nm diameter nanopores.Fig. 3 shows CVs of 1.0 mM Fe(CN)63− measured on a RNE at 0.01 V s−1 in solutions of three different pH conditions containing (a) 0.1 M and (b) 0.01 M KNO3. In 0.1 M KNO3, ilim at pH 4.4 was slightly larger than those at pH 6.1 and 8.0 (Fig. 3a). In 0.01 M KNO3, the decrease in ilim at higher pH was larger (Fig. 3b) as compared with that in 0.1 M KNO3. The shapes of the CVs were very similar, suggesting that the decrease in ilim originated from changes in nanopore properties rather than changes in electrode surface properties. These observations suggest that electrostatic interactions between Fe(CN)63− and the nanopores play an essential role in the changes of ilim.31,32,45
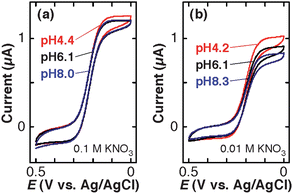 | ||
| Fig. 3 Cyclic voltammograms (scan rate: 0.01 V s−1) of 1.0 mM K3Fe(CN)6 solutions containing (a) 0.1 M KNO3 + 0.01 M KH2PO4–K2HPO4 and (b) 0.01 M KNO3 + 0.01 M KH2PO4–K2HPO4 at three different pH on a TEPCM-based RNE (10 nm in pore diameter). These data were obtained using a RNE different from that gave the data shown in Fig. 2. | ||
In contrast to the decrease in ilim of Fe(CN)63−, TMAFc+ exhibited an increase in ilim with increasing pH, as shown in Fig. 4. The change in ilim in 0.01 M KNO3 (Fig. 4b) was larger than that in 0.1 M KNO3 (Fig. 4a). The reversibility of the CVs was very similar regardless of the pH and supporting electrolyte concentrations. These results support the involvement of electrostatic interactions in the pH dependence of ilim of the cationic TMAFc+.
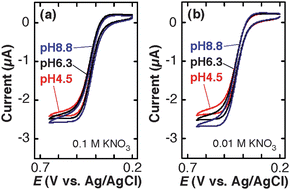 | ||
| Fig. 4 Cyclic voltammograms (scan rate: 0.01 V s−1) of 3.0 mM TMAFc+ solutions containing (a) 0.1 M KNO3 + 0.01 M KH2PO4–K2HPO4 and (b) 0.01 M KNO3 + 0.01 M KH2PO4–K2HPO4 at three different pH on a TEPCM-based RNE (10 nm in pore diameter). The data shown in Figure 4 were obtained using a RNE that gave the data shown in Fig. 2. | ||
CVs of uncharged FcDM were similar regardless of pH and supporting electrolyte concentrations examined (Fig. 5). These observations indicated that the diffusion of uncharged FcDM was not affected by electrostatic interactions in contrast to that of charged Fe(CN)63− and TMAFc+ (Fig. 3 and 4).
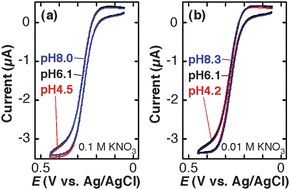 | ||
| Fig. 5 Cyclic voltammograms (scan rate: 0.01 V s−1) of 3.0 mM FcDM solutions containing (a) 0.1 M KNO3 + 0.01 M KH2PO4–K2HPO4 and (b) 0.01 M KNO3 + 0.01 M KH2PO4–K2HPO4 at three different pH on a TEPCM-based RNE (10 nm in pore diameter). The data shown in Fig. 5 were obtained using a RNE that gave the data shown in Fig. 3. | ||
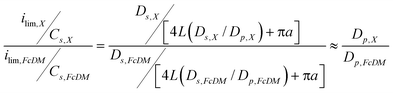
Fig. 6 summarizes the pH dependence of the ratio of ilim/Cs between charged redox species X (where X is Fe(CN)63− or TMAFc+) and FcDM measured on an identical RNE. The ratio of ilim/Cs can be directly correlated to the ratio of apparent diffusion coefficients of the two species (Dp,X/Dp,FcDM) as shown by the following equation derived from eqn (1) under the assumption that a, L and N are unchanged during the measurements and L(Ds/Dp) ≫ πa:
 | (4) |
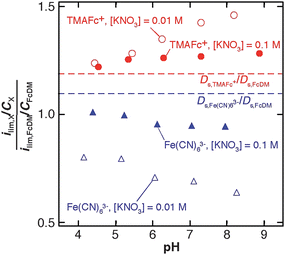 | ||
| Fig. 6 pH dependence of the ratio of ilim/C between charged redox species (X = Fe(CN)63− (triangles) or TMAFc+ (circles)) and FcDM. The ilim values were measured at 0.01 V s−1 on TEPCM-based RNEs (10 nm in pore diameter) in solutions containing 0.1 M (filled symbols) or 0.01 M (open symbols) KNO3 in addition to 0.01 M KH2PO4–K2HPO4. The ratios of the diffusion coefficients in 0.1 M KNO3 + 0.01 M KH2PO4–K2HPO4 (pH 6.3), which were measured using a gold microelectrode (25 μm in diameter), were shown in dashed lines. | ||
Fig. 6 clarifies the pH-dependent changes in ilim of the charged redox species in addition to the influence of KNO3 concentration on ilim, as described above. In addition, for the pH range examined, the ratios for Fe(CN)63− were smaller than its Ds,X/Ds,FcDM, whereas those of TMAFc+ were larger than its Ds,X/Ds,FcDM. These results suggest that the 10-nm diameter nanopores were negatively charged over the pH range examined, and the charge increased at the higher pH. The increase in the negative charge at higher pH enhanced electrostatic attraction and repulsion with TMAFc+ and Fe(CN)63−, resulting in the increase and decrease in the ilim/Cs ratio, respectively. The larger and smaller redox currents of Fe(CN)63− and TMAFc+ at the lower KNO3 concentration can be explained by the weaker screening of the negative charge of the nanopore surface that enhanced the electrostatic interactions.16–18 The pH range that gave the change in ilim/Cs ratios was pH 4–6 for both charged redox molecules, which is similar to the pH range that gave an increase in the negative streaming potential.16 The pH range suggests that the negative surface charge may originate from functional groups such as –COOH groups (pKa ∼ 4.5) that were developed during membrane processing.16 The PVP layer on the nanopore surface would not directly involve in the negative surface charge because of the high pKa value of its amide group.46 Importantly, the deviation of Dp,X/Dp,FcDM from Ds,X/Ds,FcDM for Fe(CN)63− was negligible on TEPCM-based RNEs with 50-nm diameter pores as suggested by the excellent correlation between experimental and theoretical currents.26 probably due to the smaller contributions of the surface properties to the mass/electron transport through the 50-nm diameter nanopores.
Conclusions
This paper reported the CVs of uncharged and charged redox species on TEPCM-based RNEs with 10-nm diameter pores. The effects of pH and supporting electrolyte concentrations on the CVs suggested the presence of negative charge within the nanopores. The faradic currents measured in this study were larger than those estimated using theoretical equations, suggesting the enhanced mass and/or electron transport through the nanopores. These results may reflect the presence of a distinct surface layer on the 10-nm diameter nanopores to which the redox species partition preferentially. The CV data reported here offered information on the charge properties within the 10-nm diameter nanopores, which may make it possible to tune the properties of TEPCMs as templates for nanomaterials synthesis and separation membranes.Acknowledgements
The authors thank Dr Daniel Higgins (Department of Chemistry, Kansas State University) for his suggestions, Dr Christopher Culbertson (Department of Chemistry, Kansas State University) for access to the surface profiler and Dr Bruce Cutler (Microscopy & Analytical Imaging Laboratory, University of Kansas) for his assistance with SEM measurements. The authors gratefully acknowledge the ACS-PRF and Kansas State University for financial support of this work.References
- J. Han, J. Fu and R. B. Schoch, Lab Chip, 2008, 8, 23–33 RSC.
- W. M. Deen, AIChE J., 1987, 33, 1409–1425 CrossRef.
- C. R. Martin, Science, 1994, 266, 1961–1966 CrossRef CAS.
- J. C. Hulteen and C. R. Martin, J. Mater. Chem., 1997, 7, 1075–1087 RSC.
- R. F. Ismagilov, J. M. K. Ng, P. J. A. Kenis and G. M. Whitesides, Anal. Chem., 2001, 73, 5207–5213 CrossRef CAS.
- T.-C. Kuo, D. M. Cannon Jr., M. A. Shannon, P. W. Bohn and J. V. Sweedler, Sens. Actuators, A, 2003, 102, 223–233 CrossRef.
- T.-C. Kuo, D. M. Cannon Jr., Y. Chen, J. J. Tulock, M. A. Shannon, J. V. Sweedler and P. W. Bohn, Anal. Chem., 2003, 75, 1861–1867 CrossRef CAS.
- D. M. CannonJr., T.-C. Kuo, P. W. Bohn and J. V. Sweedler, Anal. Chem., 2003, 75, 2224–2230 CrossRef CAS.
- K. Fa, J. J. Tulock, J. V. Sweedler and P. W. Bohn, J. Am. Chem. Soc., 2005, 127, 13928–13933 CrossRef CAS.
- E. N. Gatimu, J. V. Sweedler and P. W. Bohn, Analyst, 2006, 131, 705–709 RSC.
- J. Dai, T. Ito, L. Sun and R. M. Crooks, J. Am. Chem. Soc., 2003, 125, 13026–13027 CrossRef CAS.
- Y. Zhang and A. T. Timperman, Analyst, 2003, 128, 537–542 RSC.
- C. R. Martin, M. Nishizawa, K. Jirage, M. Kang and S. B. Lee, Adv. Mater., 2001, 13, 1351–1362 CrossRef CAS.
- L. A. Baker, P. Jin and C. R. Martin, Crit. Rev. Solid State Mat. Sci., 2005, 30, 183–205 Search PubMed.
- K. J. Kim, A. G. Fane, M. Nystrom and A. Pihlajamaki, J. Membr. Sci., 1997, 134, 199–208 CrossRef CAS.
- C. Lettmann, D. Mockel and E. Staude, J. Membr. Sci., 1999, 159, 243–251 CrossRef CAS.
- I. H. Huisman, P. Pradanos, J. I. Calvo and A. Hernandez, J. Membr. Sci., 2000, 178, 79–92 CrossRef CAS.
- P. J. Kemery, J. K. Steehler and P. W. Bohn, Langmuir, 1998, 14, 2884–2889 CrossRef CAS.
- T.-C. Kuo, L. A. Sloan, J. V. Sweedler and P. W. Bohn, Langmuir, 2001, 17, 6298–6303 CrossRef CAS.
- R. W. Murray, Ed., Molecular Design of Electrode Surfaces, John Wiley & Sons, New York, 1992 Search PubMed.
- A. J. Bard and L. R. Faulkner, Electrochemical Methods, Fundamentals and Applications, 2nd Ed., Wiley, New York, 2001 Search PubMed.
- C. J. Miller and M. Majda, J. Am. Chem. Soc., 1985, 107, 1419–1420 CrossRef CAS.
- C. J. Miller and M. Majda, J. Electroanal. Chem., 1986, 207, 49–72 CrossRef CAS.
- C. J. Miller and M. Majda, J. Am. Chem. Soc., 1986, 108, 3118–3120 CrossRef CAS.
- C. J. Miller, C. A. Widrig, D. H. Charych and M. Majda, J. Phys. Chem., 1988, 92, 1928–1936 CrossRef CAS.
- T. Ito, A. A. Audi and G. P. Dible, Anal. Chem., 2006, 78, 7048–7053 CrossRef CAS.
- C. J. Brumlik, C. R. Martin and K. Tokuda, Anal. Chem., 1992, 64, 1201–1203 CrossRef CAS.
- M. A. Hillmyer, Adv. Polym. Sci., 2005, 190, 137–181 CAS.
- D. A. Olson, L. Chen and M. A. Hillmyer, Chem. Mater., 2008, 20, 869–890 CrossRef CAS.
- E. Jeoung, T. H. Galow, J. Schotter, M. Bal, A. Ursache, M. T. Tuominen, C. M. Stafford, T. P. Russell and V. M. Rotello, Langmuir, 2001, 17, 6396–6398 CrossRef CAS.
- Y. Li, H. C. Maire and T. Ito, Langmuir, 2007, 23, 12771–12776 CrossRef CAS.
- Y. Li and T. Ito, Langmuir, 2008, 24, 8959–8963 CrossRef CAS.
- Y. Li and T. Ito, Anal. Chem., 2009, 81, 851–855 CrossRef CAS.
- H. C. Maire, S. Ibrahim, Y. Li and T. Ito, Polymer, 2009, 50, 2273–2280 CrossRef CAS.
- K. Tokuda, K. Morita and Y. Shimizu, Anal. Chem., 1989, 61, 1763–1768 CrossRef CAS.
- C. S. Henry and I. Fritsch, Anal. Chem., 1999, 71, 550–556 CrossRef CAS.
- B. Kralj and R. A. W. Dryfe, Phys. Chem. Chem. Phys., 2001, 3, 3156–3164 RSC.
- A. I. Bhatt and R. A. W. Dryfe, J. Electroanal. Chem., 2005, 584, 131–140 CrossRef CAS.
- C. G. Zoski, N. Yang, P. He, L. Berdondini and M. Koudelka-Hep, Anal. Chem., 2007, 79, 1474–1484 CrossRef CAS.
- R. M. Penner and C. R. Martin, Anal. Chem., 1987, 59, 2625–2630 CrossRef CAS.
- C. Amatore, J.-M. Saveant and D. Tessier, J. Electroanal. Chem., 1983, 147, 39–51 CrossRef CAS.
- C. Beriet, R. Ferrigno and H. H. Girault, J. Electroanal. Chem., 2000, 486, 56–64 CrossRef CAS.
- A. M. Bond, D. Luscombe, K. B. Oldham and C. G. Zoski, J. Electroanal. Chem., 1988, 249, 1–14 CrossRef CAS.
- J.-M. Saveant, J. Electroanal. Chem., 1991, 302, 91–101 CrossRef CAS.
- G. Wang, B. Zhang, J. R. Wayment, J. M. Harris and H. S. White, J. Am. Chem. Soc., 2006, 128, 7679–7686 CrossRef CAS.
- G. Lessene, M. Bordeau, C. Biran, D. de Montauzon and J. Gerval, J. Electroanal. Chem., 2000, 490, 79–84 CrossRef CAS.
Footnote |
| † Electronic supplementary information (ESI) available: FE-SEM image and distribution of pore diameters. See DOI: 10.1039/b917517b |
| This journal is © The Royal Society of Chemistry 2010 |