Rapid tandem-column micro-gas chromatography based on optofluidic ring resonators with multi-point on-column detection
Yuze
Sun
a,
Jing
Liu
a,
Daniel J.
Howard
a,
Greg
Frye-Mason
b,
Aaron K.
Thompson
c,
Shiou-jyh
Ja
c and
Xudong
Fan
*a
aDepartment of Biological Engineering 240D Bond Life Sciences Center, University of Missouri, 1201 E. Rollins Street, Columbia, Missouri 65211, USA. E-mail: fanxud@missouri.edu
bICx Biodefense, 4343 Pan American Freeway NE, Suite 234, Albuquerque, NM 87107, USA
cICx Nomadics, 1024 South Innovation Way, Stillwater, Oklahoma 74074, USA
First published on 3rd November 2009
Abstract
We demonstrated a novel tandem-column micro-gas chromatography (μGC) based on optofluidic ring resonator (OFRR). The OFRR is a thin-walled fused silica capillary whose interior surface is coated with a polymeric stationary phase. The circular cross section of the OFRR forms the micro-ring resonator and supports whispering gallery modes (WGMs). Via tapered optical fibers in contact with the OFRR, the WGM can be excited externally at any positions along the OFRR capillary, thus enabling multi-point, on-column, real-time detection of vapor molecules flowing through the OFRR. In the present OFRR-based tandem-column-based μGC implementation, a 180 cm long conventional GC column coated with a nonpolar stationary phase was followed by a relatively short OFRR column coated with a polar phase. Two detection positions, one at the inlet of the OFRR and the other a few centimeters downstream, were used to monitor the separation achieved by the first and the second column, respectively. Owing to the multi-point on-column detection that provides complementary retention time information on each chemical compound, co-eluted analytes can be well separated and identified on at least one detection channel and no modulation is needed at the interface of tandem columns. Separation and detection of twelve analytes with various volatilities and polarities within four minutes were demonstrated. In addition, the chromatograms obtained from three different locations along the OFRR column demonstrated the system's capability of on-column monitoring of the separation process for the target analyte in a vapor mixture. Our results will lead to the development of a rapid, simple, and portable μGC system with significantly improved selectivity and chemical identification capabilities.
Introduction
Gas chromatography (GC) is the most frequently used analytical technique for the identification and quantification of various organic vapor compounds. However, one major drawback with the conventional GC is that the required equipment is bulky, power intensive, and requires long analysis time. These factors have significantly hindered its deployment as a portable technology for field applications. Research on micro-GC (μGC) analyzers over the past ten years has shown great potential for portable, rapid, and low power consumption μGC systems.1–10 To date, most μGC system configurations are comprised of a pre-concentrator/injector, rectangular cross-sectional microfabricated GC columns,7,11–15 and an end-column micro-detector, such as flame ionization detectors (FIDs),4 electron capture detectors (ECDs),16 thermal conductivity detectors (TCDs),8,9 surface acoustic wave (SAW) detectors,5,6,10 and chemiresistor (CR) detector arrays,1,3 which detects the analyte coming out of the terminal end of GC columns.We recently developed an alternative novel μGC configuration, optofluidic ring resonator (OFRR),17–20 which is based on a thin-walled microbore capillary column and an integrated on-column micro-optical detector. Specifically, the OFRR is a thin-walled (<4 μm) fused silica capillary (outer diameter ∼80–100 μm) whose interior surface is coated with a polymeric stationary phase. The circular cross section of the OFRR forms the optical ring resonator and supports the optical mode that detects in real-time the interaction between the polymer and vapor analytes flowing through the OFRR, thus the retention time of each vapor analyte in the mixture is obtained. In our previous work, we have demonstrated the feasibility of the OFRR as a rapid on-column μGC analyzer with a sub-nanogram detection limit.17,20 However, as a μGC analyzer the OFRR-based μGC suffers from lack of resolving power due to shorter columns than those used in bench-top GC. This problem is also commonly encountered in nearly all other μGC systems.
In order to maintain fast separation while improving the selectivity, a μGC system consisting of coupled tandem columns coated with a different stationary phase has been proposed.21–23 In this system, a nonpolar or slightly polar phase column is usually used as the first separation column, followed by a short polar phase column. Analytes are basically separated according to their volatility on the first column and then further separated according to their polarity on the second column, resulting in a greatly increased separation power. In a typical tandem-column μGC setup, an adjustable pressure control valve is used at the tandem-column interface to address the co-elution problem occurring at the end of the tandem-column. The valve tunes the carrier gas velocity, hence the analyte retention, in both columns, with each set of retention combination being employed to avoid co-elution of a specific set of analytes in the sample.4–6,24,25 Although enhanced selectivity is achieved, the valve operation is sophisticated and the sample needs to be tested several times under different retention conditions in order to separate all the chemical compounds in it.
In this work, we demonstrated rapid OFRR-based tandem-column μGC with enhanced selectivity that takes advantage of the unique multi-point on-column detection capability. As illustrated in Fig. 1(A), the first column (180 cm) was a conventional low polarity GC column, followed by a second, relatively short (∼10 cm), home-fabricated OFRR column coated with a polar stationary phase. Two detection locations were chosen, one at the inlet of the OFRR, right after the first column, and the other one a few centimeters away from the first detection point, to monitor the separation in the first column and the second column, respectively. Since OFRR on-column detectors record the retention time independently and provide complementary chromatograms for each chemical compound, co-elution at the terminal end of columns is no longer an issue for the OFRR based tandem-column μGC. By monitoring retention times at multiple locations along the OFRR column, analytes can be well separated on at least one detection location. As a result, no complicated and costly modulation at the interface of two columns is required. In this paper, we used twelve representative analytes with various volatilities and polarities to demonstrate the performance of tandem-column separation of the OFRR based μGC system. In the end, we further demonstrated the system's capability of on-column monitoring of the separation process for the target analyte in a vapor mixture.
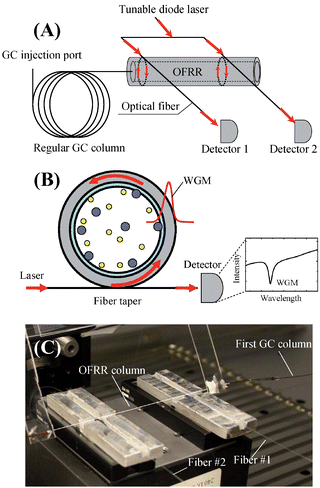 | ||
| Fig. 1 (A) Conceptual illustration of tandem-column separation based on OFRR μGC. A nonpolar phase regular GC column is connected with a relatively short polar phase coated OFRR column through a press-tight universal connector. A tunable diode laser is coupled into two fibers in contact with the OFRR. The first fiber is placed at the inlet of the OFRR and the second one a few centimeters downstream along the OFRR, defining two detection locations, respectively. (B) Cross sectional view of the OFRR. The WGM is excited through the fiber perpendicularly in contact with the OFRR and circulates along the circumference of the OFRR. The WGM spectral position changes in response to the interaction between the polymer coating and vapor molecules. (C) A picture of the OFRR with two tapered fibers separated by approximately 6 cm. A white line is drawn along the OFRR column to guide the eye. | ||
OFRR detection principle
Fig. 1(B) shows the cross sectional view of the OFRR μGC system. The circular cross section of the OFRR forms a ring resonator that supports resonant modes called whispering gallery modes (WGMs) or circulating waveguide modes.26 The WGM travels along the circumference of the OFRR and has an electrical field present in the polymer layer coated on the OFRR interior surface. The WGM resonant wavelength, λ, is determined by λ = 2πrneff/m,27 where r is the OFRR outer radius, m is an integer, and neff is the effective refractive index experienced by the WGM, which is related to the refractive index and the thickness of the polymer. When vapor molecules flow through the OFRR, the interaction between the molecules and polymer cause the polymer refractive index and/or thickness to change, which in turn results in a spectral change in the WGM. Theoretical analysis has shown that the WGM wavelength shift is linearly proportional to the concentration/mass of the analyte vapor.18 Therefore, by monitoring the WGM spectral change, quantitative and kinetic information of the analyte regarding the analyte and polymer interaction can be acquired in real-time. Typically the WGM has high Q-factors (106), corresponding to a very long circulating lifetime of the WGM that significantly enhances the OFRR sensitivity.Experimental section
Materials
All the analytes used in the experiment are listed in Table 1. They were purchased from Sigma (St. Louis, MO) with purity greater than 97%. Rtx-1 and Rtx-5 GC columns were purchased from Restek (Bellefonte, PA). Hydrofluoric acid (HF) and methanol were purchased from Sigma. HF is a particularly dangerous inorganic acid and should be handled with careful consideration for safety. Poly-(ethylene glycol) 1000 (PEG 1000) was purchased from Fluka (St. Louis, MO). All analytes and chemical reagents were used as received.| No | Compound (abbreviation) | Vapor pressure at 25 °C (Torr) | Retention index | Polarity | Retention time (sec) | FWHM peak width at Detector 1 (sec) | Polarity index (%)a | |
|---|---|---|---|---|---|---|---|---|
| Detector 1 | Detector 2 | |||||||
| a Polarity index defined here as the retention time differences from the two detection channels divided by the retention time of the first detection channel. b Data for Analyte #13 was obtained from Fig. 5. | ||||||||
| 1 | Heptane | 45.56 | 700 | Nonpolar | 4.3 | 4.3 | 1.0 | 0 |
| 2 | Octane | 14.04 | 800 | Nonpolar | 8.4 | 8.4 | 1.6 | 0 |
| 3 | Decane | 1.43 | 1000 | Nonpolar | 39.8 | 39.8 | 5.6 | 0 |
| 4 | Undecane | 0.41 | 1100 | Nonpolar | 91.6 | 91.6 | 9.8 | 0 |
| 5 | Dodecane | 0.14 | 1200 | Nonpolar | 230.4 | 230.4 | 26.2 | 0 |
| 6 | 1-octanol | 1.18 | 1050 | Polar | 59.5 | 65.7 | 3.2 | 10.4 |
| 7 | Dimethyl methyl phosphonate (DMMP) | 1.20 | 840 | Polar | 10.6 | 14.5 | 2.0 | 36.8 |
| 8 | Diethyl methyl phosphonate (DEMP) | 0.36 | 1000 | Polar | 34.7 | 44.7 | 4.1 | 28.8 |
| 9 | 2-nitrotoluene (2-NT) | 0.18 | 1116 | Polar | 88.0 | 94.8 | 1.9 | 7.7 |
| 10 | 3-nitrotoluene (3-NT) | 0.21 | 1141 | Polar | 113.7 | 122.9 | 5.4 | 8.1 |
| 11 | 4-nitrotoluene (4-NT) | 0.12 | 1155 | Polar | 131.6 | 143.6 | 6.0 | 9.1 |
| 12 | Dimethyl dinitro butane (DMNB) | 0.00207 | 1122 | Polar | 91.2 | 107.3 | 1.4 | 17.7 |
| 13 | Methyl salicylateb | 0.03 | 1170 | Polar | 229.6 | 236.4 | 16.3 | 3.0 |
Column fabrication and assembly
The first column consisted of a fused-silica capillary with 0.1-mm inner diameter (ID) and 180 cm in length. Its interior surface was coated with 0.1 μm nonpolar poly(dimethylsiloxane) bonded stationary phase (Rtx-1) or 0.1 μm slightly polar 5% diphenyl 95% dimethyl polysiloxane (Rtx-5). The second column was an OFRR capillary with a 90 μm outer diameter (OD), 84 μm inner diameter (OD), and 15 cm length. It was coated with a polar stationary phase, PEG 1000. The OFRR was fabricated with in-house fabrication facilities by rapidly stretching a fused-silica preform (Polymicro Technologies, Phoenix, AZ) under CO2 laser irradiation, followed by HF etching to further reduce the wall thickness to around 3 ∼ 4 μm to expose a sufficient fraction of light intensity to the polymer layer.18 The OFRR fabrication and wall thickness characterization methods were detailed in previous publications.20,28 The subsequent polymer coating procedure was adapted from the static coating method developed for GC microfabricated channels.14 Briefly, the OFRR column was filled with a solution of 3 mg mL−1 PEG 1000 in methanol by capillary action. The column was sealed with a methyl silicone septum at both ends and the coating solution was left inside for one hour. Then, vacuum was applied at one end of the capillary to evaporate the solvent. The thickness of the polymer coating could be controlled by varying the concentration of the coating solution. At the given concentration, the coating thickness was estimated to be approximately 80 nm. Finally, the OFRR capillary was checked under a microscope to ensure a uniform and smooth polymer thin film formed before it was connected to the first column via a universal quick seal column connector (CP 4787, Varian).Experimental setup
A schematic of the experimental setup of the OFRR-based tandem-column μGC system is shown in Fig. 1. The analyte samples were extracted from equilibrium headspace using a solid phase microextraction (SPME) fiber with a 65 μm coating of poly(dimethylsiloxane)/divinylbenzene (PDMS/DVB) (Supelco) at room temperature and then introduced through the GC injection port (GC 5890 II, Agilent), which was heated to 250 °C. The Rtx-1 (or Rtx-5) column and the OFRR capillary were connected in tandem by a universal connector. A tunable diode laser (JDS Uniphase, center wavelength 1550 nm) was scanned over 110 pm spectral range at a scanning rate of 5 Hz. The laser light was guided by a single-mode fiber and then directed into two branches of tapered fiber through a fiber coupler (Thorlabs, Newton, NJ). The tapered part was approximately 3 μm in diameter and was placed in contact with the OFRR column to excite the WGM, thus defining a detection location. The first tapered fiber was placed at the OFRR column inlet to monitor in real-time the analytes separated by the first column. The second tapered fiber was placed at a location 6 cm away from the first one to monitor the retention time of each analyte separated by both columns. The chromatograms were recorded at these two locations unless otherwise specified. The retention time differences from the two channels indicate the separation of the analyte along the 6 cm polar-phase coated OFRR column. A photodetector (New Focus 2033) was used at the distal end of each fiber to monitor the output light intensity. When the laser was scanned through a wavelength on resonance with WGM supported by the OFRR, a spectral dip was observed, as shown in Fig. 1(B), which could be used to indicate the WGM spectral position. The WGM spectral position changes in response to the analyte passing through the detection point. The data were collected by a data acquisition card (National Instruments NI USB 6211) for post-analysis. UHP helium was used as the carrier gas at a flow rate of 0.86 mL min−1. The first column was wrapped in a transfer line maintained at an isothermal temperature of 50 °C (unless otherwise specified), and the OFRR column was operated at room temperature (∼23 °C).Results and discussion
First-column separation and detection
As illustrated in Fig. 1, the first tapered fiber was placed at the beginning of the OFRR capillary column, right after the end of the first traditional Rtx-1 GC column, and was used to monitor the separation achieved by the first column. In order to demonstrate the capability of detecting and monitoring the elution of analyte compounds from the first column in real-time, a vapor mixture of alkanes, including heptane, octane, decane, undecane, and dodecane, was tested. Fig. 2(A) shows the retention time of each analyte detected by the two tandem detectors along the OFRR column 6 cm apart. The chromatograms from the first detector showed that five alkane analyte peaks were well resolved. Notice that no additional increase in retention time was observed on the second detection channel for the alkanes, which is an expected finding as alkanes have relatively weak interactions with polar stationary phases. The fronting peak profile was caused by overloading the first column. Since the polar stationary phase coated on the OFRR has weak interaction with nonpolar analytes (causing smaller changes in polymer refractive index/thickness), the WGM spectral shift in response to those analytes is usually small, as discussed in our previous work.18,19 Consequently, during experiments we injected a significant amount of alkanes into the system in order to obtain a sufficient response from the polar-coated OFRR, which is in sharp contrast to the highly sensitive response from the same OFRR when the polar analytes were used.19,20 Therefore, the OFRR with a polar coating will favorably detect the polar analytes out of nonpolar analytes. As discussed later, this unique feature is highly desirable in many applications when the analytes of interest are often highly polar, but mixed with low polarity background interferents (such as alkanes). The insensitive response of the polar-coated OFRR to those low polarity interferents allows us to minimize the effects of the background and single out the trace quantity of polar analytes. Likewise, if sensitive nonpolar analytes detection is needed, the OFRR coated with the nonpolar phase can be used, which will have good rejection towards polar analytes.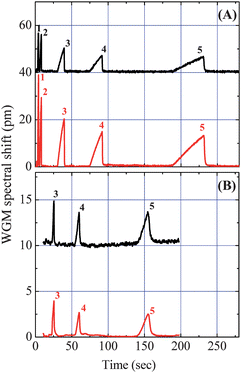 | ||
| Fig. 2 Chromatograms of alkanes. The upper traces were recorded by the first detector, showing retention times of each analyte separated by the first Rtx-1 column kept at 50 °C (A) and 150 °C (B) isothermal, respectively. The lower traces show the corresponding retention times recorded by the second detector 6 cm away from the first detector. Details of the analytes are listed in Table 1. Curves are vertically shifted for clarity. | ||
In order to improve the alkane peak profile and reduce the fronting effect, we increased the first column temperature to 150 °C isothermal while leaving the OFRR temperature unchanged. In this case, alkanes would have a smaller partition into the stationary phase, and therefore become less retained. As expected, the fronting effect is significantly reduced and the chromatogram in Fig. 2(B) exhibits more symmetrical and sharper peaks compared to those at isothermal 50 °C in Fig. 2(A). The dodecane peak width measured at the baseline was improved from 44 s to 21 s. Undecane and decane baseline peak width were only 8 s and 3 s, respectively. Since heptane and octane analyzed under the elevated temperature become too volatile, they presented no adequate separation after travelling through the 180 cm Rtx-1 column, therefore their peaks are not shown in Fig. 2(B).
According to theoretical and experimental studies, the amplitude of the peak (WGM spectral shift) is linearly proportional to the mass of the vapor analyte injected.18,20 However, in Fig. 2(A) the WGM used in the front sensing channel exhibits a lower sensitivity than the WGM used in the back sensing channel, since the peak amplitude measured by the first detector was smaller than the one measured by the second detector. WGM sensitivity difference between two channels is possibly due to the OFRR wall thickness difference after etching, PEG coating thickness variation along the capillary, or different order of radial mode used for the measurement.18,20 Note that these amplitude differences do not reflect mass differences at two detection locations. In fact, the relative peak amplitudes for all analytes remain the same at both detection channels. In actual applications, a reference sample with known quantity will be used to calibrate the system and the sensitivity difference between the two channels will thus be ratioed out.
Tandem-column separation and detection
The major advantage of tandem-column separation is that all components in a sample will go through two individual separations during one single analysis process and will be analyzed based on their respective volatility and polarity, thus significantly improving the identification, especially for discriminating high polarity analytes from low polarity background species. Fig. 3(A) shows that the co-elution of decane and DEMP from the first Rtx-1 column can be very well separated by the PEG 1000 coated 6 cm OFRR column. According to the GC retention index that indicates the relative retention time of alkanes from a nonpolar stationary phase (see Table 1), decane and DEMP have the same GC retention index. As a consequence, they are difficult to separate on a short nonpolar column. However, during the second separation through the OFRR column, the polar analyte DEMP gained an additional 10 s in retention as shown in Fig. 3(A), whereas the retention time for decane remained the same (see Fig. 2(A) and 3(A)). To verify that the separation between decane and DEMP indeed took place in the OFRR, the inset of Fig. 3(A) plots the chromatogram of DEMP alone from the two channels. In addition, the inset also indicates that the kink right after the main peak of DEMP might be due to an impurity in the DEMP sample, instead of an interference from the decane peak. Fig. 3(B) shows the chromatogram of six compounds injected simultaneously. If only separated by the Rtx-1 column, the undecane peak was buried in the stronger peak of 2-NT while DMNB was barely resolved right after the 2-NT peak. Since the three analytes have different polarities, it is clear that after travelling through a 6 cm long OFRR column, all three peaks were well resolved.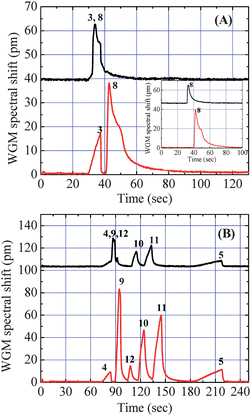 | ||
| Fig. 3 Chromatograms from the two detection channels. The upper traces show the separation from the 180 cm Rtx-1 column (50 °C) and the lower traces show the further separation by a 6 cm PEG 1000 coated OFRR column (∼23 °C). Co-elution of Analyte #3 and #8 in (A) and Analyte #4, #9, and #12 in (B) from the first GC column was well separated by the second OFRR column. The inset of (A) shows the chromatogram for DEMP from the two channels. Curves are vertically shifted for clarity. | ||
Capability of analyzing complex samples
To further demonstrate the tandem-column separation capability of the OFRR μGC, Fig. 4 shows a mixture of twelve compounds that were analyzed by the OFRR μGC system with tandem Rtx-1 column and PEG 1000 coated OFRR capillary column. All twelve compounds were well resolved after tandem-column separation, while two groups of co-elution appeared from the first column separation. Even without optimizing for speed, the analysis time for the twelve compounds was within four minutes, showing great potential for the development of a fast μGC. It is emphasized that while the overloading effect occurred with the nonpolar analytes in Fig. 4, it does not obscure the advantages of our system. In fact, the ability to demonstrate the tandem-column separation even in the presence of broader overloaded peaks further validates the robustness of this new technique. Table 1 lists the retention time from each separation and peak width (full width at half maximum, FWHM) measured by the first detector for the twelve analytes separated by the Rtx-1/OFRR μGC system. A polarity index, defined here as the retention time differences from the two detection channels, which is correlated to the analyte volatility and polarity, divided by the retention time of the first detection channel, which is correlated to the analyte volatility, was also calculated for each analyte.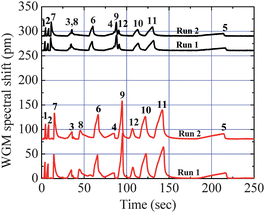 | ||
| Fig. 4 Chromatograms of twelve analytes with various volatilities and polarities obtained by the two detection channels. The whole analysis was completed within four minutes. Two groups of co-elution from the first 180 cm Rtx-1 GC column (50 °C) (upper traces) were well resolved after the second 6 cm OFRR column (∼23 °C) separation (lower traces). The experiments were performed twice (Run 1 and Run 2) to show the separation repeatability. Curves are vertically shifted for clarity. | ||
Co-elution
By providing more than one retention time, this tandem-column μGC system can overcome the co-elution problem, a key limitation in single-column separation and tandem-column separation. The co-elution can occur either immediately after the first column separation, caused by limited separation power usually seen in μGC system with a shorter GC column, as shown in Fig. 3, or from tandem-column ensembles, in which the adequately separated analytes from the first column co-elute after the second column.5,6 For the first case, we have demonstrated that adding another column with different stationary phase will further separate the co-eluted analytes, which improves the separation capability. The latter scenario is demonstrated in Fig. 5 when Rtx-5 and the OFRR were used as the tandem separation columns. In Fig. 5(A), since the Rtx-5 column is slightly polar, octanol eluted right before the undecane peak. The OFRR column provided further retention for octanol, resulting in co-elution of the two analytes at the terminal end of the second separation. The same situation happened with DMNB and methyl salicylate, as shown in Fig. 5(B). Previously, modulation at the junction of tandem columns was needed to avoid co-elution at the end of the second column. For example, a pressure control valve has been employed to program and control the release of analytes at the end of the first column so that separated analytes will not co-elute at the end of the column ensemble.5,6 However, owing to the unique multi-point on-column detection capability of the OFRR μGC system, we are able to avoid the necessity of complicated modulation procedures. Since the two detectors are independent, they provide complementary information regarding the retention time for each analyte at different locations along the OFRR column. Therefore, as demonstrated in Fig. 5, the chromatogram from the first detector can be used to identify the two analytes instead of using the co-eluted chromatogram from the second detector. Additional detection locations can be readily added along the OFRR column, either before or after the current second detection location, to track the separation of analytes along the OFRR column.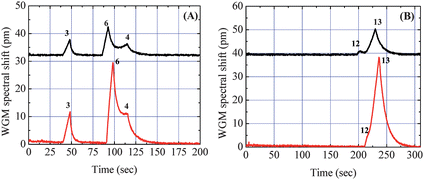 | ||
| Fig. 5 Chromatograms from the two detection channels. The upper traces show the separation from the 180 cm Rtx-5 GC column (50 °C). The lower traces show the retention time from the Rtx-5/OFRR column ensembles. (A) Partial co-elution of Analyte #6 and #4 after the second separation due to added retention of Analyte #6 compared to Analyte #4 in the OFRR. (B) Co-elution of Analyte #12 and #13 after the second separation. Curves are vertically shifted for clarity. | ||
Monitoring the target analyte separation process
One of the powerful and versatile features of the OFRR-based tandem-column μGC is its capability of performing multi-point detection along the OFRR column. As discussed earlier, the detection channel can be moved along the OFRR column or additional detection channels can be added to form a sensor array to monitor the analytes separation process. Such capability is highly desirable in addressing co-elution problems and for enhanced selectivity. In Fig. 6, we demonstrate the monitoring of the separation process of a target analyte (octanol) in a vapor mixture as it travelled along the OFRR. This was accomplished by placing the second channel at two different locations along the OFRR column, illustrated by the insets of Fig. 6. Specifically, the first tapered fiber was kept at the OFRR inlet. The second tapered fiber was 3.5 cm downstream. The chromatogram from these two channels was recorded as Chromatogram #1. Then, the second taper was moved additional 4.5 cm downstream and Chromatogram #2 was taken. In Chromatogram #1 and #2, we could clearly see how octanol was separated by the Rtx-1 column and co-eluted with undecane in the middle part of the OFRR column, and then re-separated by the rest part of the OFRR column.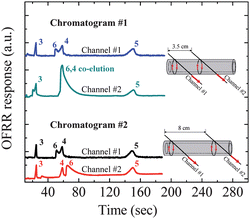 | ||
| Fig. 6 Monitoring the separation process of the target analyte (Analyte #6: octanol) by acquiring three chromatograms at three different locations along the OFRR column. The upper traces in Chromatogram #1 and #2 were recorded from the tapered fiber (Channel #1) located at the OFRR column inlet. The lower traces in Chromatogram #1 and #2 were recorded from another tapered fiber (Channel #2) located 3.5 cm and 8 cm downstream from Channel #1, respectively. A 180 cm Rtx-1 column heated at 150 °C isothermal was used as the first separation column. The OFRR column was kept at room temperature. Curves are vertically shifted for clarity. | ||
Summary and discussion
We have demonstrated rapid tandem-column separation and detection of vapor compounds using an OFRR-based μGC system, in which a nonpolar or slightly polar conventional GC column was used in conjunction with a short polar phase coated OFRR column so that the entire set of analytes can simultaneously be separated according to their respective vapor pressure and polarity in one single analysis.The OFRR-based tandem-column μGC has a few distinctive advantages over the existing tandem-column μGC systems. First, the OFRR serves a dual purpose as both a GC separation column and micro-detector. No additional end-column detectors are needed. Such integration greatly simplifies the μGC design, thus improving μGC reliability and enabling device miniaturization. Second, the OFRR is capable of performing multi-point on-column detection by placing tapered fibers (or waveguides) at any location along the separation column. Therefore, analytes can be well separated on at least one of the detection locations. Moreover, with multiple detection points on the OFRR column the entire separation process can be monitored. All of these help avoid the complicated and costly modulation procedures and allow for rapid profiling and screening of large varieties of analytes. Third, the circular cross section of the OFRR is fully compatible with conventional GC columns and related testing equipment without any added dead volumes. Fourth, as a GC detector, the OFRR has no internal volume and short rise time. The laser and photo-detector in the OFRR μGC system are potentially capable of operating at a high data acquisition rate (>MHz), which are highly desirable attributes for fast μGC systems. Fifth, the OFRR based μGC system can be made inexpensively. The fabrication and detection methods are simple and straightforward, and the system can easily be scaled-up for multiplexed and parallel detection to significantly enhance the separation capability and detection speed.
In a number of field applications such as chemical weapon detection, homeland security, battlefield, and environmental protection, the analytes of interest are often highly polar, but unfortunately buried in large low polarity background interferents. The OFRR μGC system becomes particularly useful when detecting low volatility polar analytes from the volatile low polarity background. The data in Fig. 2 to 6 clearly show that the polar species can be well separated from a nonpolar species on at least one of the two OFRR detection points, even when there is co-elution on the other OFRR detection point and even in the presence of a large, overloading low polarity background.
Acknowledgements
The authors would like to thank the National Science Foundation for financial support (Grant No. ECCS-0729903).References
- C.-J. Lu, W. H. Steinecker, W.-C. Tian, M. C. Oborny, J. M. Nichols, M. Agah, J. A. Potkay, H. K. L. Chan, J. Driscoll, R. D. Sacks, K. D. Wise, S. W. Pang and E. T. Zellers, Lab Chip, 2005, 5, 1123–1131 RSC.
- W. C. Tian, H. K. L. Chan, C.-J. Lu, S. W. Pang and E. T. Zellers, J. Microelectromech. Syst., 2005, 14, 498–507 CrossRef.
- G. Lambertus, A. Elstro, K. Sensenig, J. Potkay, M. Agah, S. Scheuering, K. Wise, F. Dorman and R. Sacks, Anal. Chem., 2004, 76, 2629–2637 CrossRef CAS.
- G. Lambertus and R. Sacks, Anal. Chem., 2005, 77, 2078–2084 CrossRef CAS.
- J. Whiting and R. Sacks, Anal. Chem., 2002, 74, 246–252 CrossRef CAS.
- C.-J. Lu, J. Whiting, R. D. Sacks and E. T. Zellers, Anal. Chem., 2003, 75, 1400–1409 CrossRef CAS.
- S. Reidy, D. George, M. Agah and R. Sacks, Anal. Chem., 2007, 79, 2911–2917 CrossRef CAS.
- S. C. Terry, J. H. Jerman and J. B. Angell, IEEE Trans. Electron Devices, 1979, 26, 1880–1886 CrossRef.
- D. Cruz, J. P. Chang, S. K. Showalter, F. Gelbard, R. P. Manginell and M. G. Blain, Sens. Actuators, B, 2007, 121, 414–422 CrossRef.
- P. R. Lewis, P. Manginell, D. R. Adkins, R. J. Kottenstette, D. R. Wheeler, S. S. Sokolowski, D. E. Trudell, J. E. Byrnes, M. Okandan, J. M. Bauer, R. G. Manley and G. C. Frye-Mason, IEEE Sens. J., 2006, 6, 784–795 CrossRef.
- A. D. Radadia, R. I. Masel, M. A. Shannon, J. P. Jerrell and K. R. Cadwallader, Anal. Chem., 2008, 80, 4087–4094 CrossRef CAS.
- A. Bhushan, D. Yemane, D. Trudell, E. Overton and J. Goettert, Microsyst. Technol., 2007, 13, 361–368 CAS.
- M. Stadermann, A. D. McBrady, B. Dick, V. R. Reid, A. Noy, R. E. Synovec and O. Bakajin, Anal. Chem., 2006, 78, 5639–5644 CrossRef CAS.
- S. Reidy, G. Lambertus, J. Reece and R. Sacks, Anal. Chem., 2006, 78, 2623–2630 CrossRef CAS.
- P.-J. Chen, C.-Y. Shih and Y.-C. Tai, Lab Chip, 2006, 6, 803–810 RSC.
- P. Haglund, P. Korytár, C. Danielsson, J. Diaz, K. Wiberg, P. Leonards, U. Brinkman and J. de Boer, Anal. Bioanal. Chem., 2008, 390, 1815–1827 CrossRef CAS.
- S. I. Shopova, I. M. White, Y. Sun, H. Zhu, X. Fan, G. Frye-Mason, A. Thompson and S.-j. Ja, Anal. Chem., 2008, 80, 2232–2238 CrossRef CAS.
- Y. Sun and X. Fan, Opt. Express, 2008, 16, 10254–10268 CrossRef CAS.
- Y. Sun, S. I. Shopova, G. Frye-Mason and X. Fan, Opt. Lett., 2008, 33, 788–790 Search PubMed.
- Y. Sun, J. Liu, G. Frye-Mason, S.-j. Ja, A. K. Thompson and X. Fan, Analyst, 2009, 134, 1386–1391 RSC.
- D. R. Deans and I. Scott, Anal. Chem., 1973, 45, 1137–1141 CrossRef CAS.
- J. H. Purnell and M. H. Wattan, Anal. Chem., 1991, 63, 1261–1264 CrossRef CAS.
- J. R. Jones and J. H. Purnell, Anal. Chem., 1990, 62, 2300–2306 CrossRef CAS.
- M. Akard and R. Sacks, Anal. Chem., 1994, 66, 3036–3041 CrossRef CAS.
- T. Veriotti, M. McGuigan and R. Sacks, Anal. Chem., 2001, 73, 279–285 CrossRef CAS.
- R. K. Chang and A. J. Campillo, Optical Processes in Microcavities, World Scientific, Singapore, 1996 Search PubMed.
- M. L. Gorodetsky and V. S. Ilchenko, J. Opt. Soc. Am. B, 1999, 16, 147–154 Search PubMed.
- I. M. White, H. Oveys and X. Fan, Opt. Lett., 2006, 31, 1319–1321 CrossRef.
| This journal is © The Royal Society of Chemistry 2010 |
