DOI:
10.1039/B912880H
(Paper)
Analyst, 2010,
135, 177-181
Multiplex tumor marker detection with new chemiluminescent immunoassay based on silica colloidal crystal beads
Received
30th June 2009
, Accepted 5th November 2009
First published on
13th November 2009
Abstract
A new multiplex chemiluminescent immunoassay (CLIA) based on silica colloidal crystal beads (SCCBs) was developed for tumor marker detection. As the code is the characteristic reflection peak originating from the stop-band of colloid crystal, they avoid photobleaching, the potential interference of encoding fluorescence with analyte-detection fluorescence and chemical instability. Meanwhile our SCCBs suspension array improved the luminescence analysis efficiency by using chemiluminescent detection of enzyme labels. By forming a sandwich immunocomplex on SCCBs, the proposed suspension array was used for simultaneous multiplex detection of tumor markers in one test tube. The results showed that the linear range was 0.5–100ng ml−1 and 1.0–120ng ml−1 for carcinoembryonic antigen (CEA) and α-fetoprotein (AFP) with a detection limit of 0.12ng ml−1 and 0.16ng ml−1 at 3σ. The proposed array showed the storage stability and the accuracy for sample detection were acceptable, and the results were in acceptable agreement with the reference electrochemiluminescence method. This technique provided an automated, simple, sensitive and low-cost approach for multianalyte immunoassay.
1. Introduction
Today immunoassays of biomarkers play a prominent role in early detection of disease, evaluating the stage of disease, monitoring the response after treatment, and predicting recurrence. The measurement of a single marker is often insufficient for disease diagnosis because no single marker is specific and sensitive enough to strict diagnostic criteria, thus multianalyte immunoassays of biomarkers have become very popular in recent years.
Various labels including organic fluorescent dyes, quantum dots and nanoparticles1–3 have been adopted to tag the antibodies or antigens of the corresponding analytes (one per analyte) to realize multianalyte immunoassay. However, combinations of multiple labels in a single run often leads to loss of assay performance due to their incompatible optimal assay conditions,4 and the signal overlapping of different labels results in difficulty in accurate quantitation.5 Recently, some research groups have demonstrated the feasibility of the determination of multiple biological analytes with elemental tags by inductively coupled plasma mass spectrometry (ICPMS).6–8 This method has high sensitivity and overcomes some of the limitations of currently available tagging approaches. However, the number of labels available for simultaneous determination is restricted and the cost is high. It is still a great challenge to develop novel single-label-based multianalyte immunoassays. In our previous work, we proposed the silica colloidal crystals beads (SCCBs) as carriers of suspension arrays, whose code is the characteristic reflection peak originating from the stop-band of colloid crystal.9–11 It is very cheap and easily detected. As the peak position is based on its periodical structure, the code is very stable and the fluorescent background is low. In addition, the SCCBs provide a much higher surface-to-volume ratio which means more opportunities for probe immobilization and analyte molecules being captured. All these properties make the SCCBs suitable for sensitive detection. Meanwhile, we showed that by combining CLIA, the low efficiency luminescence could be improved and photobleaching and the potential interference of encoding fluorescence with analyte-detection fluorescence could be avoided.12 Here, it was demonstrated that the suspension array showed high sensitivity for tumor markers when the CLIA was performed on the surface of SCCBs.
CEA and AFP are important markers for diagnosis purposes.13–15 Now, a series of immunoassay methods have been developed for their detection, including enzyme-linked-immunosorbent-assay,16 chemiluminescent,17,18 fluorescentimmuno-assay,19 electrochemical detection20,21 and micellar electrokinetic capillary chromatographic.22 More and more attention was paid for multiplex chemiluminescent methods due to its wide calibration range, high sensitivity, need of simple instrumentation and suitability for miniaturization. Flow-through chemiluminescent multiplex immunoassay,23,24 multiplexed sandwich enzyme-linked immunosorbent assay (ELISA) array25 and protein chip system26 have been developed for tumor markers detection. These methods were improved based on conventional chemiluminescent immunoassay. This work prepared a multiplex chemiluminescent immunoassay based on silica colloidal crystal beads for detection of CEA and AFP. It is a novel suspension array which overcomes some drawbacks such as long assay time and poor repeatability in conventional methods.27The proposed method showed the advantages of simplicity, rapidity, sensitivity, low-cost, thus could be further developed for practical clinical detection of serum CEA and AFP level.
2. Experimental
2.1 Materials
CEA and AFP standard solution, horseradish peroxidase(HRP)-labeled mouse monoclonal anti-CEA and anti-AFP solution (1.0mg ml−1) and mouse monoclonal anti-CEA and AFP solution (2.0mg ml−1) were obtained from Shanghai Linc-Bio Science Co. (China). Enhanced luminol with p-coumaric acid as signal enhancer was purchased from Sigma. Bovine serum albumin (BSA) was brought from Sigma Chemicals. 3-aminopropyltriethoxysilane (APTES) and glutaraldehyde were purchased from Alfa Aesar Co. Monodisperse silica nanoparticles were synthesized by Stöber method. 0.01MPBS (pH 7.4) was used as coupling buffer for antibody immobilization. PBS containing 2% bovine serum albumin was used as blocking buffer to block the residual reactive sites on the SCCBs. Wash buffer was PBS spiked with 0.05% Tween-20. Roche diagnostics kits for CEA and AFP (Roche Diagnostics GmbH, Germany) were used for the reference electrochemiluminescent immunoassay (ECLIA). The clinical serum samples were provided by Jiangsu Tumor hospital (China). All buffers were prepared using ultra-pure water treated in a Milli-Q system (Millipore, Bedford, MA). All other reagents were of the best grade available and used as received.
2.2 Instrumentation
The microfluidic device used for SCCBs generation was home-made.9 Chemiluminescence was captured by a cool CCD camera. (ShuKang Company, HD-2001A). Photographs of SCCBs were taken with an optical microscope (OLYMPUS BX51) equipped with a CCD camera (Media Cybernetics Evolution MP 5.0). Reflection spectra of SCCBs were recorded by a microscope equipped with a fiber optic spectrometer (Ocean Optics, USB2000).
2.3 Fabrication of SCCBs
Aqueous suspension containing monodisperse silica nanoparticles with diameters of 225 ± 4.9nm, 240 ± 5.8nm and 264 ± 6.2nm respectively was used as the dispersed phase. The concrete procedures were described in previous study of our lab.10
2.4 Preparation of immunoaffinity SCCBs
The SCCBs were coated with mouse monoclonal anti-CEA antibody by covalent bonding method. First, the SCCBs were treated with piranha solution (30% hydrogen peroxide and 70% sulfuric acid) for 6 h. After being rinsed with water and dried by nitrogen flow, an ethanol solution of APTES (5%) was incubated with the SCCBs for 4 h to make the surface amination. Then, the amino-functionalized SCCBs were put into PB buffer containing glutaraldehyde (2.5%) for 4 h at room temperature and subsequently washed 3 × 10 min with PBS buffer solution. After these steps, the SCCBs were reacted with mouse monoclonal anti-CEA antibody(1mg ml−1) in PBS buffer solution overnight at 4 °C and then the beads were treated with 1mg ml−1 NaCNBH3 solution for 1 h at 4 °C. Finally, the unreacted groups of glutaraldehyde on the SCCBs' surface were blocked with PBS containing bovine serum albumin (BSA) for 2 h. For multiplex CLIA, two kinds of these SCCBs, with diameters of 225nm and 240 nm were modified with mouse monoclonal anti-CEA and anti-AFP antibody respectively.
2.5 Sandwich immunoassay procedure
The capture antibody-modified SCCBs were incubated with a series of samples (10 μL per bead) containing either purified CEA antigen or serum at various concentrations for 25 min. When necessary, the dilution of serum sample was 1![[thin space (1/6-em)]](https://www.rsc.org/images/entities/char_2009.gif) :10 by mixing the sample with the diluent containing phosphate buffer before incubation. Thoroughly washed with PBST, the tracer antibodies prepared by diluting the stock solution of HRP-labeled anti-CEA with 0.01M PBS in a volume ratio of 1:50 was added to react with captured CEA for 20 min. During this process, the test tubes were shaken at 37 °C. The unbound HRP-labeled was washed away with PBST. Then the beads were put on the surface of a glass chip and incubated in the solution of enhanced luminol (50 μL). Finally, light signals were captured with an in-house-constructed Chip-Reader based on a CCD camera and controlled with a computer system using in-house-developed software.
:10 by mixing the sample with the diluent containing phosphate buffer before incubation. Thoroughly washed with PBST, the tracer antibodies prepared by diluting the stock solution of HRP-labeled anti-CEA with 0.01M PBS in a volume ratio of 1:50 was added to react with captured CEA for 20 min. During this process, the test tubes were shaken at 37 °C. The unbound HRP-labeled was washed away with PBST. Then the beads were put on the surface of a glass chip and incubated in the solution of enhanced luminol (50 μL). Finally, light signals were captured with an in-house-constructed Chip-Reader based on a CCD camera and controlled with a computer system using in-house-developed software.
2.6 Multianalyte immunoassay procedure
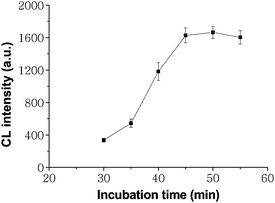
Three kinds of SCCBs (SCCBs1, SCCBs2, SCCBs3) with diameters of 225 ± 4.9nm, 240 ± 5.8nm and 264 ± 6.2nm were modified with capture antibody mouse monoclonal anti-CEA and anti-AFP antibody and control PBS respectively, and used for multiplex CLIA. They were mixed together and exposed to a solution containing different resolution of CEA and AFP. Thoroughly washed with PBST, the tracer antibodies were added to react with captured CEA and AFP for 20 min. After bio-reaction, the three-dimensional image and chemiluminescence image of SCCBs were captured for decoding and detection of bio-reaction. Fig. 1 shows the three images.
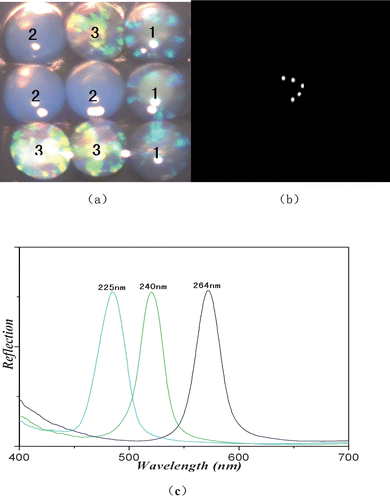 |
| | Fig. 1 (a) Photographs of three kinds of SCCBs composed of silica nanoparticles with the diameters of 225 nm, 240 nm and 264 nm, respectively. (b) Chemiluminescence image of SCCBs after reaction. (c) Reflection spectra of the three kinds of SCCBs. | |
3. Results and discussion
3.1 Optimization of the immunoassay procedure
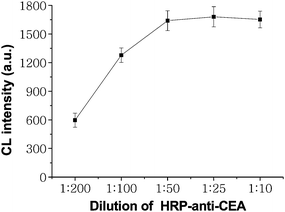
Incubation time is a restriction factor to the improvement of immunoassay speed and sample throughput, which is controlled by mass transport of immunoreagents and kinetics characteristics of immunoreaction. As shown in Fig. 2, with the increasing incubation time the CL intensities for 80ng ml−1 CEA increased quickly and reached their maximum values at 45 min, implying the maximum formation of these sandwich immunocomplexes. The times for obtaining the maximum responses were obviously shorter than that of 1–3 h at 37 °C for the conventional microwell plate ELISA method. It resulted from a high surface-to-volume ratio as the SCCBs were composed of nanoparticles and showed a nanopattern surface and thus improved the immunoreaction rate.
 |
| | Fig. 2 Effects of incubation time on CL intensity for 80ng ml−1 CEA. The number of replicates at any concentration was five. Error bars represent standard deviations. | |
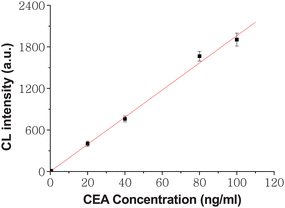
The working concentration of HRP-labeled anti-CEA was investigated to give compromise between a good sensitivity and wide assay range. The optimal dilution of HRP-labeled anti-CEA solution was established by incubating it diluted at different ratios with 80ng ml−1 CEA captured on the SCCBs to detect the CL emission under the optimized CL detection conditions. The CL intensity reached a maximum value at a dilution of 1:50 for HRP-labeled anti-CEA (Fig. 3). Thus, 1:50 dilution of the enzyme tracer with 0.01M pH 7.0 PBS was chosen.
 |
| | Fig. 3 Effects of dilution of HRP-labeled-anti-CEA solution on CL intensity for 80ng ml−1 CEA. The number of replicates at any concentration was five. Error bars represent standard deviations. | |
3.2 Analytical performance and detection of CEA in clinical serum samples
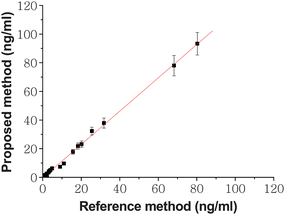
Fig. 4 shows the dose–responses and calibration curves for CEA. The CL intensity increased linearly with the increasing CEA concentration from 0.5 to 100ng ml−1.When CEA concentration was more than 100ng ml−1, the increase of CL intensity departed from the line with decreasing slopes. The detection limit was calculated at a signal/noise ratio of 3 to be 0.12ng ml−1, which was much lower than those reported methods by some immunoassays.28,29 As the SCCBs provided a high surface-to-volume ratio, more opportunities were provided for HRP-anti-CEA binding. The porous structure of the SCCBs is also helpful for HRP to catalyze the substrate. Meanwhile the ECL usage made the test more sensitive and stable because it offers significant gains in sensitivity over most other methods at a low cost. In addition, the special surface characteristic of SCCBs could reduce the steric hindrance of the molecules via the artificial separation imposed by the nanopattern, and the analytes on this surface are much freer to react with their specific probe molecules.30 Under the optimal conditions, 30 clinical serum samples were assayed using the proposed method as well as the reference electrochemiluminescence method. The latter was carried out in Jiangsu Institute of Cancer Prevention and Cure. The results showed an acceptable agreement between the two methods (R2 = 0.9972, P < 0.0001, Fig. 5).
 |
| | Fig. 4 Dose-responses and calibration curves for CEA. The number of replicates at any concentration was five. Error bars represent standard deviations. | |
 |
| | Fig. 5 Comparison between the proposed and reference methods for immunoassay of CEA levels in serum samples. The number of replicates at any concentration was five. Error bars represent standard deviations. | |
3.3 Reproducibility and stability of chemiluminescent immunoassay based on silica colloidal crystal beads
To investigate the reproducibility of our photonic suspension array, we repeatedly assayed 10 times for three different concentrations of CEA. The intra- and inter-assay CVs obtained at CEA concentration of 2, 20 and 80ng ml−1 were 5.7%, 9.3%; 4.6%, 6.5% and 3.3%, 6.9%, respectively. All the values of intra-assay and inter-assay CVs were below 10%, which showed acceptable detection reproducibility of the suspension array. When the beads were not in use, they were stored in PBS (pH 7.4) at 4 °C. No obvious change was observed after storage for at least one year for the SCCBs without probe immobilization and ten days for the SCCBs with probe immobilization. Thus, the proposed immunoassay system showed perfect stabilization in practical applications.
3.4 Multianalyte immunoassay
3.4.1 Evaluation of cross-reactivity and cross-talk.
Cross-reactivity and cross-talk are two key parameters regarding specificity and reliability of multianalyte immunoassay. In this protocol, AFP and CEA were detected in SCCBs surface, therefore, the cross-talk resulting from the diffusion of the reaction product was avoidable, and cross-reactivity potentially occurring between the tumor markers and their noncognate antibodies was the only factor influencing the reliability of the proposed multianalyte immunosensing system.
To examine the cross-reactivity between AFP antibodies and CEA, increasing level of AFP was put into 80ng ml−1 CEA standard solution and incubated with CEA antibodies. Even when the concentration of coexistent AFP reached 200ng ml−1, the maximum change of the resultant CL signal from SCCBs did not go beyond 5.9% (Fig. 6a). With the same protocol, the presence of variant amount of AFP in 80ng ml−1 CEA led to a change less than 3.9% of the CL signal (Fig. 6b). These results showed that the cross-reactivity was insignificant and the two tumor markers could be detected simultaneously using our SCCBS suspension array with negligible interference to each other.
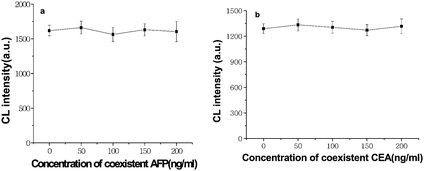 |
| | Fig. 6 Cross-reactivities of AFP to CEA antibody in the presence of 80ng ml−1 CEA (a) and CEA to AFP antibody in the presence of 80ng ml−1 AFP (b). | |
3.4.2 Multianalyte performance.
The linear ranges for AFP are 1–120ng ml−1 (Fig. 7 a). The limits of detection for AFP are 0.16ng ml−1 at a signal/noise ratio of 3. During the multianalyte immunoassay, there was less effect on the linear range of CEA determined before (Fig. 7 b). Since their cut-off values in clinical diagnosis are 25 and 5ng ml−1, respectively, the sensitivity of the proposed multianalyte immunosensing system is enough for practical application. Under the optimal conditions, we examined 25 clinical serum samples using the proposed method as well as the reference electrochemiluminescence method. The data showed no significant difference between the results of the two methods (Fig. 8, r = 0.960 for CEA, r = 0.983 for AFP). It meant that our array showed good analytical reliability. Low diffusion of analytes is a bottleneck for sensitive CLIA in planar chip. Our multiplex chemiluminescent immunoassay based on Silica Colloidal Crystal Beads is a new suspension array to improve the analyte throughput and the sensitivity. Compared with fluorescent immunoassay for CEA and AFP performed by another group in our lab,31 our multiplex chemiluminescent immunoassay is more sensitive. Chemiluminescence enzyme immunoassays have high detectability and wide dynamic range. The CL signal was detected with the luminol-based enhanced chemiluminescence (ECL) system, the ECL reaction offers more intense, prolonged, stable light emission and the possibility of improving the sensitivity of immunoassays to at least 2–3 orders of magnitude compared to conventional colorimetric detection.32,33In addition, for fluorescent immunoassay, sample may have components that interfere with a selected fluorophore and the autofluorescence of substratums can cause significant reduction in signal-to-noise ratios. The elements of our suspension array were the silica colloidal crystal beads (SCCBs), whose codes are the characteristic reflection peak originated from the stop-band of colloid crystal. No fluorescent dye was used and all encoding information was from structural color, no interference occurred between the decoding and CL detection which avoids incompatible optimal assay conditions and the spectral overlapped problem existing in most color-encoded particle arrays, and also need no complex instrument. Fast detection of decoding and bio-reaction was another advantage of our multiplex CLIA. After bio-reaction, the decoding information and signals of bio-reaction could be easily detected when the SCCBs were laid on the glass chip. All these advantages made our method easy automation and miniaturization to realize high throughput assay.
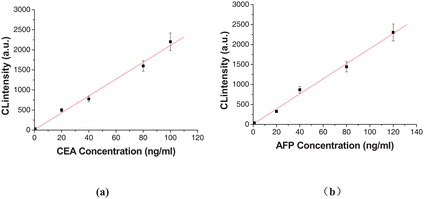 |
| | Fig. 7 Dose–responses and calibration curves for multianalyte immunoassay of CEA (a) and AFP (b). The number of replicates at any concentration was five. Error bars represent standard deviations. | |
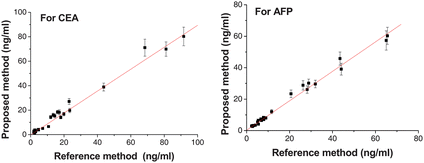 |
| | Fig. 8 Comparisons between the proposed and reference methods for immunoassay of CEA and AFP levels in serum samples. The number of replicates at any concentration was five. Error bars represent standard deviations. | |
4. Conclusion
A novel multiplex chemiluminescent immunoassay based on silica colloidal crystal beads are proposed for detection of tumor markers. The suspension array showed high sensitive, good detection reproducibility and storage stability. In addition, the suspension array using SCCBs as coding elements could avoid the spectral overlapped problem existing in most color-encoded particles arrays. Therefore, this method is simple, stable, flexible, and easy automation for high throughput. The sensitivity and linear ranges are also sufficient for practical application. This work presents a proof of method of a multiplex chemiluminescent immunoassay, which can be further developed for assay of markers to meet increasing diagnostic needs.
Acknowledgments
This research was supported by Ministry of Science and Technology (Grant No. 2006AA03Z331), National Science Foundation of China (Grant Nos. 20573018, 60121101, 20703010) and the Open Research Fund of State Key Laboratory of Bioelectronics Southeast University.
References
- E. E. Swartzman, S. J. Miraglia, J. Mellentin-Michelotti, L. Evangelista and P. M. Yuan, Anal. Biochem., 1999, 271, 143–151 CrossRef CAS.
- S. S. Khan, M. S. Smith, D. Reda, A. F. Suffredini and J. P. McCoy, Cytometry, Part B, 2004, 61b, 35 Search PubMed.
- A. Tarnok, J. Hambsch, R. Chen and R. Varro, Clin. Chem., 2003, 49, 1000 CrossRef CAS.
- L. J. Kricka, Clin. Chem., 1992, 38, 327–328 CAS.
- E. R. Goldman, A. R. Clapp, G. P. Anderson, H. T. Uyeda, J. M. Mauro, I. L. Medintz and H. Mattoussi, Anal. Chem., 2004, 76, 684–688 CrossRef CAS.
- O. Ornatsky, V. I. Baranov, D. R. Bandura, S. D. Tanner and J. J. Dick, J. Immunol. Methods, 2006, 308, 68–76 CrossRef CAS.
- S. H. Hu, S. C. Zhang, Z. C. Hu, Z. Xing and X. R. Zhang, Anal. Chem., 2007, 79, 923–929 CrossRef CAS.
- X. D. Lou, G. H. Zhang, I. Herrera, R. Kinach, O. Ornatsky, V. Baranov, M. Nitz and M. A. Winnik, Angew. Chem., Int. Ed., 2007, 46, 6111 CrossRef CAS.
- X. W. Zhao, Y. Cao, F. Ito, H. H. Chen, K. Nagai, Y. H. Zhao and Z. Z. Gu, Angew. Chem., Int. Ed., 2006, 45, 6835 CrossRef CAS.
- Y. J. Zhao, X. W. Zhao, C. Sun, J. Li, R. Zhu and Z. Z. Gu, Anal. Chem., 2008, 80, 1598 CrossRef CAS.
- Y. J. Zhao, X. W. Zhao, J. Hu, M. Xu, W.J. Zhao, L. G. Sun, C. Zhu, H. Xu and Z. Z. Gu, Adv. Mater., 2008, 2, 339.
- X. P. Pei, Y. J. Zhao, X. W. Zhao, H. Xu, B. A. Chen and Z. Z. Gu, J. Nanosci. Nanotechnol., 2009, 9, 6320, DOI:10.1166/jnn.2009.1335.
- H. X. Ju, G. F. Yan, F. Chen and H. Y. Chen, Electroanalysis, 1999, 11, 124–128 CrossRef CAS.
- A. M. D. Bisceglie, R. K. Sterling, R. T. Chung, J. E. Everhart, J. L. Dienstag, H. L. Bonkovsky, E. C. Wright, G. T. Everson, K. L. Lindsay, A. S. F. Lok, W. M. Lee, T. R. Morgan, M. G. Ghany and D. R. Gretch, J. Hepatol., 2005, 43, 434–441 CrossRef.
- M. F. Yuen and C. L. Lai, Best Pract. Res. Clin. Gastroenterol., 2005, 19(1), 91–99 Search PubMed.
- F. Shigetoshi, I. Kiyonori, Y. Kunio, S. Tatsuo and T. Kazuhisa, Tumor Biol., 1992, 13, 316–323 Search PubMed.
- S. Aoyagi, M. Kusumi, A. Matsuyuki, M. Maeda, A. Tsuji and J. Immunol, Methods, 1991, 137, 73–78 CAS.
- W. Dungchai, S. W. Iangproh, J. M. Lin, O. Chailapakul, S. Lin and X. T. Ying, Anal. Bioanal. Chem., 2007, 387, 1965–1971 CrossRef CAS.
- T. Matsuya, S. Tashiro, N. Hoshino, N. Shibata, Y. Nagasaki and K. Kataoka, Anal. Chem., 2003, 75, 6124–6132 CrossRef CAS.
- Y. Namba, M. Usami and O. Suzuki, Anal. Sci., 1999, 15, 1087–1093 CAS.
- D. P. Tang, R. Yuan and Y. Q. Chai, J. Phys. Chem., 2006, 110, 11640–11646 Search PubMed.
- R. Y. Wang, X. N. Lu and W. Y. Ma, J. Chromatogr., 2002, B 779, 157–162.
- Z. F. Fua, F. Yan, H. Liu, Z. J. Yang and H. X. Ju, Biosens. Bioelectron., 2008, 23, 1063–1069 CrossRef CAS.
- Z. J. Yang, H. Liu, C. Zong, F. Yan and H. X. Ju, Anal. Chem., 2009, 81, 5484–5489 CrossRef CAS.
- M. Liew, M. C. Groll, J. E. Thompson, S. L. Call, J. E. Moser, J. D. Hoopes, K. Voelkerding, C. Wittwer and R. S. Spendlove, BioTechniques, 2007, 42, 327–333 CrossRef CAS.
- Z. H. Sun, X. L. Fu and L. Zhang, Anticancer.Research., 2004, 24, 1159 CAS.
- J. P. Nolan and L. A. Sklar, Trends Biotechnol., 2002, 20, 9–12 CrossRef CAS.
- Z. F. Fu, C. Hao, X. Q. Fei and H. X. Ju, J. Immunol. Methods, 2006, 312, 61–67 CrossRef CAS.
- N. Nashida, W. Satoh, J. Fukuda and H. Suzuki, Biosens. Bioelectron., 2007, 22, 3167–3173 CrossRef CAS.
- H. X. Ju and S. Wu, Handbook of Electrochemical Nanotechnology, 2009, 2, 189–208 Search PubMed.
- Y. J. Zhao, X. W. Zhao, X. P. Pei, J. Hu, W. J. Zhao, B. A. Chen, Zhu and Z. Z. Gu, Anal. Chim. Acta, 2009, 633, 103–108 CrossRef CAS.
- N. Kuroda, R. Shimoda, M. Wada and M. Nakashima, Anal. Chim. Acta, 2000, 403, 131 CrossRef CAS.
- C. A. Marquette, P. Hezard, A. Degiuli and L. J. Blum, Sens. Actuators, B, 2006, 113, 664 CrossRef.
|
| This journal is © The Royal Society of Chemistry 2010 |
Click here to see how this site uses Cookies. View our privacy policy here.