Fourier transform infrared (FTIR) spectromicroscopic characterization of stem-like cell populations in human esophageal normal and adenocarcinoma cell lines†
R.
Zhao
a,
L.
Quaroni
*ac and
A. G.
Casson
*ab
aDepartment of Surgery and the Cancer Stem Cell Research Group, College of Medicine, and the Canadian Light Source, University of Saskatchewan, Saskatoon, SK, Canada
bRoyal University Hospital, Suite 2646, 103 Hospital Drive, Saskatoon, SK, Canada S7N 0W8. E-mail: alan.casson@usask.ca; Fax: 306-966-8026; Tel: 306-966-8641
cSwiss Light Source, 5232 Villigen-PSI, Switzerland. E-mail: luca.quaroni@psi.ch; Fax: +041 (0)563102111; Tel: +041 (0)563102199
First published on 10th November 2009
Abstract
We have tested an approach to identify putative cancer stem cells that involves measurement of the infrared absorption spectrum of individual cells in an aqueous environment, and their subsequent classification using multivariate data analysis techniques. Two primary esophageal cell lines were characterized: the immortalized normal esophageal epithelial cell line, Het-1A, and the esophageal adenocarcinoma cell line, OE33. In addition, we also evaluated spheroids, reflecting stem-like cell populations, which were derived from each parent cell line when grown in serum-free media. As differences in cell size appeared to be a strong discriminating factor, a correction needs to be performed to allow a reliable classification based on infrared absorption spectra. We demonstrated that stem-like cells derived from Het-1A could easily be discriminated on the basis of absorbance differences in the 1000–1200 cm−1 spectral interval, whereas this was not possible for OE33. Furthermore, we found that changes due to aging of OE33 cells in culture dominated the infrared absorption spectra and somewhat limited the potential of this approach to identify stem-like cell populations using this in vitro model system.
Introduction
Following the recent identification of cancer stem cell (CSC) populations in hematologic malignancies,1 it has been proposed that various human solid tumors may contain a small proportion of CSCs, localized to discrete niches within each organ, including the gastrointestinal tract.2–8 Key characteristics of CSCs are capacity for asymmetric cell division, for self-renewal, and the ability to remain quiescent for long intervals (reviewed in9–12). CSCs are currently identified by their formation of spheroid clusters when cultured in serum-free media13 by functional tumorigenic assays, and by the presence of cell surface differentiation markers such as GRP49,14 Lgr5,15 CD133,16 EpCAM10 and CD44.17Primary esophageal adenocarcinoma (EADC), a tumor with increasing incidence in North America and Europe18,19 generally arises from Barrett’s esophagus (BE), a premalignant lesion characterized by replacement of the normal esophageal squamous epithelium by a specialized metaplastic columnar cell-lined epithelium.20 Although various molecular genetic alterations have been reported during the progression of BE to invasive EADC (reviewed in21,22), in keeping with a clonal evolution model of carcinogenesis, esophageal CSCs have not yet been identified.
The potential of Fourier transform infrared (FTIR) spectroscopy as a diagnostic technique has been recognized for decades.23,24 Absorption of radiation in the mid-infrared spectral region provides rich information on the molecular properties of a sample, giving rise to characteristic spectral patterns in transmitted or reflected light. Many pathological conditions are associated to perturbations of metabolism that are reflected in homeostatic changes of molecular components in cells and tissues. The clinical potential of FTIR spectroscopy to detect such changes and its use as a diagnostic tool has therefore recently received increasing attention. Recently, we utilized FTIR spectromicroscopy in the mid-IR spectral region to characterize histologically normal esophageal squamous epithelium, BE, and primary EADC tissues.25 We used multidimensional datasets reporting the spectroscopic properties at each sampled point, analyzed by performing a hierarchical cluster analysis (HCA) on the second derivative of spectral traces, to identify regions with distinct spectroscopic properties. Normal esophageal epithelium was characterized by a few well defined regions, mostly of large size (tens of contiguous pixels), which correlated with tissue histology, specifically the basal cell layer, a potential location for a CSC niche.26 BE tissues had characteristic regions localized to gland crypts, a potential CSC niche,27,28 ranging in size from one pixel to a few tens of pixels, which displayed IR spectra with defined absorption features characteristic of glycoproteins.
The success of FTIR spectroscopy followed by hierarchical clustering analysis in identifying regions with specific molecular composition associated with defined stages of esophageal adenocarcinogenesis prompted us to evaluate the viability of this technique to identify putative esophageal CSC populations. Here, we used FTIR and HCA to characterize an immortalized normal esophageal epithelial cell line, Het-1A,29 a human EADC cell line, OE33,30 and spheroid cells (reflecting cancer stem-like cell populations) derived from each parent cell line. Finally, we use principal component analysis (PCA) as an additional data analysis technique to confirm the results obtained by HCA.
Experimental
Esophageal cell lines and cell culture
The immortalized human normal esophageal epithelial cell line, Het-1A,29 and the human EADC cell line, OE33,30 were purchased from the American Type Culture Collection (ATCC, Manassas VA) and the European Cell Culture Collection (ECCC, Porton Down, UK), respectively. Het-1A cells were grown in Dulbecco's modified Eagle's medium (DMEM), while OE33 cells were grown in RPMI 1640 (RPMI) under standard cell culture conditions (37 °C and 5% CO2). Both media contained 10% fetal bovine serum (FBS) and 1% penicillin-streptomycin solution. All reagents were ordered from Invitrogen (Burlington ON, Canada). At 70–80% confluence, cells were passaged using 0.05% trypsin/EDTA (Sigma-Aldrich, Oakville ON, Canada).Sphere culture
Fifty thousand cells from each cell line were seeded in the Ultra-Low Attachment Cell Culture Flask (Corning, Corning NY) with serum free sphere culture medium: DMEM/F-12, insulin (5 μg ml−1), basic fibroblast growth factor (bFGF) (10 ng ml−1), epidermal growth factor (EGF) (20 ng ml−1), and bovine serum albumin (BSA) (0.4%). Culture media and growth factors were obtained from Invitrogen (Burlington ON, Canada), and BSA from Sigma-Aldrich (Oakville ON, Canada). Cells were cultured under 37 °C and 5% CO2 for 4 weeks, changing the media every 3 days.Parental cells (Het-1A and OE33) were detached from the culture flask using 0.05% trypsin/EDTA, washed and suspended with normal saline. Spheres were isolated from sphere culture using a 50 μm cell strainer (BD Science, Oakville ON), dissociated with 0.05% trypsin/EDTA, and washed with normal saline. Cells were counted using a hemocytometer, and cell viability confirmed by Trypan blue staining. Cells were suspended in normal saline at a concentration of 1 × 10⁶ cells ml−1.
FTIR spectromicroscopy
FTIR experiments were carried out using the endstation of beamline 01B1-01 at the Canadian Light Source. The endstation comprises a Bruker (Bruker Optics, Billerica, MA) IFS66 v/S interferometer coupled to a Hyperion 2000 IR microscope. The cell suspension was transferred to a sample holder for liquids, moved to the infrared microscope and measured in transmission. A 36× magnification Schwarzschild objective was used to focus IR light on the sample and collect the reflected beam. A KBr-supported Ge-multilayer beamsplitter and an MCT detector were used to measure spectra in the mid-infrared spectral region. Interferograms were recorded by scanning the moving mirror at 40 kHz, to an upper frequency limit of 7899 cm−1 and with a spectral resolution of 4 cm−1. 1024 scans were averaged for the background measurement, in a position of the holder where no cells were present, and 128 scans were averaged for each cell measurement. Single channel traces were obtained using the fast Fourier transform algorithm, without any zero-filling, after applying a Blackman-Harris 3-term apodization function. The upper confocal aperture was set to enclose whole cells (20 × 20 μm2), while the lower confocal aperture was set at 30 × 30 μm2. Individual cells were centered within the apertures by visual inspection. Spectra were collected for about 120 cells per cell type.For the measurement, the cell suspension obtained fresh from cytometry was transferred to a sample holder for solutions. The holder comprises two 1 mm thick optical windows separated by a PTFE spacer with a nominal thickness of 15 μm. Measurement of effective thickness, based on infrared absorption of water, showed that with each holder assembly with an aqueous solution effective thickness varied between 18 and 22 μm. CaF2 was used as window material for single cell measurements, while BaF2 was used for subcellular mapping.
Cells were visually selected before the measurement, and the ones that appeared damaged or fragmented were avoided. During preliminary experiments it was observed that more degraded cells were found in the sample when it was kept for several hours under the microscope. To reduce the risk that cell damage or cell death might result after prolonged removal from the culture, the sample was refreshed approximately every four hours. This corresponded to measuring sequentially about 20 to 50 cells before renewing the sample.
The stability of the spectra of individual cells under such conditions was tested by measuring the spectrum of single cells over several hours. For all the cases where this test was run no significant spectroscopic changes were observed over at least four hours. In particular, during this time, spectroscopic changes ascribable to cell death were not observed.31,32 We conclude that under the measurement conditions in use the cells are subject to small or insignificant changes in their chemical composition within the detection limits of FTIR spectroscopy.
Data were analyzed after converting absorption spectra to their second derivatives to allow for more accurate comparison by reducing baseline effects. When required, normalization to the Amide II band was carried out by performing a minimization/maximization using the range 1520 cm−1 to 1570 cm−1 of the second derivative band. The spectra were assembled into two-dimensional arrays and analyzed using hierarchical clustering.
Hierarchical clustering analysis was carried out using the program CytoSpec 1.1 (CytoSpec Inc., Boston, MA), using the second derivative of spectral traces in the 1020 cm−1 to 1340 cm−1 and 1000 cm−1 to 1200 cm−1 regions. Spectra were compared using Pearson's function and classified in clusters using Ward's algorithm.
PCA analysis was performed using The Unscrambler 9.8 (CAMO Software AS, Oslo, Norway). A cross validation method was used with 2 segments of twenty one samples each. Fifty-seven spectra of Het-1A cells were used for calibration.
Graphs were prepared using OPUS 6.5, CytoSpec 1.1, and Microsoft Excel (Microsoft Corp, Redmond, WA, USA).
Results
FTIR spectromicroscopy
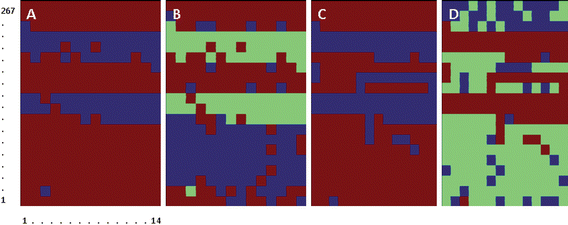
The number of clusters was progressively increased until more than 90% of the cells of each population could be classified within a subgroup of clusters. A classification into two clusters was sufficient to discriminate between the two different cell populations, with a majority of cells from each population clustering together (Fig. 1A). Over a total of 256 cells, 108 Het-1A cells (92%; 108/118) clustered in the same group, and 133 Het-1A spheroid cells (96%; 133/138) clustered together. No separate clustering of cells from different batches was observed, indicating that spectral differences between batches (e.g. due to a different distribution of cells in various stages of their life cycle) were not a dominant discriminator for clustering.
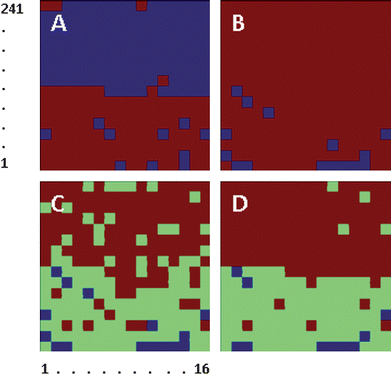 | ||
| Fig. 1 Clustering of Het-1A (numbers 1 to 118) and Het-1A spheroid cells (numbers 119 to 256) into two clusters. A, Clustering of second derivative traces of cell spectra using the 1320–1020 cm−1 spectral range. B, Clustering of second derivative traces of spectra after normalization to the Amide II band spectra using the 1320–1020 cm−1 spectral range. C, Clustering of second derivative traces of cell spectra using the 1320–1020 cm−1 spectral range. D, Clustering of second derivative traces of spectra using the 1000–1200 cm−1 spectral range. | ||
Visual inspection of cell size showed that cells ranged in diameter from 15 to 20 μm, with Het-1A spheroid cells being on average larger. Observation of spectra from individual cells also showed that absorption bands from spheroid cells tended to be more intense throughout the spectral range. Such variance raised the possibility that cell size itself might be responsible for the observed differences in absorption. To account for size variation, the second derivative traces of the absorption spectra were corrected by normalizing them to the peak amplitude of the Amide II band before running the hierarchical clustering algorithm. The result of a classification in two clusters is displayed in Fig. 1B, clearly showing a lack of differentiation between the two cell populations. Increasing the number of clusters to three allowed further discrimination between the two populations, with two clusters accounting for most of the Het-1A cells and one cluster accounting for most of the Het-1A spheroid cells (Fig. 1C). Restricting the spectral range used for spectral classification to the 1000–1200 cm−1 interval provided further improvement in discrimination (Fig. 1D), resulting in 108 Het-1A cells (92%) being assigned to clusters 1 and 2, and 124 Het-1A spheroid cells (97%) being assigned to cluster 3. In this case, the use of cells from different batches had no effect on the classification.
Fig. 2 shows the average second derivative spectra for each cluster in Fig. 1D, after normalization to the Amide II band. The most obvious difference between the average spectra of Het-1A and Het-1A spheroid cells was the intensity of bands at 1083 cm−1 and 1052 cm−1, plus changes in weaker bands at 1217 cm−1, 1240 cm−1, 1451 cm−1 and 1396 cm−1.
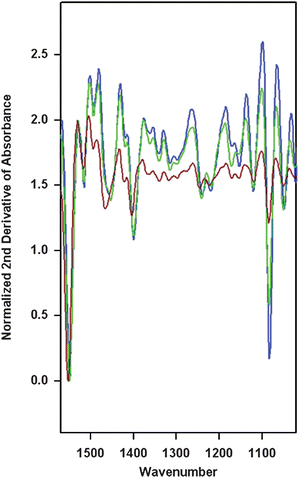 | ||
| Fig. 2 Average second derivative spectra for each cluster in Fig. 1D. Spectra are color coded to the cluster, with brown corresponding to the Het-1A spheroid cluster, and green and blue to the Het-1A clusters. Spectra were normalized to the Amide II band and clustering was based on the 1000–1200 cm−1 spectral range. | ||
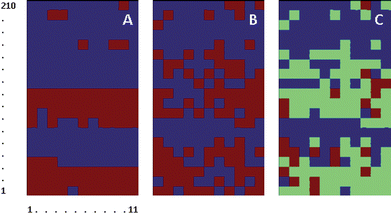 | ||
| Fig. 3 Clustering of OE33 (numbers 1 to 170) and OE33 spheroid cells (numbers 171 to 220) into two clusters. Cells 1–36 were removed from culture as one batch. Cells 37–77 were removed from the same culture about eight hours later. Cells 78–122 were removed from a different culture on a separate day, while cells 123–170 were removed from this same culture about eight hours later. A, Clustering of second derivative traces of cell spectra using the 1320–1020 cm−1 spectral range. B, Clustering of second derivative traces of spectra after normalization to the Amide II band spectra using the 1320–1020 cm−1 spectral range. C, Clustering of second derivative traces of spectra using the 1000–1200 cm−1 spectral range. | ||
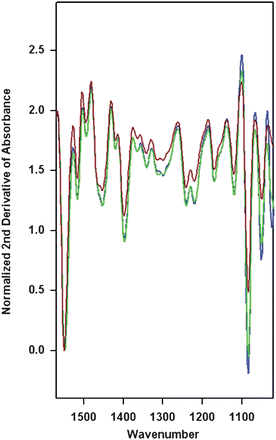 | ||
| Fig. 4 Average second derivative spectra for each cluster in Fig. 3C. Spectra are color coded to the cluster, with brown corresponding to the OE33 spheroid cluster, and green and blue to the OE33 clusters. Spectra were normalized to the Amide II band and clustering was based on the 1000–1200 cm−1 spectral range. | ||
Overall these measurements indicate that in the case of the OE33 cell line, differences between parent and spheroid derived cells are minor when compared to differences between cell batches.
Two batches of Het-1A cells were used, all from the same culture, followed by four batches of OE33 cells, two each from two different cultures. This distribution of elements in the array ensured that any effect on clustering due to differences between batches of the same cell line was immediately evident. Pixels 1 to 51 and 52 to 118 correspond to two batches of Het-1A cells extracted from the same culture with an 8 h interval. Pixels 119 to 154 and 155 to 202 correspond to two batches of OE33 cells extracted from the same culture with an 8 h interval. Pixels 203 to 239 and 240 to 280 correspond to two more batches of OE33 cells extracted from a new culture with an 8 h interval.
The number of clusters was progressively increased. A classification into two clusters (Fig. 5A) could not discriminate between Het-1A cells from different batches, 117 of which clustered together (99%). In contrast OE33 cells were assigned to two different clusters, based on the timing of cell harvesting from culture. Overall, 67 of the 73 OE33 cells (92%) harvested from culture early during the day clustered together, and 86 of the 89 cells (97%) harvested from culture later during the day clustered together. The latter are also clustered together with the Het-1A cells. Increasing the number of clusters to three effectively discriminated between one cluster mostly composed of Het-1A cells (75% of total) and the two clusters mostly composed of OE33 cells (94% of total). The two clusters of OE33 cells corresponded to cells harvested from culture early during the day (92%) and cells harvested from culture later during the day (74%).
 | ||
| Fig. 5 Clustering of Het-1A (numbers 1 to 118) and OE33 cells (numbers 119 to 280). Cells 1 to 51 and 52 to 118 correspond to two batches of Het-1A cells extracted from the same culture with an 8 h interval. Cells 119 to 154 and 155 to 202 correspond to two batches of OE33 cells extracted from the same culture with an 8 h interval. Cells 203 to 239 and 240 to 280 correspond to two more batches of OE33 cells extracted from a new culture with an 8 h interval. A & B, Clustering of second derivative traces of cell spectra using the 1320–1020 cm−1 spectral range. C & D clustering of second derivative traces of spectra after normalization to the Amide II band and using the 1000–1200 cm−1 spectral range. | ||
Normalization of the second derivative traces to the Amide II band was performed to test the effect of variations of cell size in the possibility of discriminating between the two cell lines. Fig. 5C and Fig. 5D, show the corresponding classification into two and three clusters of second derivative traces after normalization. Although Het-1A cells still formed a compact cluster (83% of Het-1A cells), discrimination between Het-1A cells and some of the OE33 batches was no longer possible. Increasing the number of clusters did not improve discrimination (images not shown).
Overall, spectral differences between the two cell lines appeared to be dominated by size differences, and by the sensitivity of OE33 spectra to the timing of cell harvest.
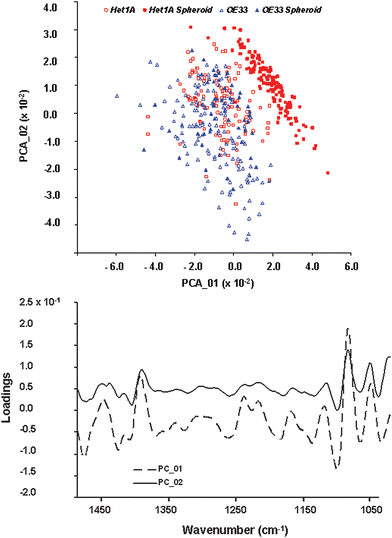 | ||
| Fig. 6 Principal component analysis of Het-1A, OE33 and derived spheroid cells. A, Plot of spectral distribution as function of the first two principal components, PCA_01 and PCA_02. B, Loadings plot for PCA_01 and PCA_02 over the spectral range 1000–1450 cm−1. | ||
The similarity between OE33 and OE33 spheroids is also confirmed, with both phenotypes clustering in a similar region. Interestingly, OE33 spheroids aggregate in a compact region which is a subspace of the one occupied by the parent cell line.
The loading plots, shown in Fig. 6B for the 1000 cm−1 −1500 cm−1 spectral region, indicate clearly that a major contribution to spectral variability is due to bands at approximately 1050 cm−1 and 1080 cm−1. Additional contributions are observed at approximately 1220 cm−1, 1240 cm−1, 1395 cm−1 and 1450 cm−1, also in agreement with the results of HCA.
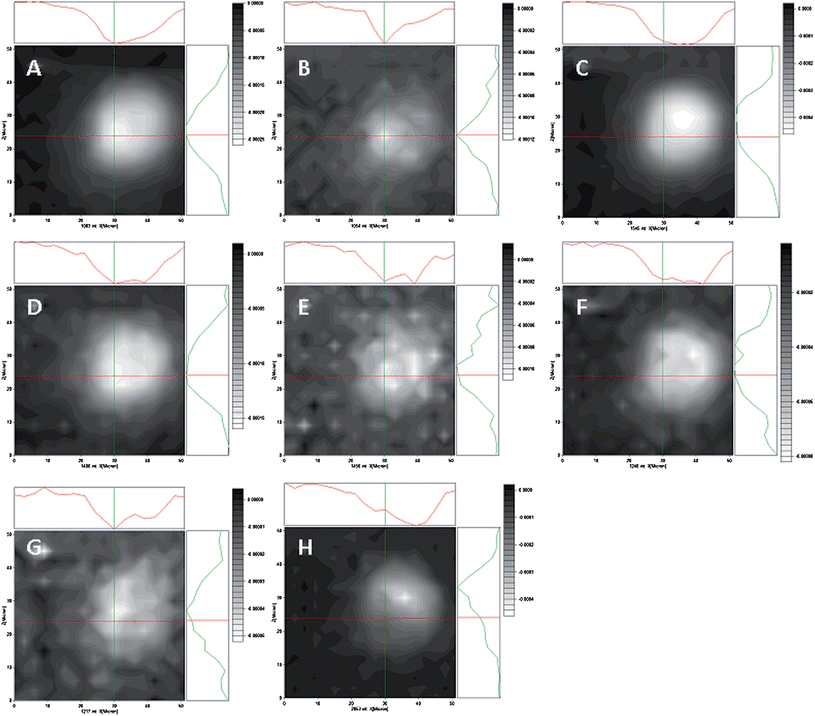 | ||
| Fig. 7 Diffraction limited IR maps of a Het-1A cell in normal saline, obtained by plotting the amplitude of the second derivative peak over the cell. White corresponds to higher absorption and black to no absorption. Each map is accompanied by amplitude profiles in the X and Y directions, following the cross sections delimited by the cross hairs. The cross hairs are centered at the minimum position of map B, the putative position for the cell nucleus. A, 1083 cm−1; B, 1054 cm−1; C, 1545 cm−1; D, 1400 cm−1; E, 1456 cm−1; F, 1240 cm−1; G, 1217 cm−1; H, 2853 cm−1. | ||
Fig. 7B shows the distribution of absorbance at 1054 cm−1. This band has been assigned to the symmetric stretching mode from the phosphodiester backbone of DNA.33–36 The band maximized in a position corresponding to a single pixel, as expected from the localization of DNA in the cell nucleus. The apparent residual distribution with low amplitude throughout the cell likely was due to a contribution from the overlapping band at 1083 cm−1 and to the fact that the diffraction-limited spatial resolution of the measurement is expected to be around 5 μm at these wavelengths.
The band at 1083 cm−1 is generally assigned to the symmetric stretching mode from the phosphodiester backbone of nucleic acids.33,36 However, it has also been noted that proteins display non-negligible absorption in this region. The band was distributed throughout the cell with high intensity (Fig. 7A), although it was stronger in the position where the 1054 cm−1 band was maximal.
The band at 1217 cm−1 (Fig. 7G) is assigned to the antisymmetric stretching vibration of phosphate in phosphodiesters.33–35 The band was concentrated in the same limited region as the 1054 cm−1 band, supporting its assignment to the vibration of the DNA backbone.
The band at 1240 cm−1 (Fig. 7F) is also assigned to the antisymmetric stretching vibration of phosphate in phosphodiesters.33 Its frequency matched the values reported for RNA, phospholipid and ATP absorption bands.33–36 The different distribution of this band relative to the symmetric stretch of DNA confirmed that this is not a DNA vibration.
Absorption at 1545 cm−1 (Fig. 7C) is assigned to the Amide II mode of the amide backbone of proteins.33 The bands at 1400 cm−1, 1456 cm−1 are generally assigned to the bending modes of methyl and methylene groups of a variety of biomolecules, including lipids, amino acid side chains and polysaccharides.33
Finally, absorption at 2853 cm−1 (Fig. 7H) corresponds to the distribution of the symmetric stretching of methylene groups, mostly from the acyl chains of phospholipids.33 The main cellular elements contributing to this band are the membrane folds and stacks that permeate the cytoplasm and organelles outside of the nucleus, including the endoplasmic reticulum, the Golgi, the mitochondria. This band typically has lowest absorption in the position of the nucleus.32 Observation of this position within the cell map supports the assignment of the nuclear position as the location of maximum absorption at 1054 cm−1.
Discussion
In these exploratory studies, we evaluated the potential of synchrotron mid-FTIR spectromicroscopy to characterize cancer stem-like cells derived from a transformed normal esophageal cell line (Het-1A) and from an EADC cell line (OE33). Sphere culture was used to enrich CSC populations in each esophageal cell line, which were confirmed in vitro to have higher clonogenecity compared to each parent cell line (data not shown).There has been considerable recent interest in exploring the potential of FTIR or Raman spectromicroscopy to identify CSC populations in human malignancy.27,37,38 In particular, the work by Martin et al. indicated the possibility of using the infrared absorption band of the symmetric –PO2 stretching mode at 1080 cm−1, which they assigned to DNA, as a specific marker of a CSC.27 These authors based this conclusion on the observation of a higher contribution of this band in the spectra of cells from the putative CSC niche within gastrointestinal crypts, and confirming this via principal component analysis-linear discriminant analysis – PCA-LDA. The authors interpreted the difference in the frequency of peak absorption in these samples, and samples of purified DNA, as differences in the conformation of DNA within CSCs relative to other cells. Similarly, Li and coworkers related differences between human embryonic stem cells (HESC) and their cardiac derivatives to a varying contribution of Raman bands from DNA.37
Our experiments constitute the first body of work that uses synchrotron FTIR spectromicroscopy to characterize live cancer stem-like cell populations in an aqueous environment. Previous experiments have all used preserved tissue samples, and identified putative CSC populations by reporting differences in spectral properties in regions of the sample where stem cells were expected to be localized. Our work confirms the potential in the identification of stem-like populations in vitro by utilizing aqueous samples of live cells. The use of aqueous samples is a necessary step for the development of experimental protocols akin to flow cytometry for the rapid screening and classification of cell populations. In addition, it allows the characterization of cell populations under experimental conditions that are physiologically significant, providing a wealth of information about cell biochemistry.
The measurement of FTIR spectra of biological systems in aqueous solution is generally problematic because of absorption from the bending mode of water at 1642 cm−1, which overlaps with the Amide I band from proteins. At the very least, this overlap prevents the use of the Amide I band for quantitative evaluation.39 For sample thickness higher than 15 μm, this spectral region becomes of little use because of limited light throughput and deteriorating signal-to-noise levels. For thicker samples water absorption saturates the Amide I region and may also interfere with the Amide II band. In our experiments, the use of an optical path length slightly longer than average cell diameter and of aperture settings comparable to cell size reduces the contribution of water absorption and prevents saturation in the amide region.39 Furthermore, the procedure of normalizing the Amide II band, which is about 100 cm−1 downshifted from the water absorption peak, and working on second derivatives, which are sharper and better resolved, allows limiting to effect of water on normalized band intensity to less than 5%. This is much less than the intensity differences which are responsible for discrimination between the Het-1A spheroids and their parent cell line.
We have shown that cell size constitutes a discriminating factor in FTIR spectra. Increased cell diameter corresponds to a longer optical path through the cell and increased absorbance from all cellular components. Although this contribution increases the effectiveness of the discrimination, it also decreases the potential diagnostic accuracy based on measurement of infrared absorption, as discrimination based on cell size can readily be performed using standard light microscopy. We therefore consider it important to reduce or eliminate spectral differences solely due to cell size, so as to enhance spectral differences due to relative changes in composition. Spectral normalization to the Amide II band satisfactorily achieves this goal. By normalizing to the Amide II band, cell to cell variations are expressed as changes in the cellular content of biomolecules relative to the protein content. Furthermore, changes in cell size, as well as in protein and nucleic acid concentration, accompany evolution through the cell cycle. Therefore, normalization has the additional advantage of reducing, although not cancelling, the effect of cell cycle variations on the capability of the technique to discriminate between cells types.
In agreement with the results of Li et al., and Martin et al.,27,37 our work confirms that the intensity of vibrational modes in the 1000–1200 cm−1 region is a major discriminating factor that has the ability to differentiate between stem-like cells from Het-1A (i.e. spheroids) and parent Het-1A cells. Use of a wider spectral range for clustering results in poorer discrimination. However, in contrast to previous reports, the use of spectral normalization shows that the characteristic feature of cancer stem-like cells is not an increase in absorption in this spectral range. Comparison of normalized spectra shows that bands at 1083 cm−1 and 1054 cm−1 decrease in intensity by about 70% in Het-1A spheroid cells, whereas other bands at 1217 cm−1, 1240 cm−1, 1456 cm−1 and 1396 cm−1, also show a decrease in intensity in spheroid cells.
A strong and sharp absorption at 1052–1054 cm−1 has been reported by several authors in the spectra of DNA recorded under various conditions.34–36 No bands in this position have been reported for RNA, for which the nearest strong absorption lies at 1063–1065 cm−1,34,35 as a shoulder to a stronger absorption band at lower frequency. This band appears to be concentrated in a diffraction-limited spot of the map of the Het-1A cell, about 5 μm across, presumably the nucleus, supporting its assignment to DNA, as opposed to RNA or other species. In contrast, assignment of the band at 1083 cm−1 is not univocal because both DNA and RNA have their strongest absorption bands between 1080 cm−1 and 1090 cm−1,34,35 and proteins and phospholipids also contribute to this spectral region.36,40 Comparison with reference spectra, showing the relative intensity of the absorptions of DNA solutions at 1088 cm−1 and 1052 cm−1,34,35 suggests that in Het-1A and Het-1A spheroid spectra DNA provides a major contribution at 1083 cm−1, but not the only one. Distribution of the 1083 cm−1 band throughout a Het-1A cell confirms the presence of multiple contributions distributed throughout the cytoplasm, as well as a major contribution in the putative nuclear position.
Both RNA and phospholipids have a strong absorption band at approximately 1240 cm−1.35 Although a band is observed at this frequency, its cellular distribution is markedly different from that of the 1054 cm−1 and 1083 cm−1 bands, with its maximum localized away from the putative nuclear position, and similar to the distribution of the 2853 cm−1 absorption, suggesting that phospholipids might provide the dominant contribution to this band.
Martin et al. have reported a strong absorption band at 1080 cm−1 in the spectra of putative stem cell populations. The authors assigned the band to the PO2 symmetric stretching mode of the DNA backbone and have promoted it as a useful marker to identify stem cell populations in intestinal epithelia27 and proposed that band position and intensity could relate to the specific conformation of the DNA helix in stem cells. Our work confirms that variations in the intensity of absorption at 1083 cm−1 are unique to spheroid cells derived from Het-1A, further supporting this notion. In addition we also identified an absorption band at 1054 cm−1. However, in contrast to the observations by Martin et al.,27 these marker bands appear to be diminished in stem-like cells. Furthermore, the subcellular distribution would suggest that the assignment of the absorption band at ∼1080 cm−1 to a DNA vibration only is oversimplified, as already suggested by Freyer et al.,36 reflecting contributions from RNA, protein, carbohydrate and lipid absorption in this region. This group noted that the cellular content of both protein and nucleic acids changes over the cell cycle, and that absorption at 1080 cm−1 is affected by both changes. In addition, phosphate headgroups in phospholipids also provide absorption bands both in this spectral region and in the 1240 cm−1 region, and can potentially contribute to the observed differences between cell populations. It has been reported that the metabolism of phospholipids is different in spheroids derived from Rat1 cells and their parent cells, resulting in a different accumulation of phospholipid precursors (phosphorylcholine and phosphorylethanolamine) and degradation products (glycerophosphorylcholine and glycerophosphorylethanolamine).40 The differences relate to the size of the spheroid and, in turn, to the different distribution of cells through the various stages of their life cycle. Indeed, the cellular distribution of absorption at 1240 cm−1 (Fig. 7F) shows an overlap with the distribution of absorption at 2853 cm−1 (Fig. 7H), arising from the acyl chains of phospholipids. This coincidence is not as obvious when considering distribution of the band at 1080 cm−1, due to the overlapping contribution from other components.
We found that absorption bands at 1054 cm−1 and 1083 cm−1 appear much less discriminating when used to compare OE33 spheroids and the parent OE33 cells. With changes in intensity of the order of 10–15%, such variation is comparable to that observed between cells harvested from culture a few hours apart. Overall, the chemical composition of OE33 cells and OE33 spheroid cells, as ascertained by absorption in the mid infrared region, appears to be similar. This is in contrast to Het-1A cells, which appear to be easily discriminated from their derived spheroids, with little effect due to sample aging over the measurement. As cell harvesting from culture for IR experiments was performed at the same time for both cell lines suggests that this is due to differences in the properties of the two cell populations.
It is notable that this work reaches different conclusions on the detailed spectroscopic changes that are characteristic of stem-like cell populations and their molecular interpretation when compared to the work by Martin et al.27 Several factors can account for these differences, the most relevant one being the identification of the putative stem cell population. In our work we study definite phenotypes of well characterized cell lines with properties that reproduce those expected of stem cell populations. In contrast, Martin et al. describe a region of intestinal crypt sections which is expected to harbor stem cells. In addition, differences in sample state and preservation are also relevant. We have worked on single live cells in an aqueous environment, whereas Martin et al. report experiments on tissue sections that were previously fixed and paraffin-embedded, and de-waxed for measurement.
Conclusions
We have tested the application of synchrotron FTIR spectromicroscopy to identify cell populations with stem cell-like properties derived from two esophageal cell lines, Het-1A and OE33. We have shown that this can be successfully performed for Het-1A, leading to the identification of specific spectral features that allow discrimination. We have demonstrated that a subpopulation of Het-1A cells, derived from a spheroid cluster, can be easily differentiated by this approach. By comparison, such differentiation was much less effective in the OE33 EADC tumor cell line.The intensity of bands in the 1000–1200 cm−1 spectral region was also shown to be critical in discriminating the Het-1A cell population with cancer stem-like properties. Mapping the subcellular distribution of these bands indicated composite absorptions from several cellular components; absorption from nucleic acids is a major contributor to the 1000–1200 cm−1 spectral region but not the only one. A major contribution from phospholipids also needs to be taken into account. We have also shown the limitations implicit in the use of these absorption bands as specific markers for stem-like cell populations. As these bands arise from a multitude of cellular components, their presence cannot be used as a univocal specific marker using this approach. Rather, it is the change in absorption pattern of all bands relative to a reference cell population in a specific state that acts as a multivariate discriminator. Finally, we have highlighted that cell size is a major factor to be accounted for when using FTIR absorption for automated cellular classification, in addition to controlling for the stage of cell growth in culture.
Acknowledgements
This work was supported by a grant to A. G. C. from the Saskatchewan Health Research Foundation. The research described in this paper was performed at the Canadian Light Source, which is supported by NSERC, NRC, CIHR, and the University of Saskatchewan.References
- J. C. Y. Wang and J. E. Dick, Trends Cell Biol., 2005, 15, 494–501 CrossRef CAS.
- M. Brittan and N. A. Wright, Gut, 2004, 53, 899–910 CrossRef CAS.
- S. J. Leedham, M. Brittan, S. A. C. McDonald and N. A. Wright, J. Cell. Mol. Med., 2005, 9, 11–24 CrossRef CAS.
- N. Haraguchi, H. Inoue, F. Tanaka, K. Mimori, T. Utsunomiya, A. Sasaki and M. Mori, Human Cell, 2006, 19, 24–29 CrossRef.
- G. B. Adams, R. P. Martin, I. R. Alley, K. T. Chabner, K. S. Cohen, L. M. Calvi, H. M. Kronenberg and D. T. Scadden, Nat. Biotechnol., 2007, 25, 238–243 CrossRef CAS.
- G. B. Adams, R. P. Martin, I. R. Alley, K. T. Chabner, K. S. Cohen, L. M. Calvi, H. M. Kronenberg and D. T. Scadden, Nat. Biotechnol., 2007, 25, 944–944 CrossRef CAS.
- G.-M. Zou, J. Cell. Physiol., 2008, 217, 598–604 CrossRef CAS.
- G. B. Adams, R. P. Martin, I. R. Alley, K. T. Chabner, K. S. Cohen, L. M. Calvi, H. M. Kronenberg and D. T. Scadden, Nat. Biotechnol., 2008, 26, 241–241 CrossRef CAS.
- I. Klimanskaya, N. Rosenthal and R. Lanza, Nat. Rev. Drug Discovery, 2008, 7, 131–142 CrossRef CAS.
- P. Dalerba and M. F. Clarke, Cell Stem Cell, 2007, 1, 241–242 CrossRef CAS.
- N. A. Lobo, Y. Shimono, D. Qian and M. F. Clarke, Annu. Rev. Cell Dev. Biol., 2007, 23, 675–699 CrossRef CAS.
- W. A. Woodward and E. P. Sulman, Cancer Metastasis Rev., 2008, 27, 459–470 CrossRef CAS.
- L. E. Ailles and I. L. Weissman, Curr. Opin. Biotechnol., 2007, 18, 460–466 CrossRef CAS.
- T. McClanahan, S. Koseoglu, K. Smith, J. Grein, E. Gustafson, S. Black, P. Kirschmeier and A. A. Samatar, Cancer Biol. Ther., 2006, 5, 419–426 Search PubMed.
- N. Barker, J. H. van Es, J. Kuipers, P. Kujala, M. van den Born, M. Cozijnsen, A. Haegebarth, J. Korving, H. Begthel, P. J. Peters and H. Clevers, Nature, 2007, 449, 1003–1007 CrossRef CAS.
- L. Ricci-Vitiani, D. G. Lombardi, E. Pilozzi, M. Biffoni, M. Todaro, C. Peschle and R. De Maria, Nature, 2007, 445, 111–115 CrossRef CAS.
- J.-k. Du, J.-s. Shi, Y.-z. Xu, Y.-f. Zhang, X.-j. Sun, J.-s. Wang, S.-f. Weng and J.-g. Wu, Guangpuxue Yu Guangpu Fenxi, 2008, 28, 51–54 CAS.
- M. Pera, C. Manterola, O. Vidal and L. Grande, J. Surg. Oncol., 2005, 92, 151–159 CrossRef.
- L. M. Brown, S. S. Devesa and W.-H. Chow, J. Natl. Cancer Inst., 2008, 100, 1184–1187 CrossRef.
- E. L. Bird-Lieberman and R. C. Fitzgerald, Gastroenterology Clinics of North America, 2008, 37, 921–942 Search PubMed.
- L. B. Koppert, B. P. L. Wijnhoven, H. v. Dekken, H. W. Tilanus and W. N. M. Dinjens, J. Surg. Oncol., 2005, 92, 169–190 CrossRef CAS.
- R. C. Fitzgerald, Gut, 2006, 55, 1810–1820 CrossRef CAS.
- C. Krafft and V. Sergo, Spectroscopy (Amsterdam, Neth.), 2006, 20, 195–218 Search PubMed.
- C. Kendall, M. Isabelle, F. Bazant-Hegemark, J. Hutchings, L. Orr, J. Babrah, R. Baker and N. Stone, Analyst, 2009, 134, 1029–1045 RSC.
- L. Quaroni and A. G. Casson, Analyst, 2009, 134, 1240–1246 RSC.
- D. Croagh, W. A. Phillips, R. Redvers, R. J. S. Thomas and P. Kaur, Stem Cells, 2007, 25, 313–318 Search PubMed.
- M. J. Walsh, T. G. Fellous, A. Hamiche, W.-R. Lin, N. J. Fullwood, O. Grude, F. Bahrami, J. M. Nicholson, M. Cotte, J. Susini, H. M. Pollock, M. Brittan, P. L. Martin-Hirsch, M. R. Alison and F. L. Martin, Stem Cells, 2008, 26, 108–118 Search PubMed.
- S. J. Leedham and N. A. Wright, J. Clin. Pathol., 2008, 61, 164–171 CAS.
- G. D. Stoner, M. E. Kaighn, R. R. Reddel, J. H. Resau, D. Bowman, Z. Naito, N. Matsukura, M. You, A. J. Galati and C. C. Harris, Cancer Res., 1991, 51, 365–371 CAS.
- J. C. Rockett, K. Larkin, S. J. Darnton, A. G. Morris and H. R. Matthews, Br. J. Cancer, 1997, 75, 258–263 CAS.
- S. Verrier, I. Notingher, J. M. Polak and L. L. Hench, Biopolymers, 2004, 74, 157–162 CrossRef CAS.
- N. Jamin, P. Dumas, J. Moncuit, W.-H. Fridman, J.-L. Teillaud, G. L. Carr and G. P. Williams, Proc. Natl. Acad. Sci. U. S. A., 1998, 95, 4837–4840 CrossRef CAS.
- Z. Movasaghi, S. Rehman and I. u. Rehman, Appl. Spectrosc. Rev., 2008, 43, 134–179 CrossRef CAS.
- A. A. Ouameur, H. Malonga, J. F. Neault, S. Diamantoglou and H. A. Tajmir-Riahi, Can. J. Chem., 2004, 82, 1112–1118 CrossRef CAS.
- H. A. Tajmir-Riahi, C. N. N'Soukpoe-Kossi and D. Joly, Spectroscopy (Amsterdam, Neth.), 2009, 23, 81–101 Search PubMed.
- J. R. Mourant, Y. R. Yamada, S. Carpenter, L. R. Dominique and J. P. Freyer, Biophys. J., 2003, 85, 1938–1947 CAS.
- J. W. Chan, D. K. Lieu, T. Huser and R. A. Li, Anal. Chem., 2009, 81, 1324–1331 CrossRef CAS.
- A. J. Bentley, T. Nakamura, A. Hammiche, H. M. Pollock, F. L. Martin, S. Kinoshita and N. J. Fullwood, Mol. Vision, 2007, 13, 237–242 Search PubMed.
- J. R. Mourant, R. R. Gibson, T. M. Johnson, S. Carpenter, K. W. Short, Y. Yamada, R. and J. P. Freyer, Phys. Med. Biol., 2003, 48, 243–257 CrossRef.
- L. A. Kunz-Schughart and J. P. Freyer, Am. J. Physiol., 2002, 283, C1287–C1297 CAS.
Footnote |
| † Electronic supplementary information (ESI) available: Stability of the spectrum of individual Het-1A cells. See DOI: 10.1039/b914311d |
| This journal is © The Royal Society of Chemistry 2010 |