DOI:
10.1039/B911040B
(Paper)
Analyst, 2010,
135, 80-85
Received
4th June 2009
, Accepted 18th November 2009
First published on
27th November 2009
Abstract
A method for analysing plastic samples without any sample pretreatment using direct analysis in real time mass spectrometry (DART-MS) was developed. DART-MS allows the direct, simple and rapid identification of polymer additives in plastic products. To demonstrate the suitability of DART-MS for the detection of a wide range of commonly employed stabilising agents, a test set of 21 stabilisers was selected. In a first step standard solutions of these stabilisers in toluene as well as toluene-extracts from polymer samples were analysed. Subsequently, to prove the applicability of the developed DART-MS method also for the direct analysis of plastic products, samples of polypropylene containing a range of stabilisers were prepared using a lab-scale compounder. Polymer samples were cut into 0.5 cm wide pieces and directly placed into the DART ion source. Focusing on the DART ionisation, several parameters like discharge needle potential, potential of the grid electrode and the discharge electrode, the heater temperature and the gas flow had to be varied to guarantee optimum results. Both positive and negative ionisation was tested, whereby the positive ion mode led to higher signal intensities for all analytes. Determination of accurate masses to improve the certainty in signal assignment could be achieved by using PEG 600 as an internal standard for mass calibration. The developed method allowed the detection of all selected additives (including some of their degradation products) in real polymer samples.
1 Introduction
Over the last decades the importance of polyolefins has constantly increased. This is due to their excellent material properties and their interesting cost-performance ratio. However, as the structure of polypropylene includes tertiary carbon atoms, stabilisation is needed to avoid degradation by oxidation.1–3 The oxidative decomposition is initialised by radicals, which are generated by homolytic cleavage of bonds either thermally or photolytically induced. Such degradation decreases the mechanical stability of the polyolefins and leads to unfavorable changes in the appearance of the material (yellowing) due to an increasing amount of higher oxidation state chromophores. To avoid or at least inhibit these reactions, stabilisers are added before the compounding procedure. These stabilisers react with the radicals thereby protecting the polymer chain from degradation. Various different types of substances fulfilling the requirements for an efficient stabiliser exist. In some cases the exact mode of action of these stabilising agents has not yet been fully elucidated, therefore these compounds are not classified according to the reaction mechanism involved (e.g. oxidation inhibitor, UV-absorber) but to their structure or functional groups. The most prominent structures found in such stabilisers are: phenols (including the Irganox types 1330, 1010, MD 1024, 3114, 1076, E201, PS 800, PS 802, 1035 and 1081), hydroxy phenyl benzotriazole derivates (including Tinuvin 234, 326, 327 and 328), hydroxy benzophenone (including Chimassorb 81), lactone (including HP 136), hindered amines (so called hindered amine light stabilisers (HALS), including Tinuvin 770), and phosphite, phosphonite or thioether groups (including the Irgafos types (38, 126 and 168) and PEP 36). In most cases more than one type of stabiliser is necessary to protect the polypropylene chain; therefore so called blends (a mixture of stabilisers) are employed. As both the type of stabiliser used as well as its concentration in the polymer material are of crucial importance for the quality and performance of the product, qualitative and quantitative analysis of polymer additives in bulk plastic materials and also in the final product is an important issue. Most analytical methods reported so far require previous extraction of the additives from the polymer material. Widely used sample preparation techniques for this purpose are liquid extraction4 with various solvents (such as toluene, dichloromethane and decalin), Soxhlet extraction,5–7 extraction processes employing autoclaves8 or microwave digestion units,9 supercritical fluid extraction10 or accelerated solvent extraction.11,12 A common drawback of all these methods is the fact that they are not straightforward, laborious and time consuming. Subsequent analysis of the extract has been performed by thin layer chromatography,13,14 high performance liquid chromatography6,15–17 and supercritical fluid chromatography10 coupled with UV detection or mass spectrometric detection. Some more volatile additives can be determined by gas chromatography whereby direct analysis of the polymer without previous extraction procedures is possible17 if a pyrolysis unit is used. In addition to these (mostly) multi-step approaches based on chromatography, spectroscopic techniques allowing the straightforward analysis of plastic materials exist. Nevertheless the possibilities of infrared (IR) spectroscopy and UV spectroscopy are limited due to insufficient selectivity and sensitivity.13 Up to now only a very few papers have reported the direct analysis of polymer additives in plastic samples using MALDI-MS,18–20 TOF-SIMS21 or laser MS.22
Direct analysis in real time mass spectrometry (DART-MS) is an interesting approach for the rapid and straightforward investigation of a variety of samples, ranging from the analysis of illicit substances in trace amounts on dollar bills, the detection of counterfeit drugs to counter-terrorism applications such as explosives on clothes or shoes.23 The DART ionisation is based on the interactions of long-lived electronic or vibronic excited-state atoms or molecules with the sample and the atmospheric gases. Several ionisation mechanisms are possible depending on the polarity and the reaction gas, the proton affinity and the ionisation potential of the analyte, as well as the presence of additives or dopants.23 In this paper we report the use of DART-MS for the detection of additives in extracts of plastic samples and in solid polymer samples without any previous sample pretreatment.
2 Experimental
Instrumentation
All measurements were performed with a DART ion source from IonSense, Inc. (Saugus, MA, USA) coupled to a JMS T100 (AccuTOF-LC-plus) time-of-flight mass spectrometer (JEOL Ltd, Tokyo, Japan). The following voltages were applied: orifice 1, 10 V; orifice 2, 5 V; ring electrode, 10 V; ion guide potential, 800 V. Orifice 1 was operated at a temperature of 80 °C. Data acquisition was performed in a range from 60 to 800 m/z for all analytes except Irganox 1010 (60 to 1250 m/z). For the DART ion source helium gas was used for analysis and nitrogen gas in the standby mode. Helium (4.6) was from Linde Gas GmbH (Stadl-Paura, Austria).
Tuning of the DART was performed by positioning the ceramic tube (4 mm I.D.) of the DART orifice and the MS orifice in a way that the highest signal intensity for water-clusters (m/z 37.0289) was obtained. Mass scale calibration was carried out by placing a glass rod previously dipped into a polyethylene glycol solution (50 μL of PEG 600 dissolved in 10 mL methanol–dichloromethane (50![[thin space (1/6-em)]](https://www.rsc.org/images/entities/char_2009.gif) :
:![[thin space (1/6-em)]](https://www.rsc.org/images/entities/char_2009.gif) 50; v/v)) into the DART source. To improve mass accuracy alternating measurements of the sample and PEG 600 solution (used for internal mass calibration) were performed. Dip-IT glass rods for introducing liquid samples into the DART source (IonSense, Inc., Saugus, MA, USA) were employed throughout this work. An in-lab modified holder was used to obtain reproducible positioning of the glass rods. For measuring solid samples like the plastic platelets (0.5 × 0.5 cm) a self-made holder with a small metal cramp was employed. Polymer samples containing different stabilisers were prepared on a MiniLab II Haake Rheomex CTW5 lab-scale compounder from Thermo Scientific (Karlsruhe, Germany).
50; v/v)) into the DART source. To improve mass accuracy alternating measurements of the sample and PEG 600 solution (used for internal mass calibration) were performed. Dip-IT glass rods for introducing liquid samples into the DART source (IonSense, Inc., Saugus, MA, USA) were employed throughout this work. An in-lab modified holder was used to obtain reproducible positioning of the glass rods. For measuring solid samples like the plastic platelets (0.5 × 0.5 cm) a self-made holder with a small metal cramp was employed. Polymer samples containing different stabilisers were prepared on a MiniLab II Haake Rheomex CTW5 lab-scale compounder from Thermo Scientific (Karlsruhe, Germany).
Materials, reagents, standard solutions and polymer extracts
All stabilisers were from Ciba (Basel, Switzerland), except PEP 36, which was from ADEKA (Strasbourg, France). The unstabilised polypropylene was obtained from Borealis Group (Linz, Austria). Stock solutions of polymer additives were prepared by dissolving 25 mg of the stabiliser in 50 mL of toluene (from JT Baker, Deventer, Holland). Stock solutions were diluted to the final working concentrations using toluene, xylene or methanol (all from JT Baker, Deventer, Holland). Polymer extracts were prepared by placing 500 mg of polymer pellets into 50 g of toluene, which was refluxed for 40 min.
Subsequently 5 g of MeOH were added to precipitate the polymer fraction. 1 mL of the extract was evaporated to dryness and re-dissolved using acetonitrile (JT Baker, Deventer, Holland).
Preparation of polymer samples
Stabilised polymer samples were prepared by using a lab-scale compounder. To 5 g of an unstabilised polypropylene powder 10 mg of each additive were added and filled into the extruder. The compounding procedure was performed at 190, 250 and 300 °C respectively with a cycle time of 5 min and an extruder screw speed of 60 rpm.
3 Results and discussion
Analysis of standard solutions and extracts
In a first step, a test set of 21 commonly employed stabilisers was defined (chemical structures depicted in Fig. 1–3) and standard solutions for each compound were prepared. These solutions were subsequently employed for the optimisation of DART parameters. A Dip-IT glass rod was dipped into the sample solution and subsequently positioned in the helium gas stream of the DART for acquisition of mass spectra. The following parameters were investigated: temperature of the gas heater on the ceramic tube: 50–450 °C (in 50 °C steps); the helium gas flow: 1.5–5.5 L min−1 (in 0.5 L min−1 steps); the needle voltage: 2000–4000 V; the discharge electrode and grid electrode voltages: 50–300 V. The heater temperature and the gas flow rate were the two crucial parameters with respect to the desolvation and the vaporisation of the analyte molecules. Due to the fact that high temperatures may lead to pyrolysis of the sample, the signal intensity decreases upon exceeding a certain temperature. Furthermore, too high gas flow rates also result in a decrease of the signal intensity simply because of physically blowing away the droplets, so the analyte molecules collide with the sprayer shield instead of entering the orifice of the MS. Best results were obtained with the following settings: gas flow rate 2.5 L min−1, needle voltage 3500 V, discharge electrode and grid electrode voltages 100 V and 50 V respectively. The optimum heater temperature varied from 150 °C to 350 °C for the different stabilisers, so that a temperature of 250 °C was chosen as a compromise. Under these conditions most of the analytes were detected as [M − H]− (except Tinuvin 770 where an oxygen adduct [M + O2]− was obtained) in the negative ion mode and as [M + H]+ (except Irganox 1035 and 1330 measured as M·+) using the positive ion mode. Irganox 1010 and 1076 which only have hydroxyl and carbonyl functional groups favored the formation of ammonia adducts and were therefore detected as [M + NH4]+ ions using an elevated heater temperature of 350 °C. As the source of NH4+ cations, ammonia vapour was used; this was carried out by positioning a beaker with ammonia solution directly beneath the DART source. Generally the positive ion mode proved to be better suited for the coverage of a wide range of additives as it allowed the detection of all 21 compounds and in most cases provided better sensitivity with limits of detection below 1 mg L−1 except for Tinuvin 328 (50 mg L−1). A list of the additives together with measured exact masses in the positive and the negative ion mode is provided in Table 1. Mass errors below 11 ppm were obtained for all additives except Irganox 1010 (which was somewhat outside the calibrated mass range due to its higher molecular mass) in the positive ion mode. In the negative ion mode some analytes could not be ionised at all, some did not provide intense signals (a fact leading to less favorable mass errors). For this reason further experiments were only carried out in the positive ion mode. Sensitivity in DART-MS is also affected by properties of the solvent employed like volatility and viscosity. Therefore the stock solutions of the investigated additives were diluted with methanol, toluene or xylene. Sample solvents with low polarity and low volatility like toluene provided good signal intensities, whereas solvents with high polarity and high volatility (like methanol) resulted in rather low signal intensities. Therefore toluene was chosen as solvent for further work. Subsequently, to investigate the suitability of DART for the analysis of real polymer samples, an extract prepared by a procedure developed for HPLC analysis of additives in polypropylene pellets24 (for procedure see experimental section) was analysed using DART. Common concentrations of the additives in such extracts are in the range of 10–30 mg L−1. Samples analysed by this procedure contained Irganox 1010, Irgafos 168 and Irganox 1330, which could be identified in the DART spectrum. Nevertheless, using DART for the analysis of such polymer extracts would not mean a substantial advantage compared with the commonly employed multistep methods based on a rather laborious extraction process followed by (mostly) chromatographic analysis. For this reason the applicability of DART for the detection of additives in solid polymer samples without any sample pretreatment was the major goal of the further investigations.
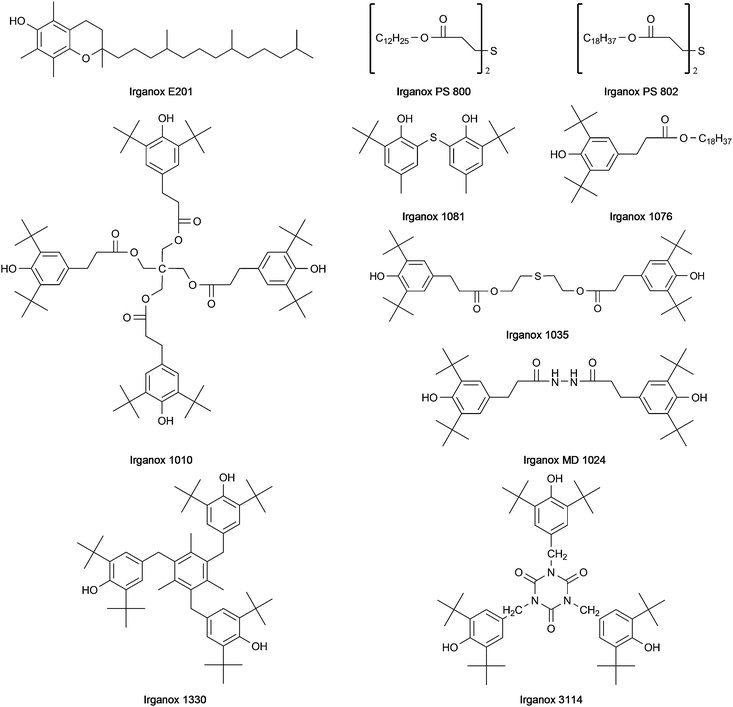 |
| | Fig. 1 Structures of Irganox type stabilisers. | |
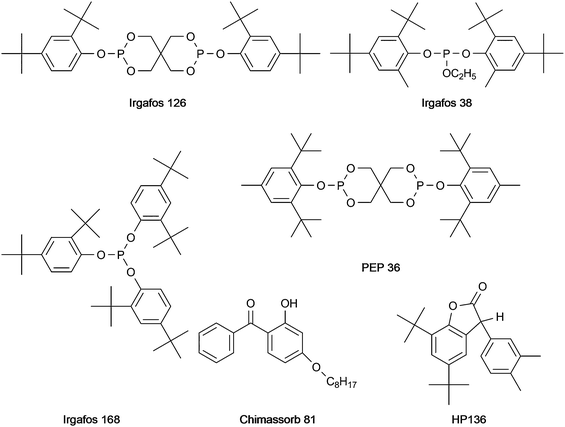 |
| | Fig. 2 Structures of Irgafos type and other stabilisers. | |
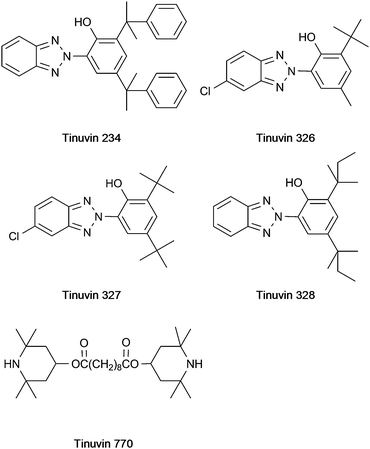 |
| | Fig. 3 Structure of Tinuvin type stabilisers. | |
Table 1 Summary of the DART performance for 21 stabilisers
| Substance |
calculated masses |
measured masses |
Δ/+ |
Δ/− |
| [M + H]+ |
[M − H]− |
DART/+ |
DART/− |
|
measured as M·+.
measured as [M + NH4]+.
measured as [M + O2]−.
|
| Tinuvin 234 |
448.2383 |
446.2238 |
448.2373 |
446.2241 |
−0.0010 |
0.0003 |
| Tinuvin 326 |
316.1211 |
314.1066 |
316.1185 |
314.1031 |
−0.0026 |
−0.0035 |
| Tinuvin 327 |
358.1681 |
356.1535 |
358.1666 |
356.1573 |
−0.0015 |
0.0038 |
| Tinuvin 328 |
352.2383 |
350.2238 |
352.2376 |
350.2201 |
−0.0007 |
−0.0037 |
| Tinuvin 770 c |
481.4000 |
512.3831 |
481.4018 |
512.3948 |
0.0018 |
0.0117 |
| Irganox E201 |
431.3884 |
429.3738 |
431.3876 |
429.3783 |
−0.0008 |
0.0045 |
| Irganox PS 800 |
515.4129 |
513.3983 |
515.4088 |
— |
−0.0041 |
— |
| Irganox PS 802 |
683.6007 |
681.5861 |
683.5949 |
— |
−0.0058 |
— |
| Irganox 1010 b |
1194.8179 |
1175.7768 |
1194.8565 |
— |
0.0386 |
— |
| Irganox MD 1024 |
553.4000 |
551.3854 |
553.3988 |
551.4048 |
−0.0012 |
0.0194 |
| Irganox 1035 a |
642.3949 |
641.3881 |
642.3984 |
— |
0.0035 |
— |
| Irganox 1076 b |
548.5037 |
529.4626 |
548.5003 |
529.4710 |
−0.0034 |
0.0084 |
| Irganox 1081 |
359.2039 |
357.1894 |
359.1999 |
357.1859 |
−0.0040 |
−0.0035 |
| Irganox 1330 a |
774.5945 |
773.5878 |
774.5936 |
— |
−0.0009 |
— |
| Irganox 3114 |
784.5259 |
782.5114 |
784.5251 |
— |
−0.0008 |
— |
| Irgafos 38 |
515.3649 |
513.3503 |
515.3616 |
— |
−0.0033 |
— |
| Irgafos 126 |
605.3155 |
603.3010 |
605.3224 |
— |
0.0069 |
— |
| Irgafos 168 |
647.4588 |
645.4442 |
647.4525 |
— |
−0.0063 |
— |
| Chimassorb 81 |
327.1955 |
325.1809 |
327.1929 |
325.1834 |
−0.0026 |
0.0025 |
| PEP 36 |
633.3468 |
631.3323 |
633.3464 |
— |
0.0004 |
— |
| HP136 |
351.2319 |
349.2173 |
351.2309 |
349.2208 |
−0.0010 |
0.0035 |
Analysis of stabilisers in solid polymer samples
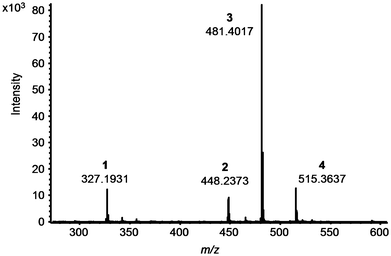
Commercial polymer samples available for this study contained only up to three stabilisers (Tinuvin 770, Irgafos 168, Irganox 1010). These stabilisers could be detected directly in the polymer platelets using DART. Subsequently 0.5 × 0.5 cm pieces of these samples were used for checking the DART parameters, previously determined using liquid samples, for solid plastic materials. As a result of these experiments, no changes in DART parameters were required. To demonstrate the suitability of DART for the detection of a much broader range of analytes, a set of five lab-made polymer samples was prepared employing a lab-scale compounder (exact procedure see experimental section). The additive composition of these samples was as follows: sample I (Tinuvin 234, Tinuvin 326, Tinuvin 770, Irgafos 38, Irganox 1081), sample II (Tinuvin 327, Irgafos 126, Irgafos 168, Chimassorb 81, Irganox 1024), sample III (Tinuvin 328, PEP36, Irganox 800, Irganox 802), sample IV (Irganox 1010, Irgafos 168, HP 136, Irganox 1035) and sample V (Tinuvin 770, Tinuvin 234, Irgafos 38, Chimassorb 81) with each stabiliser added at a concentration of 10 mg per 5 g base polymer. A small piece of the compounded polymer sample was subsequently introduced into the DART source using pincers and a MS spectrum was recorded. Fig. 4 shows a spectrum obtained for polymer sample V. As can be seen from this spectrum all four additives included in the compounded polypropylene sample could be detected and identified via measuring exact masses.
It is a well known fact that some stabilising agents tend to show decomposition upon exposure to high temperatures, high pressure, shearing forces and oxidising atmospheres. For this reason several batches of polymer samples were produced employing different compounding conditions. Compounding under increased shear forces (elevated extruder screw speed) and increased temperature led to a substantial reduction in signal intensities for several stabilisers. An example showing the influence of the temperature during compounding and extrusion on the polymer additives present in sample V is depicted in Fig. 5. The results from these investigations show that applying higher temperatures during the polymer processing can lead to significantly lower additive concentrations in the final product. Although we are aware of the fact that DART primarily is a qualitative, maybe semi-quantitative technique, trends given in Fig. 5 are in accordance with the occurrence of an increasing fraction of degradation products observed in the mass spectrum. This effect was even more pronounced in the case of Irgafos 126. DART even allowed to identify decomposition products occurring already at a compounding temperature of 190 °C, as can be seen from Fig. 6 depicting a spectrum for a polypropylene sample including this additive. A further increase of temperature led to a complete decomposition of the substance with no residual signal at m/z 605.3161 and increased signals for decomposition products such as 2,4-di-tert. butylphenol detected at m/z 207.1821.
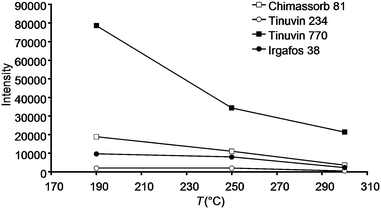 |
| | Fig. 5 Effect of compounding temperature on signal intensities obtained for stabilisers in polymer sample V. | |
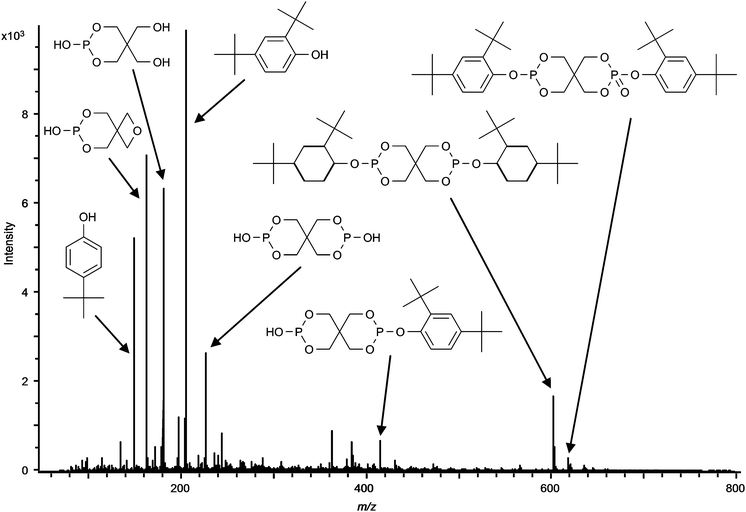 |
| | Fig. 6 DART-MS spectrum of a polymer sample containing Irgafos 126 and degradation products after compounding at 190 °C. Instrumental conditions: see experimental section. | |
Conclusions
In the present work we demonstrated that DART-MS is a suitable tool for the detection of up to 21 stabilising agents in polymer samples. A major advantage of DART-MS is the fact that not only toluene extracts of polymer samples but also solid plastic materials can be analysed without any previous sample pretreatment. The excellent mass accuracy of the TOF-MS employed provides high certainty in peak identification. As an additional benefit, the developed method allows a fast detection of additive degradation during polymer compounding and processing. In the case of some additives, even the identification of the resulting degradation products is possible.
Acknowledgements
The authors gratefully acknowledge JEOL (Europe) BV, Zaventem, Belgium for providing the DART-AccuTOF. We also want to thank DI Bernadette Duscher for assistance in the preparation of the polymer samples.
References
-
H. R. Allcock, and F. W. Lampe, in Contemporary Polymer Chemistry, Prentice Hall Englewood Cliffs, New Jersey, 2nd edn, 1990, pp. 196–231 Search PubMed.
- J. B. Knight, P. D. Calvert and N. C. Billingham, Polymer, 1985, 26, 1713–1718 CrossRef CAS.
- J. Pospíšil, Z. Horák, Z. Kruliš and S. Nešpůrek, Macromol. Symp., 1998, 135, 247–263 CAS.
- J. F. Schabron and L. E. Fenska, Anal. Chem., 1980, 52, 1411–1415 CrossRef CAS.
- H. J. Vandenburg, A. A. Clifford, K. D. Bartle, J. Carroll, I. D. Newton, L. M. Garden, J. R. Dean and C. T. Costley, Analyst, 1997, 122, 101R–115R RSC.
- D. Jenke, J. Liq. Chromatogr. Relat. Technol., 2003, 26, 2417–2447 CrossRef CAS.
- H. Mansouri, N. Yagobi and D. Ferrier, Chromatographia, 1998, 48, 491–496 CAS.
- T. Macko, B. Furtner and K. Lederer, Int. J. Polym. Anal. Charact., 1997, 3, 369–379 Search PubMed.
- B. Marcato and M. Vianello, J. Chromatogr., A, 2000, 869, 285–300 CrossRef CAS.
- M. J. Carrott, D. C. Jones and G. Davidson, Analyst, 1998, 123, 1827–1833 RSC.
- M. Waldebäck, C. Jansson, F. J. Señoráns and K. E. Markides, Analyst, 1998, 123, 1205–1207 RSC.
- H. J. Vandenburg, A. A. Clifford, K. D. Bartle, S. A. Zhu, J. Carroll, I. D. Newton and L. M. Garden, Anal. Chem., 1998, 70, 1943–1948 CrossRef CAS.
-
R. Gächter, and H. Müller, in Taschenbuch der Kunststoff-Additive, Carl Hanser Verlag, München-Wien, 3rd edn, 1990, ch. 3, pp. 946–975 Search PubMed.
- W. He, R. Shanks and G. Amarasinghe, Vib. Spectrosc., 2002, 30, 147–156 CrossRef CAS.
- I. Bruheim, P. Molander, E. Lundanes and T. Greibrokk, J. High Resolut. Chromatogr., 2000, 23, 525–530 CrossRef CAS.
- R. Matuška, L. Preisler and J. Sedlář, J. Chromatogr., A, 1992, 606, 136–140 CrossRef CAS.
- L. Coulier, E. R. Kaal, M. Tienstra and T. Hankemeier, J. Chromatogr., A, 2005, 1062, 227–238 CrossRef CAS.
- Y. Taguchi, Y. Ishida, H. Ohtani and H. Matsubara, Anal. Chem., 2004, 76, 697–703 CrossRef CAS.
- H. Pasch, T. Meyer-Duheuer and M. Resch, Kautschuk Gummi Kunststoffe, 1998, 51, 782–788 Search PubMed.
- S. T. Hasiao, M. C. Tseng, Y. R. Chen and G. R. Her, J. Chin. Chem. Soc., 2001, 48, 1017–1027.
- C. Poleunis, N. Medard and P. Bertrand, Appl. Surf. Sci., 2004, 231, 269–273 CrossRef.
- S. J. Wright, M. J. Dale, P. R. R. Langridge-Smith, Q. Zhan and R. Zenobi, Anal. Chem., 1996, 68, 3585–3594 CrossRef CAS.
- R. B. Cody, Anal. Chem., 2009, 81, 1101–1107 CrossRef CAS.
- M. Himmelsbach, W. Buchberger and E. Reingruber, Polym. Degrad. Stab., 2009, 94, 1213–1219 CrossRef CAS.
|
| This journal is © The Royal Society of Chemistry 2010 |
Click here to see how this site uses Cookies. View our privacy policy here. ![[thin space (1/6-em)]](https://www.rsc.org/images/entities/char_2009.gif) :
:![[thin space (1/6-em)]](https://www.rsc.org/images/entities/char_2009.gif) 50; v/v)) into the DART source. To improve mass accuracy alternating measurements of the sample and PEG 600 solution (used for internal mass calibration) were performed. Dip-IT glass rods for introducing liquid samples into the DART source (IonSense, Inc., Saugus, MA, USA) were employed throughout this work. An in-lab modified holder was used to obtain reproducible positioning of the glass rods. For measuring solid samples like the plastic platelets (0.5 × 0.5 cm) a self-made holder with a small metal cramp was employed. Polymer samples containing different stabilisers were prepared on a MiniLab II Haake Rheomex CTW5 lab-scale compounder from Thermo Scientific (Karlsruhe, Germany).
50; v/v)) into the DART source. To improve mass accuracy alternating measurements of the sample and PEG 600 solution (used for internal mass calibration) were performed. Dip-IT glass rods for introducing liquid samples into the DART source (IonSense, Inc., Saugus, MA, USA) were employed throughout this work. An in-lab modified holder was used to obtain reproducible positioning of the glass rods. For measuring solid samples like the plastic platelets (0.5 × 0.5 cm) a self-made holder with a small metal cramp was employed. Polymer samples containing different stabilisers were prepared on a MiniLab II Haake Rheomex CTW5 lab-scale compounder from Thermo Scientific (Karlsruhe, Germany).


