Random walk of single gold nanoparticles in zebrafish embryos leading to stochastic toxic effects on embryonic developments†
Lauren M.
Browning‡
,
Kerry J.
Lee‡
,
Tao
Huang
,
Prakash D.
Nallathamby
,
Jill E.
Lowman
and
Xiao-Hong
Nancy Xu
*
Department of Chemistry and Biochemistry, Old Dominion University, Norfolk, Virginia 23529. E-mail: xhxu@odu.edu; Web: www.odu.edu/sci/xu/xu.htm Fax: (+757) 683-5698; Tel: (+757) 683-5698
First published on 28th August 2009
Abstract
We have synthesized and characterized stable (non-aggregating, non-photobleaching and non-blinking), nearly monodisperse and highly-pure Au nanoparticles, and used them to probe nanoparticle transport and diffusion in cleavage-stage zebrafish embryos and to study their effects on embryonic development in real-time. We found that single Au nanoparticles (11.6 ± 0.9 nm in diameter) passively diffused into the chorionic space of the embryos via their chorionic pore canals and continued their random-walk through chorionic space and into the inner mass of embryos. Diffusion coefficients of single nanoparticles vary dramatically (2.8 × 10⁻¹¹ to 1.3 × 10⁻⁸ cm2 s−1) as nanoparticles diffuse through the various parts of embryos, suggesting highly diverse transport barriers and viscosity gradients in the embryos. The amount of Au nanoparticles accumulated in embryos increases with nanoparticle concentration increases. Interestingly, however, their effects on embryonic development are not proportionally related to their concentration. The majority of embryos (74% on average) chronically incubated with 0.025–1.2 nM Au nanoparticles for 120 h developed to normal zebrafish, with some (24%) being dead and few (2%) deformed. We have developed a new approach to image and characterize individual Au nanoparticles embedded in tissues using histology sample preparation methods and localized surface plasmon resonance spectra of single nanoparticles. We found Au nanoparticles in various parts of normally developed and deformed zebrafish, suggesting that the random-walk of nanoparticles in embryos during their development might have led to stochastic effects on embryonic development. These results show that Au nanoparticles are much more biocompatible with (less toxic to) the embryos than the Ag nanoparticles that we reported previously, suggesting that they are better suited as biocompatible probes for imaging embryos in vivo. The results provide powerful evidences that the biocompatibility and toxicity of nanoparticles is highly dependent on their chemical properties, and that the embryos can serve as effective in vivo assays to screen their biocompatibility.
Introduction
Gold nanoparticles have been used for a variety of applications over 400 years.1,2 Because Au possesses inert chemical properties, it has been widely considered as one of the most stable and biocompatible materials. Therefore, Au nanoparticles have been suggested as potential biocompatible probes for living cellular imaging and as target-specific vehicles for drug delivery.3–8 However, studies of the biocompatibility and toxicity of Au nanoparticles in various types of cells, have yielded inconclusive results: some studies show a toxic effect and high-dependence of toxicity on nanoparticle size and surface functional groups, while other studies report no significant cytotoxicity.6–14 Many of these studies did not use purified Au nanoparticles, or examine any other chemicals present in the Au nanoparticle solutions, or well characterize the physical properties (e.g., possible size change and aggregation) of Au nanoparticles in buffer solution and cell culture media during the experiments, leading to these inconclusive results.6–14 Furthermore, study of the biocompatibility and toxicity of Au nanoparticles in living animals is yet to be fully explored.14,15As noble metal nanoparticles, Au nanoparticles show unique optical properties such as localized surface plasmon resonance (LSPR), which is highly dependent upon their size, shape and surrounding environments.16–23 Single Au nanoparticles exhibit strong Rayleigh scattering, allowing them to be directly observed and characterized using dark-field optical microscopy and spectroscopy (DFOMS) in real-time.4,24–26 The size-dependent LSPR spectra of single nanoparticles allow us to characterize the sizes of individual nanoparticlesin vivo (in living animals) in real-time using DFOMS, showing a great promise for imaging in vivo.24,26–31 Nonetheless, it is essential to determine their potential toxicological effects in vivo, prior to fully using them in living organisms.
Unfortunately, current nanotoxicity studies are carried out using a wide variety of cell lines and different types of living organisms, leading to impossible comparison of results between different studies, and inconclusive and conflicting reports.7,12–15 Conventional cytotoxicity assays are typically designed for ensemble measurements, which are inadequate for assessing the toxicity of nanoparticles at the single-cell level, because nanoparticles are quite often unevenly distributed among individual cells, demanding the study of nanotoxicity at single-cell resolution. More importantly, nanoparticles are very different from conventional chemicals and drugs, and require special care to prevent them from aggregating in situ, and require new tools to characterize individual nanoparticlesin situ in real-time. Regrettably, in many nanotoxicity studies, such required cares were not taken to prevent aggregation of nanoparticles during the experimental duration, and adequate tools were not developed and used to characterize stability (non aggregation) and sizes of nanoparticlesin situ in real-time.7,12–14,32,33
It is well known that the physical and chemical properties of nanoparticles are highly dependent upon their size, shape, surface properties (e.g., surface functional group and charges), embedded solvents, and the way that they were prepared and purified.16–23 Their chemical and physical properties will surely affect their interactions with living organisms, and define their biocompatibility and toxicity in given living organisms. Therefore, it will be misleading if one tries to compare the study of one type of nanoparticles in one living organism with other types of nanoparticles in other living organisms.
To overcome the limitations of current nanotoxicity studies, we have developed: (i) new methods to prepare stable (non-aggregated) and purified model nanoparticles (e.g., different sizes and surface functional groups of Au and Ag nanoparticles); (ii) real-time imaging tools (e.g., DFOMS) for characterizing the size of individual nanoparticlesin vivo in real-time; and (iii) effective in vivo assays (zebrafish embryos) for screening and probing the biocompatibility and toxicity of our model nanoparticles,24–29,31 aiming to depict the dependence of biocompatibility and toxicity of nanoparticles on their physical and chemical properties, and their underlying mechanisms.
In our previous study, we used early development (cleavage-stage) zebrafish embryos to study the transport, dose-dependent biocompatibility and toxicity of purified Ag nanoparticles (11.6 ± 3.5 nm in diameter).28 In this study, we select the same cleavage-stage zebrafish embryos as an in vivo model system to study the transport mechanism and dose-dependent biocompatibility of the same size of purified Au nanoparticles, aiming to investigate the dependence of biocompatibility and toxicity of nanoparticles on their chemical properties. Study of the transport and effect of nanoparticles on embryonic development can also provide new insights into how nanoparticles affect embryonic development and offer new opportunities to develop biocompatible nanoparticle tools for a variety of applications, including in vivo imaging and drug delivery.
Zebrafish (Danio rerio) have been used extensively as a vertebrate model for embryological development studies because of their small size, short breeding cycle, and wealthy genetic database.34–39 Zebrafish embryos are transparent throughout every developmental stage and develop outside their mothers, allowing direct observation of the development of all internal organs without disturbing the embryos.39–41 The embryonic development is rapid: the first stages of development are completed in the first 24 hours post-fertilization (hpf); the normal embryo hatches by 72 hpf and fully develops at 120 hpf.39–41 Zebrafish can spawn large numbers of embryos, which can serve as effective and inexpensive in vivo assays for screening of the biocompatibility and toxicity of nanoparticles. Primary developmental mutations identified in zebrafish have close counterparts in other vertebrates,34,36,39 suggesting that zebrafish can be used effectively as a model for better understanding the developmental processes of higher organisms, including humans. Furthermore, fish (an important aquatic species) are renowned for their ability to bioconcentrate trace contaminants in the environment. Human consumption of fish suggests the potential impact of the release of nanoparticles into the environment on humans. The unique features of zebrafish allow us to probe transport and diffusion of individual Ag and Au nanoparticles inside the embryos, study their effects on the embryonic development in real-time, and use them as effective in vivo assays for screening the biocompatibility and toxicity of nanoparticles and for possible monitoring of their potential environmental impacts.28,29
Results and discussion
Synthesis and characterization of Au nanoparticles
As described in the Experimental section, we synthesized Au nanoparticles by reducing HAuCl4 with sodium citrate.2,42 We carefully washed the Au nanoparticles to remove any chemicals from the synthesis using centrifugation, and prepared highly purified and stable (non-aggregated) Au nanoparticles. We determined the concentrations, sizes and optical properties of the Au nanoparticles after each washing step as described in the Experimental section and the ESI.† We further characterized the concentrations, sizes, and optical properties of the purified Au nanoparticles dispersed in egg water (1.0 mM NaCl in DI water) for 120 h using UV–VIS absorption spectroscopy, dynamic light scattering (DLS), high-resolution transmission electron microscopy (HRTEM), and single-nanoparticleDFOMS (Figs. 1 and 2), aiming to determine their stability in egg water throughout the entire incubation period.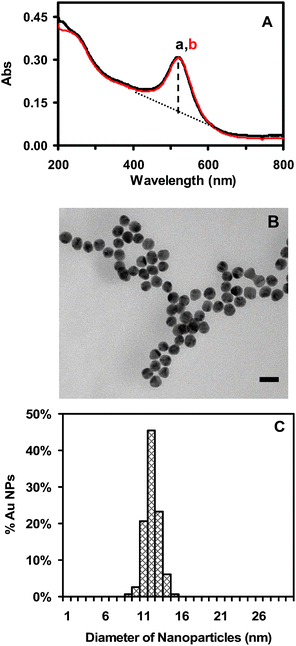 | ||
| Fig. 1 Characterization of size and stability of Au nanoparticles: (A) Representative UV–VIS absorption spectra of 1.20 nM Au nanoparticles well dispersed in egg water at 28 °C for (a) 0 and (b) 120 h, show that the spectra with peak absorbance wavelength at 520 nm remain unchanged for 120 h. The baseline-subtracted absorbance was calculated by subtracting the baseline (dashed line) from the peak absorbance using a well known baseline subtraction method. The full width was then determined at the subtracted half-maximum, giving FWHM = 53 ± 2 nm. (B) Representative HRTEM images of Au nanoparticles show the size and nearly spherical shape of single Au nanoparticles. Scale bar = 20 nm. (C) Histogram of the size distribution of Au nanoparticles measured by HRTEM shows the average size to be 11.6 ± 0.9 nm. | ||
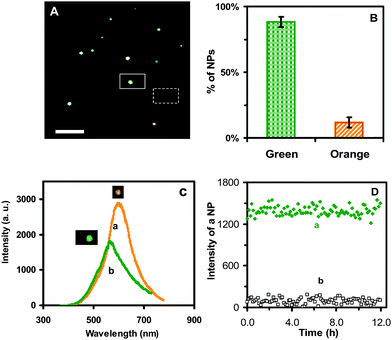 | ||
| Fig. 2 Characterization of the optical properties and photostability of single Au nanoparticles: (A) Representative dark-field optical image of single Au nanoparticles shows that the majority of nanoparticles are green with some being orange. The scale bar represents 2 µm and shows the distance between individual nanoparticles, but not the sizes of nanoparticles, because they were imaged under the optical diffraction limit. (B) Histogram of the color distribution of individual Au nanoparticles shows that (88 ± 4)% of nanoparticles are green and (12 ± 4)% are orange. (C) Representative LSPR spectra of single Au nanoparticles with peak wavelengths (λmax) at 565 nm (green) (FWHM = 75 nm) and 600 nm (orange) (FWHM = 59 nm). (D) Plots of the scattering intensity of (a) a representative single green Au nanoparticle and (b) the background vs. illumination time, shows that the intensity of the nanoparticle remains unchanged over time, demonstrating its photostability. | ||
The absorbance spectra of freshly prepared and purified nanoparticles before and after incubation with egg water for the entire experimental duration of 120 h (5 days) show an absorbance peak of 0.35 and a peak wavelength of 520 nm (FWHM = 53 nm) (Fig. 1A). This result indicates that the Au nanoparticles are very stable in the egg water and remain non-aggregated over 120 h, suggesting that we can use the nanoparticles to monitor the entire development of zebrafish embryos, which takes 120 h. We further characterized the sizes of the Au nanoparticles using HRTEM before and after incubation with egg water for 120 h, showing that the average size of the Au nanoparticles remains essentially the same at 11.6 ± 0.9 nm (Figs. 1B and C). We also measured the sizes of Au nanoparticles in egg water over 120 h using DLS, showing that the size of Au nanoparticles remains unchanged at 11.9 ± 1.6 nm. The nanoparticles are hydrated in the solution, thus, their size measured by DLS appears to be slightly larger than that determined using HRTEM.
We characterized the optical properties of individual Au nanoparticles using DFOMS. The representative optical image of single Au nanoparticles in Fig. 2A shows that the majority of the Au nanoparticles under dark-field microscopy are green, with a few being orange. The color distribution of single Au nanoparticles in Fig. 2B illustrates that (88 ± 4)% of the nanoparticles are green, and (12 ± 4)% are orange. We determined the color distribution of single nanoparticles in egg water over 120 h and found that it remained essentially unchanged over time, further demonstrating that single Au nanoparticles are stable (non-aggregated) in egg water.
Representative LSPR spectra of single Au nanoparticles acquired by DFOMS in Fig. 2C show the peak wavelength of 565 nm (green) (FWHM = 75 nm) and 600 nm (orange) (FWHM = 59 nm), respectively. Single green Au nanoparticles show lower scattering intensities than orange nanoparticles, suggesting that the green nanoparticles are smaller. By comparing the histogram of color distribution of single nanoparticles in Fig. 2B with the size distribution of single nanoparticles determined by HRTEM in Fig. 1C, we found that green nanoparticles are correlated with 9–13 nm Au nanoparticles while orange nanoparticles are associated with 13.5–15 nm Au nanoparticles.
As described by Mie theory, the optical properties (LSPR spectra) of noble metal nanoparticles (e.g., Au, Ag) depend on their size, shape, surrounding environment, and the dielectric constant of the embedding medium.18,19,23 As their spherical shape, surrounding environment, and the dielectric constant of the embedding medium remain essentially constant, the peak wavelength of LSPR spectra of single nanoparticles varies proportionally with the volume of single nanoparticles, and the scattering intensity of single spherical nanoparticles is proportional to the sixth power of their radius.18,19 These unique optical properties allow us to use their color-index as size-index or intensity-index as size-index to determine the sizes of single Au nanoparticles in solution in real-time using DFOMS, as we reported previously for the study of single Ag nanoparticles.24–26,28–30
We further characterized the photostability of single Au nanoparticles by acquiring sequential optical images of single Au nanoparticles using DFOMS while these nanoparticles were constantly irradiated under a dark-field microscope illuminator (30 W halogen) over 12 h. The nanoparticles were exposed to a white-light illumination power of 0.070 ± 0.001 W at the sample stage (focal plane of the dark field) during the entire experiment. We measured the scattering intensity of individual nanoparticles within a 20 × 20 pixel area (square in Fig. 2A) and averaged the background intensity of several detection areas with the same size of detection area (20 × 20 pixel) in the absence of nanoparticles (dashed square in Fig. 2A). We then subtracted the average background intensity from the integrated intensity of single nanoparticles and individual background areas and plotted the subtracted integrated intensity of individual nanoparticles and background as a function of time (Fig. 2D). These plots show that the scattering intensity of single Au nanoparticles remains essentially unchanged over time. The slight fluctuations of scattering intensity of single nanoparticles are similar to those observed in the background, suggesting that these fluctuations might be attributable to intensity fluctuation of the microscope illuminator or to dark noise of the CCD camera. Therefore, these results demonstrate that single Au nanoparticles are photostable and do not suffer photodecomposition and blinking, allowing us to use them as photostable probes to continuously probe nanoparticle diffusion and transport dynamics throughout the early development of zebrafish embryos and investigate the potential effects of single Au nanoparticles on the embryonic developments.
Diffusion and transport of single Au nanoparticles in cleavage-stage embryos
To determine whether individual Au nanoparticles can transport into living zebrafish embryos and their transport mechanism (active or passive transport pathway), we incubated the purified Au nanoparticles with the cleavage-stage zebrafish embryos and imaged the diffusion and transport of single nanoparticles into the cleavage-stage embryos and inside the embryos in real-time. The results in Figs. 3–4 show that single Au nanoparticles (green and orange nanoparticles as illustrated in Fig. 2C) can diffuse into embryos via the chorionic pore canals on the chorionic layers (CLs) and into the inner mass of embryos (IME). High-resolution black/white CCD images in Figs. 3–4 illustrate intra-embryonic structures in great detail, in which single Au nanoparticles exhibit higher scattering intensities (much brighter) than any debris of embryos. We further characterized the LSPR spectra of single Au nanoparticles observed in Figs. 3–4 using DFOMS, which showed that the spectra of individual nanoparticles are similar to those in Fig. 2C. The unique LSPR spectra of single Au nanoparticles allow us to distinguish them from any possible tissue debris or vesicle-like particles in embryos, because unlike Au nanoparticles, tissue debris do not possess plasmonic resonance and do not exhibit LSPR spectra (colors).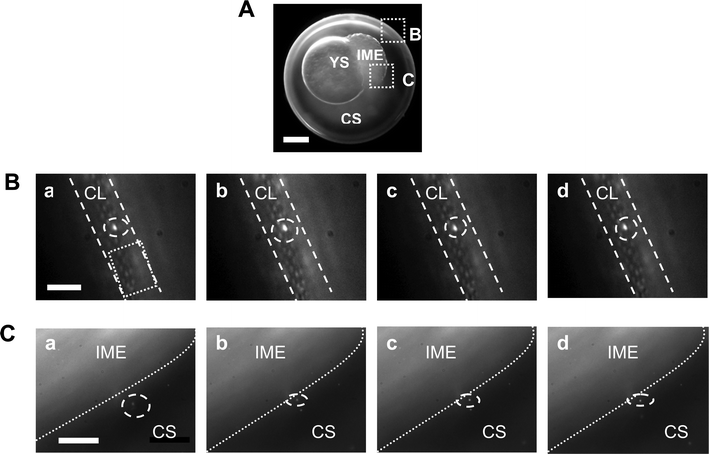 | ||
| Fig. 3 Real-time imaging of the diffusion and transport of single Au nanoparticles in a cleavage-stage zebrafish embryo. (A) Optical image of the cleavage-stage embryo shows chorion, chorionic space (CS), yolk sac (YS), and inner mass of embryo (IME), acquired by CCD camera. The transport of single Au nanoparticles at the interface of the chorion with egg water and at the interface of CS with the IME is illustrated in (B–C), respectively. Scale bar = 200 µm. (B) Sequential dark-field optical images of the chorionic layer (CL) illustrate the transport of single Au nanoparticles (circle), from the egg water into the CS via chorionic pore canals (square). The array of well-organized chorionic pore canals is clearly visualized and determined as 0.5–0.7 µm in diameter, with each pore about 1.5–2.5 µm apart. The straight dashed lines outline the CL. The time interval between: (a) and (b) is 2.75 s; (b) and (c) is 3.92 s; and (c) and (d) is 5.10 s. Scale bar = 10 µm. (C) Sequential dark-field optical images of the interface of CS with the IME illustrate the transport of single Au nanoparticles (circle), from the CS into the IME. The dotted lines outline the interface of the CS and the IME. The time interval between: (a) and (b) is 5.88 s; (b) and (c) is 5.89 s; and (c) and (d) is 3.14 s. Scale bar = 20 µm. Note that we used the LSPR spectra of the nanoparticles, which are similar to those observed in Fig. 2C, to identify Au nanoparticles diffusing inside the embryos. | ||
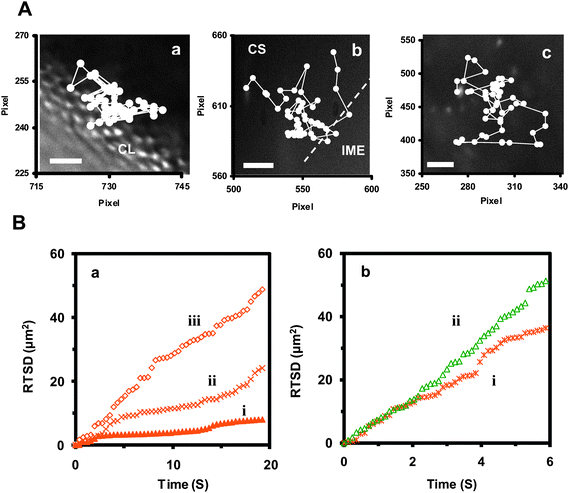 | ||
| Fig. 4 Characterization of transport and diffusion trajectories of single Au nanoparticles in a cleavage-stage embryo. (A) Diffusion trajectories of an orange Au nanoparticle at (a) the exterior surface of the CL, (b) at the interface of CS with the IME, and (c) in the CS. Scale bar = 5 µm. (B) Plots of real-time square displacement (RTSD) of single Au nanoparticles as a function of time: (a) from the diffusion trajectories (a–c) shown in (A), illustrating that the orange Au nanoparticle shows (i) restricted diffusion, with D = 2.3 ± 1.9× 10⁻⁹ cm2 s−1 at the exterior surface of CLs; (ii) partially restricted diffusion, with D = 3.3 ± 2.4× 10⁻⁹ cm2 s−1 at the interface of CS and the IME; and (iii) random Brownian motion, with D = 4.9 ± 0.8× 10⁻⁹ cm2 s−1 in CS, respectively. (b) from representative (i) orange and (ii) green Au nanoparticles in egg water. Both nanoparticles display random Brownian motion with D = 1.3 ± 1.0 × 10⁻⁸ cm2 s−1 and 2.7 ± 2.5× 10⁻⁸ cm2 s−1, respectively. | ||
An optical image of a cleavage-stage embryo in Fig. 3A shows chorion, chorionic space (CS), yolk sac (YS), and the IME. We focus on probing the transport of single Au nanoparticles at the interface of the chorion with egg water (CLs) and at the interface of the IME with CS as shown in the square in B and C in Fig. 3A, respectively. Sequential dark-field optical images of CLs in Fig. 3B illustrate the transport of single Au nanoparticles (circle), from the egg water into CS via chorionic pore canals. We clearly visualized arrays of well-organized chorionic pore canals [square in Fig. 3B(a)] on CLs and found each pore ranges 0.5–0.7 µm in diameter, and they are about 1.5–2.5 µm apart. This result agrees well with what we reported previously28 and as determined by TEM.43 Sequential dark-field optical images of the interface of CS with the IME show the transport of single Au nanoparticles (circle) from CS into the IME (Fig. 3C). The dotted lines in Fig. 3C outline the interface of CS and the IME.
To further determine their transport mechanisms (active or passive transport pathway), we investigate each diffusion trajectory of single nanoparticles in egg water, entry into CS, in CS, and further into the IME (Fig. 4A) using the concept of 2D mean-square-displacement (MSD) and diffusion models [e.g., active (directed) diffusion, simple passive or stationary Brownian diffusion].44,45 According to the diffusion models of single nanoparticles, plots of MSD vs. diffusion time interval show distinctive curves for active (directed) diffusion, simple passive Brownian diffusion, and stationary Brownian diffusion, respectively.44,45
We tracked the diffusion of single nanoparticles in various parts of embryos in real-time using real-time square-displacement (RTSD) (diffusion distance), instead of average (mean) of square-displacement, because viscosity gradients and various transport barriers in embryos can vary the diffusion coefficient of single nanoparticles in embryos.28,29 We used this approach to probe the diffusion modes and transport pathway of single nanoparticles, and transport barriers and viscosity of the different parts of embryos (e.g., CL, CS, IME) in real-time. We calculated the diffusion coefficient (D) of single nanoparticles in simple Brownian motion by dividing the slope of a linear plot of square-displacement vs. time by 4 (Note: RTSD = 4DΔt) (Fig. 4B).
Representative diffusion trajectories of individual Au nanoparticles with an identical orange color (size) (Fig. 4A) show: (a) a single Au nanoparticle diffusing into the embryo via chorionic pores at the exterior surface of a CL; (b) a single Au nanoparticle diffusing into the IME from CS; and (c) a single Au nanoparticle diffusing in CS. Note that we characterized orange single Au nanoparticles as shown in Fig. 2C(a), allowing us to identify individual Au nanoparticles in embryos.
Plots of the RTSD of these single Au nanoparticlesvs. time [Fig. 4B(a)] illustrate the distinctive diffusion patterns of single Au nanoparticles in various parts of the embryo. For instance, we found a restricted diffusion pattern (stationary Brownian diffusion),28,44,45 as the single Au nanoparticle diffused into the CS of the embryo from egg water via chorionic pores [Fig. 4B(a)(i)], suggesting that the single Au nanoparticle navigated through the pores and was tangled and trapped in the pores from time to time. The time taken for single Au nanoparticles to pass through the pores in CLs ranged from 0.8 to 10 s. The diffusion coefficients of single nanoparticles vary as it diffuses from egg water to the CLs, passing through the chorionic pores, and into CS, ranging from 2.9 × 10⁻¹¹ to 1.0 × 10⁻⁸ cm2 s−1 with an average of 2.3 ± 1.9× 10⁻⁹ cm2 s−1.
In contrast, the diffusion pattern of a single Au nanoparticle into the IME from CS shows a much lesser degree of restriction and the nanoparticle diffuses freely in simple random Brownian motion [Fig. 4B(a)(ii)], suggesting that transport from CS into the IME is less restricted than CLs. These results imply that the transport barrier at the CL is higher than at the interface of the IME and CS, suggesting a much better-protected surface (CL) of CS than the IME. The diffusion coefficients of single nanoparticles vary as it diffuses to and through the interface of CS and the IME, ranging from 1.0 × 10⁻⁹ to 9.5 × 10⁻⁹ cm2 s−1 with an average of 3.3 ± 2.4× 10⁻⁹ cm2 s−1. Interestingly, diffusion of single Au nanoparticles in CS exhibits simple random Brownian motion with uneven diffusion coefficients, ranging from 3.9 × 10⁻¹⁰ to 1.3 × 10⁻⁸ cm2 s−1 with an average of 4.9 ± 0.8× 10⁻⁹ cm2 s−1. This result suggests a highly heterogeneous CS with various viscosities, which is similar to what we reported previously.28,29
The results show that Au nanoparticles can diffuse into every part of embryos from egg water via passive Brownian diffusion (no active transport mechanism), because the plots of RTSD vs. time in Fig. 4B show the same characteristics as those described in diffusion models44,45 for simple passive Brownian diffusion and stationary Brownian diffusion, but not for directed (active) Brownian diffusion. Thus, individual Au nanoparticles are not transported into embryos from egg water or inside embryos via active transport pathways (e.g., uptake of nanoparticles driven by the energy of living embryos).
We also characterized the diffusion modes and diffusion coefficients of single green and orange Au nanoparticles in egg water [Fig. 4B(b)] to determine the possible variation of diffusion coefficient of individual nanoparticles due to the slight variation of their sizes, which serves as a control experiment to determine the variation of diffusion coefficients among single nanoparticles. We found that single orange and green Au nanoparticles show simple Brownian diffusion in egg water with D values of 1.3 ± 1.0× 10⁻⁸ and 2.7 ± 2.5× 10⁻⁸ cm2 s−1, respectively. It is well known that diffusion coefficients of single nanoparticles are inversely proportional to their radius, as described by the Stokes–Einstein equation, D = kT/(6πηa), which shows that D depends on the viscosity of the medium (η) and the radius (a) of solute (nanoparticle).46–48 As we described previously in Figs. 1 and 2, the Au nanoparticles with LSPR spectra of green and orange are correlated with nanoparticles with 9–13 nm and 13.5–15 nm in diameters, respectively. Thus, the diffusion coefficient of the larger nanoparticles (15 nm) is about twice as small as that of the smaller nanoparticles (9 nm), as shown in Fig. 4B(b). Note that the shapes of nanoparticles are not perfectly spherical. Thus, the aspect ratios of individual nanoparticles vary, which also contributes to the small variation in their diffusion coefficients.
We studied the diffusion coefficients of same color (size) of Au nanoparticles in embryos and compared them with those in egg water, showing that the various diffusion coefficients observed in the three different parts of the embryo [Fig. 4B(a)] are indeed attributable to the viscosity gradient and transport barrier of embryos, and not the different size of individual nanoparticles. The diffusion coefficients of single Au nanoparticles inside CS [Fig. 4B(a)(iii)] are about 2–110 times smaller than those of nanoparticles with identical orange color (size) in egg water [Fig. 4B(b)(i)], showing a wide variation of the viscosity gradients in CS.
Imaging and characterization of individual Au nanoparticles in embryos
We imaged and characterized nanoparticles accumulated and embedded in living embryos using DFOMS, during the incubation of cleavage-stage embryos with 1.2 nM Au nanoparticles for 4 h, during which the embryos developed from the cleavage stage to the gastrulation stage (Fig. 5). We observed green and orange Au nanoparticles in various parts of the embryos, (circle in Fig. 5A), which shows that single Au nanoparticles are embedded in the pores of CLs (on the surface of chorion) [Fig. 5A(b–c)], inside CS [Fig. 5A(d)] and the IME [on the surface of embryonic cells in Fig. 5A(e)]. We found that the LSPR spectra of these embedded single nanoparticles were similar to those observed in Fig. 2C, showing that they were indeed Au nanoparticles. Notably, the cleavage-stage and gastrulation-stage embryos have not yet developed any pigmentation, and any cellular and tissue debris of embryos appear white under dark-field microscopy, and they do not exhibit the signature LSPR spectra (colors) of single Au nanoparticles. Thus, the unique features of the LSPR spectra of single Au nanoparticles allow us to distinguish them from any possible tissue debris or vesicle-like particles in embryos.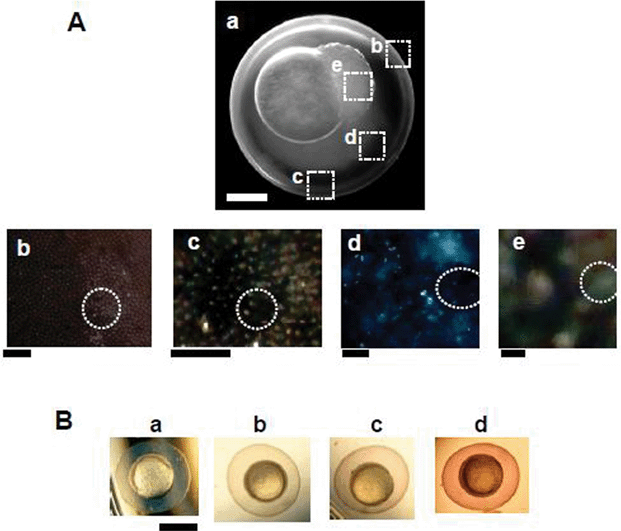 | ||
| Fig. 5 Characterization of Au nanoparticles in zebrafish embryos using DFOMS. (A) Representative optical image of (a) a cleavage-stage embryo shows single Au nanoparticles with multiple colors in (b) the intra- and (c) extra- surface of CL, illustrating well-organized chorionic pores; (d) in CS and (e) in the IME, as squared in (a). The tissue offers a dark-background, while embedded single Au nanoparticles give off LSPR spectra (colors). A few representative nanoparticles embedded in the tissues of interest are circled in (b–e) to help the identification of nanoparticles. We have not highlight all embedded Au nanoparticles, in order to enhance the clarity of the presentation. Scale bar = 200 µm in (a), 20 µm in (b–c), 10 µm in (d), and 1 µm in (e), which shows the distance between individual nanoparticles, but not the sizes of nanoparticles, due to the optical diffraction limit of optical imaging. The enlarged images of (b–e) are included in the ESI.† (B) Optical images of the gastrulation-stage embryos in (a) egg water alone and incubated with (b) 0.05, (c) 0.20, and (d) 1.20 nM Au nanoparticles for 4 h since its cleavage stage. The embryos in (b–d) show the light-red and dark-burgundy color of Au nanoparticles, suggesting that the amount of accumulated Au nanoparticles in the embryos increases with concentration. Scale bar = 500 µm. Note that the cleavage-stage embryos develop to the gastrulation stage in 4 h. Color images in (A: b–c) and (B) were acquired by DFOMS equipped with a color digital camera, while the image in (A: a) was acquired using a CCD camera. | ||
We found that the majority of nanoparticles diffused into the CS and some of them overlapped with chorionic pore canals [Fig. 5A(b–c)]. The representative LSPR spectra of individual nanoparticles in CS [Fig. 5A(b)] show a similar peak wavelength to those observed in egg water in Fig. 2C. This result indicates that the majority of nanoparticles remain non-aggregated inside embryos. Otherwise, we would have observed a significant red shift in the LSPR spectra of individual nanoparticles. Note that the images in Fig. 5A were acquired in a whole living embryo in real-time. Since the entire embryo was filled with nanoparticles, it led to a high background in the color images [Fig. 5A(b–e)].
We also incubated cleavage-stage embryos with various concentrations of Au nanoparticles, and imaged Au nanoparticles accumulated in embryos, aiming to determine the concentration-dependence of accumulated Au nanoparticles in embryos. The color images in Fig. 5B clearly show that the colors of embryos (6 hpf) depend on the incubation concentration of Au nanoparticles, showing colorless embryos in egg water (the absence of Au nanoparticles), the light-red and dark-burgundy (color of Au nanoparticles in solution) embryos, as cleavage-stage embryos were incubated with 0, 0.05, 0.20, and 1.20 nM Au nanoparticles for only 4 h, respectively. This result indicates that the amount of Au nanoparticles accumulated in embryos increases as Au nanoparticle concentration increases, suggesting that the concentration-gradient of Au nanoparticles may be the driving force for passive diffusion of Au nanoparticles into the embryos, which agrees well with the entry of single nanoparticles into embryos via passive random Brownian motion as shown in Figs. 3–4. We are further developing ultrasensitive tools for quantifying the total amount of Au nanoparticles in individual living embryos with both temporal and spatial resolution in real-time.
Effects of Au nanoparticles on embryonic development
To probe the possible concentration-dependence of the effects of Au nanoparticles on embryonic development, we chronically incubated cleavage-stage embryos with a series of washed (purified) Au nanoparticle solutions (0, 0.025, 0.05, 0.10, 0.20, 0.40, 0.60, 0.80, 1.0, 1.2 nM) for 120 h, as they fully developed to zebrafish. We imaged the embryos throughout their developmental stages and characterized live, dead and deformed zebrafish as they fully developed at 120 h. Plots of the percentages of live, dead and deformed zebrafish vs. concentration of Au nanoparticles (Fig. 6A) illustrate that in the absence of nanoparticles (control experiment), (82 ± 10)% of zebrafish were alive and normally developed, while (18 ± 10)% of zebrafish were dead, but no deformed zebrafish were observed.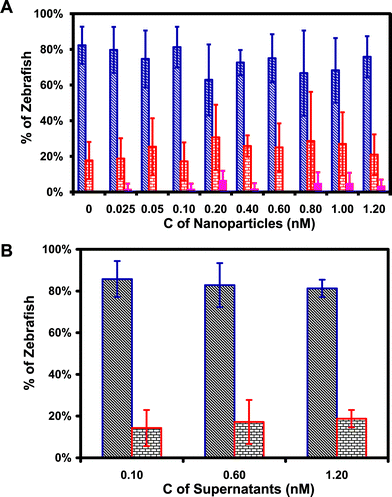 | ||
| Fig. 6 Effect of Au nanoparticles on embryonic development: (A) Histogram of the distribution of normally developed (blue), dead (red), and deformed (pink) zebrafish vs. concentration of Au nanoparticles; (B) Histogram of the distribution of normally developed (blue) and dead (red) vs. concentration of supernatant removed from washing Au nanoparticles (negative control). | ||
Note that the molar concentrations of Au nanoparticles (0, 0.025, 0.05, 0.10, 0.20, 0.40, 0.60, 0.80, 1.0, 1.2 nM) were calculated based upon the number of nanoparticles, as described previously.27,28,42 These molar concentrations can be converted to weight/volume concentrations (0, 0.26, 0.53, 1.1, 2.1, 4.2, 6.3, 8.4, 10.5, 12.6 µg mL−1). Although the majority of reported nanotoxicity studies use weight or weight/volume concentration of nanoparticles to describe their findings, we have used molar concentrations of nanoparticles throughout our studies,25–29,31,42 because the molar concentration of nanoparticles truly reflects the number of nanoparticles in solution and accurately describes the proportional change in the surface area of nanoparticles as their molar concentration changes. In contrast, the weight/volume concentration of nanoparticles cannot accurately describe the number and total surface area of nanoparticles in solution. For instance, if the weight/volume concentration of nanoparticles is doubled, the number of nanoparticles and their surface area are not doubled. This is another common mistake that has been made in many nanotoxicity studies, which in part leads to conflicting reports, because it is incorrect to treat each atom of nanoparticles, instead of individual nanoparticles, like a drug (chemical) molecule in a conventional toxicity study. Note that surface atoms of nanoparticles differ from their bulk atoms. We will report in a separate study that it is inaccurate and misleading to use weight or weight/volume concentrations of nanoparticles to describe their concentration-dependent biocompatibility and toxicity.
As the Au nanoparticle concentration increases from 0.025 to 1.2 nM, the percentages of alive and normally developed zebrafish decrease slightly within the margin of error, ranging from (81 ± 13)% to (63 ± 20)%, and the percentage of dead zebrafish increases from (17 ± 11)% to (31 ± 18)%. Interestingly, the percentage of deformed zebrafish ranges from 0 to (6.6 ± 5.5)% in the presence of Au nanoparticles, showing stochastic dependence on nanoparticle concentration.
To ensure that the deformed zebrafish are not caused by any possible residual chemicals from the synthesis of nanoparticles, we performed negative control experiments by replacing Au nanoparticles with an equal amount of supernatant generated from washing the nanoparticles. The results in Fig. 6B illustrates that the percentages of normally developed live zebrafish and dead zebrafish are essentially same as those observed in the absence of Au nanoparticles in Fig. 6A, and deformed zebrafish were not observed in 0, 0.10, 0.60, and 1.20 nM supernatants. Notably, deformed zebrafish were observed only in the embryos treated by Au nanoparticles, and not in any control experiments (e.g., egg water or supernatants), indicating the toxicity of Au nanoparticles.
We compare normally developed zebrafish (Fig. 7A) with abnormally developed zebrafish (Fig. 7B) to identify the types of deformities. We found a wide variety of deformities, including finfold (FF) abnormality, tail or spinal cord flexure and truncation (TF), cardiac malformation (CM), yolk sac edema (YSE), and acephaly (headless) and no tail (NT/A), as illustrated in Fig. 7B. For instance, in normally developed zebrafish,39–41 the median finfold is a clear and thin membrane around the entire trunk region containing unsegmented fin rays, and the notochord and spinal cord develop straight to the posterior-most tip of the tail [Fig. 7A(a and b)]. In contrast, the tissue structure of the finfold of zebrafish is disorganized and the shapes of the finfold and fin rays are altered [Fig. 7B(a–b)], which is classified as finfold abnormality. The finfold abnormality is often accompanied by tail and spinal cord flexure or truncation [Fig. 7B(a–d)]. A few embryos exposed to Au nanoparticles also displayed a form of cardiac malformation in fully developed zebrafish, where the pericardial sac region is extremely large and the cardiac ventricle is shrunk [Fig. 7B(e–f)]. The yolk sac region is a bulbous area containing yolk that provides nutrients to the developing embryo, and it shrinks during the later developmental stages in normally developed zebrafish [Fig. 7A(c)]. In contrast, the yolk sac region of zebrafish is swollen and enlarged [Fig. 7B(e–f)], which is classified as yolk sac edema.
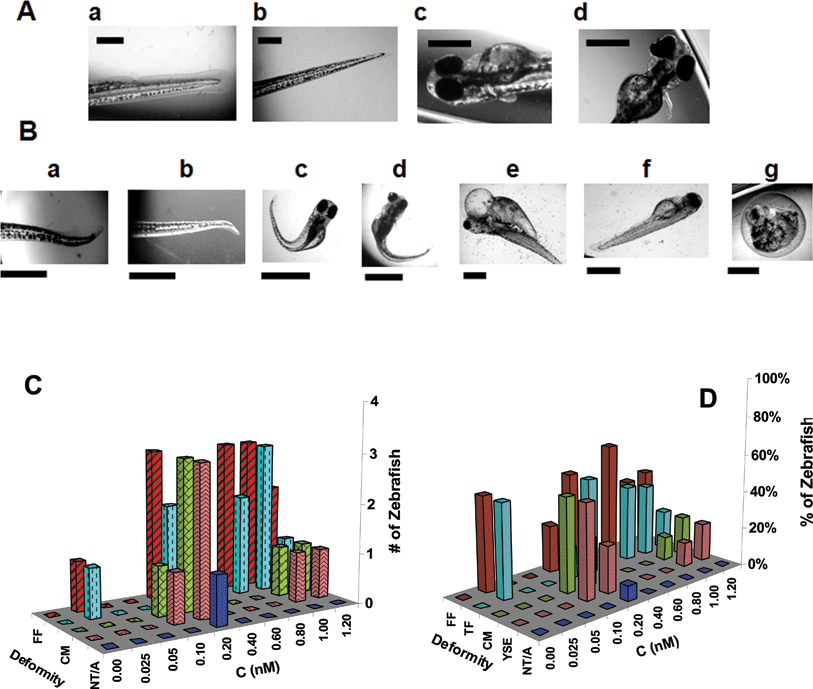 | ||
| Fig. 7 Normal and deformed zebrafish resulting from chronic treatment with Au nanoparticles since their cleavage stage. (A) Representative optical images of normally developed zebrafish showing the normal development of the (a) finfold (FF); (b) tail/spinal cord; (c) cardiac and yolk sac; and (d) head and eyes. Scale bar = 500 µm. (B) Representative optical images of zebrafish at a given concentration of Au nanoparticles showing several deformities such as (a–b) finfold abnormality; (c–d) tail/spinal cord flexure and truncation (TF); (e–f) cardiac malformation (CM) and yolk sac edema (YSE); and (g) acephaly and no tail (NT/A). Scale bars = 250 µm (a, b), 1000 µm (c–f), and 500 µm (g). (C) Histograms of numbers of deformed zebrafish with each type of deformity vs. concentration of Au nanoparticles. (D) Histograms of the percentages of deformed zebrafish with each type of deformity vs. concentration of Au nanoparticles. The percentage of deformed zebrafish with each type of deformity was calculated by dividing the number of one given type of deformed zebrafish with the total number of all five types of deformed zebrafish observed at a given concentration of nanoparticles, aiming to show possible dependence of types of deformation on nanoparticle concentration. Abbreviations of deformities in (C) and (D) are represented as follows: finfold (FF) abnormality in red, tail/spinal cord flexure and truncation (TF) in cyan, cardiac malformation (CM) in green, yolk sac edema (YSE) in pink, no tail and acephaly (NT/A) in blue. | ||
The most severe and rare deformation of zebrafish that we have observed in this study is acephaly (absence of a developed head) and the lack of a distinct tail region [Fig. 7B(g)], while the heart of such a deformed zebrafish is still beating. This severely deformed zebrafish shows a small amount of head-like tissue where the head would normally develop, but the tissue was not a fully developed head but rather an irregularly formed mass of tissue. Notably, we found only one out of more than 1000 embryos treated with Au nanoparticles developed this acephaly deformation. The comprehensive list of representative deformities of zebrafish is summarized in Table 1S in the ESI.† Typically, multiple types of deformations were observed in the same zebrafish (Fig. 7B and Table 1S in the ESI† ), suggesting that some of these deformations may be inter-related.
To illustrate the possible dependence of the number of deformed zebrafish and their deformities (e.g., finfold abnormality, tail and spinal cord flexure and truncation, cardiac malformation, yolk sac edema, acephaly and no tail) on nanoparticle concentration, we plotted the number of given types of deformed zebrafish vs.nanoparticle concentration (Fig. 7C), showing the highest number of deformed zebrafish and most types of deformities at 0.20 nM. To determine any possible dependence of a specific type of deformity on nanoparticle concentration, we plotted the percentages of given types of deformed zebrafish (= number of one given type of deformed zebrafish divided by the total number of deformed zebrafish at a given concentration) vs.nanoparticle concentration (Fig. 7D). We found that the percentages of any given type of deformed zebrafish varies with nanoparticle concentration.
Note that we carried out the study of the effect of Au nanoparticles on embryonic development on a large amount of embryos (60–64 embryos for each experiment) at the single-embryo level (Figs. 6–7), aiming to overcome ensemble average measurements and to determine rare events of interest for further investigation. Rare events of interest (e.g., deformities of zebrafish) in Fig. 7 would otherwise be buried under ensemble measurements, emphasizing the importance of the study of a bulk amount of embryos at the single-embryo level. All rare events presented in this study are within the confidence level of 95% (or P = 0.05) for at least four sets of measurements at each nanoparticle concentration (each with 15–20 embryos) analyzed using conventional statistical methods (e.g., t-test or Q-test). We present significant differences of observations among each concentration in the Experimental section. Nonetheless, it is important to point out that conventional statistical analysis methods are only suited to the analysis of ensemble measurements, and are not well suited to analysis of measurements at single-entity level (e.g., single-embryo, single-cell or single-molecule detection).
Taken together, the results in Fig. 6 illustrate that cleavage-stage embryos chronically treated with Au nanoparticles for 120 h result in small numbers of dead and abnormally developed zebrafish. The treated embryos show no clear trend of increase in death or development of deformed zebrafish (types of deformity and severity), as nanoparticle concentration increases. By comparing this result with our previous observations of the effects of the same size and concentration of Ag nanoparticles on the same stage of embryos,28 we find that Au nanoparticles caused negligible numbers of dead and deformed zebrafish in comparison with Ag nanoparticles, suggesting that Au nanoparticles are much more biocompatible and less toxic to embryos. Nonetheless, the same types of deformed zebrafish were observed in both studies (treating embryos with either Au or Ag nanoparticles). A plausible explanation for these interesting observations is that the random Brownian diffusion of Au nanoparticles inside embryos during their development (120 h) might have led to the accumulation of varying amounts of Au nanoparticles in various parts of the embryos stochastically.
Imaging and characterization of individual Au nanoparticles in fully developed zebrafish
We imaged and characterized Au nanoparticles embedded in fully developed zebrafish that had been chronically incubated with a given concentration (1.20 nM) of nanoparticles for 120 h since their cleavage stage. We rinsed the zebrafish with DI water to remove external nanoparticles, and fixed them using a histology protocol for tissue sample preparation, as described in the Experimental section. We prepared ultrathin-layer sections (∼0.25–4 µm thickness) of the zebrafish by carefully sectioning the tissues of interest (e.g., eye retina, brain, nasal epithelium, otic capsule, stomach, notochord, swim bladder, and pectoral fin) using a microtome. Finally, we imaged and characterized LSPR spectra of individual nanoparticles embedded in the tissues of interest using DFOMS (Fig. 8).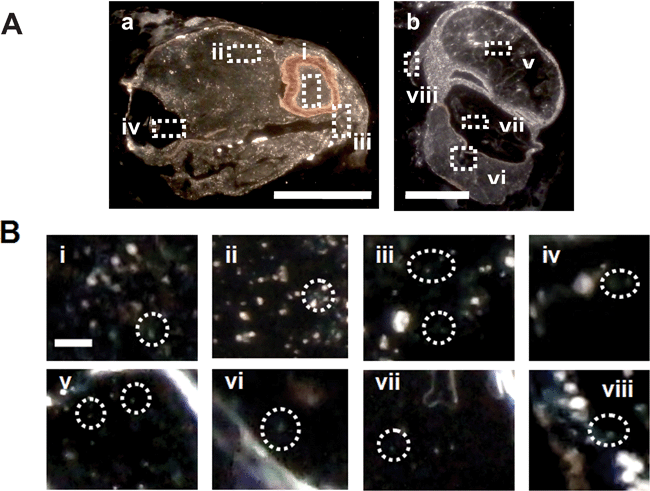 | ||
| Fig. 8 Characterization of Au nanoparticles embedded in a fully developed zebrafish. (A) Optical color images of a fixed (a) longitudinal section and (b) cross-section of a normally developed zebrafish. The rectangles highlight representative areas: (i) retina, (ii) brain tissue, (iii) nasal sensory epithelium, (iv) otic capsule, (v) stomach, (vi) notochord, (vii) swim bladder, and (viii) pectoral fin. Thickness of tissue sections = 3.5 ± 0.5 µm. (B) Zoomed-in optical images of those tissue sections outlined in (A). The circles highlight representative individual Au nanoparticles embedded in the tissue sections. Scale bar = 200 µm in (A) and 4 µm in (B). LSPR spectra of individual embedded nanoparticles are similar to those observed in Fig. 2C, showing that they are indeed Au nanoparticles and the majority of embedded nanoparticles remain non-aggregated. | ||
We observed green and orange Au nanoparticles in various parts of the normally developed zebrafish. The results in Fig. 8B show that Au nanoparticles are embedded in the (i) retina, (ii) brain tissue, (iii) nasal sensory epithelium, (iv) otic capsule, (v) stomach, (vi) notochord, (vii) swim bladder, and (viii) pectoral fin. To enhance the clarity of presentation, we did not circle all embedded nanoparticles in the tissues, but highlighted a few representative nanoparticles embedded in the tissues of interest, such as those circled in Fig. 8B. LSPR spectra of individual embedded nanoparticles are similar to those observed in Fig. 2C, showing that they are indeed Au nanoparticles and the majority of embedded nanoparticles remain non-aggregated. If Au nanoparticles were aggregated, the sizes of single nanoparticles would become larger, which would lead to a large shift in the peak wavelength of the LSPR spectra of single nanoparticles and color changes of single nanoparticles. We found that the entire section of tissue was fully embedded with nanoparticles. LSPR scattering of individual nanoparticles lighted up their surrounding tissue, creating a high background, which was not observed in the tissues of zebrafish untreated with nanoparticles. The unique feature of LSPR spectra of single Au nanoparticles (Fig. 2C) allows us to distinguish them from any possible tissue debris, because tissue debris does not exhibit such LSPR spectra under dark-field microscopy.
In comparison with TEM, we found several unique advantages of using histology protocols to prepare tissue samples and using LSPR spectra to characterize embedded individual Au nanoparticles in tissue samples. For example, we can align the zebrafish in the desired position and perform ultrathin-layer section of specific areas of zebrafish. We can characterize the tissue of interest with no need of using staining reagents. Note that staining reagents quite often create significant background and interfere with the identification of individual nanoparticles. We can characterize a massive amount of tissue samples rapidly using DFOMS, allowing us to carry out extensive studies, generating massive amounts of data for statistical analysis, as well as to investigate rare events of interest. We can qualitatively characterize individual Au nanoparticles and determine their sizes using their unique LSPR spectra. Note that LSPR spectra depend upon the size, shape and surrounding environments of nanoparticles. By carefully calibrating the LSPR spectra of individual nanoparticlesvs. their sizes, as described above in Figs. 1–2, we can determine the size of individual nanoparticles at the nanometre scale using their LSPR spectraviaDFOMS.
Although TEM has been widely used to characterize nanoparticles embedded in cells and tissues, and TEM can offer much higher spatial resolution,7,14,25,33 the protocols for TEM sample preparation are cumbersome, and it is nearly impossible to control the alignment of biological organisms (e.g., zebrafish and cells) in resin blocks. Thus, the sections of tissues and cells are generated with random locations of organisms, and it is hard to prepare reproducible sections of interest for comparison, to generate and characterize massive amounts of tissue sections for statistical analysis, and to probe rare events of interest. More problematically, to observe the characteristic locations (morphologies) of tissues and cells using TEM, one needs to stain tissues and cells using staining reagents (e.g., uranyl acetate and lead citrate), which quite often creates significant background and interferes with identification of nanoparticles embedded in tissues. To definitively identify embedded nanoparticles of interest, one needs to perform EDS of the embedded nanoparticles in tissues and cells. Unfortunately, for nanoparticles that are smaller than 15 nm, it is extremely challenging to obtain a sufficiently high signal from individual nanoparticles over the background and noise of the surrounding tissues and those reagents used to prepare and fix the tissues and cells. To gain a sufficiently high EDS signal from individual nanoparticles and reduce noise and background, one can increase the voltage of the electron beam and/or focus the electron beam on the nanoparticles of interest (reduce the size of the focus spot to decrease the signal of surrounding tissues). However, current technologies provide micrometre-square areas of EDS scanning. Furthermore, tightening the beam area and using higher voltages for the electron beam leads to exposure of biological samples to higher energies, resulting in the evaporation of surrounding tissues and cells (burning a hole through tissue samples) and loss of signals of interest. These limitations may be the reasons why EDS characterization of embedded nanoparticles (especially smaller nanoparticles, <15 nm) in tissues and cells have rarely been reported, even though TEM images have been widely displayed in the literature.
Therefore, it is crucial to explore new and effective methods to quantitatively and qualitatively image and characterize embedded individual nanoparticles in tissues and cells. We found that the methods that we have reported in this study are more powerful, informative, convenient, and much lower cost than current conventional TEM methods for imaging and characterization of individual nanoparticles embedded in tissues.
By comparing the results in Fig. 8 with those in Fig. 5, we found that nanoparticles that had diffused into the early developing embryos stayed inside the embryos during their entire development, which led to the nanoparticles embedded in various parts of fully developed zebrafish. The most intriguing question here is what factor defines the developmental fate of the cleavage-stage embryos to become normally developed, deformed (various types of deformation), or dead zebrafish.
As we found in Fig. 8, normally developed zebrafish are embedded with significant numbers of Au nanoparticles all over their bodies, and the results in Figs. 6 and 7 illustrate that percentages of dead and deformed zebrafish and types of zebrafish deformation are not proportionally correlated with the concentration of Au nanoparticles. These interesting findings further suggest what we speculated previously: that the random-walk (random Brownian diffusion) of Au nanoparticles inside embryos during their development (120 h) might lead to stochastic toxic effects on embryonic development. It is quite possible that various parts of embryos might have different responses to Au nanoparticles. If the majority of the portions of the embryos are tolerant to Au nanoparticles, it will be entirely stochastic and less concentration-dependent for individual Au nanoparticles to randomly walk into the vital portion of embryos that is much more sensitive to Au nanoparticles, leading to abnormal development of zebrafish. The other possible explanation is that some embryos may be more tolerant to Au nanoparticles than others. Thus, some embryos develop normally, while others are dead or deformed.
Experimental section
Synthesis and characterization of gold nanoparticles
We synthesized gold nanoparticles by reducing a 1.0 mM aqueous solution of HAuCl4·3H2O with 38.8 mM sodium citrate solution.2,42 As we were refluxing, stirring and boiling the solution for 30 min, we found that the solution changed from yellow to colourless, then to dark purple and finally to burgundy. We stopped heating the solution, continued stirring for 30 min, and filtered the solution using a 0.22 µm filter. The nanoparticles were then washed twice with deionized (DI) water using centrifugation (7735 relative centrifugal force (rcf), Beckman J-21) to remove the by-products of the reaction and any excess of chemicals in solution. The washed nanoparticles in the pellets were then resuspended in DI water and used for incubation with embryos. The supernatant of the nanoparticle solution removed from the last washing step was collected and used as a negative control experiment to monitor the effects of possible trace chemicals involved in nanoparticle synthesis that might be present in the nanoparticle solution. All chemicals were purchased from Sigma and used without further purification or treatment, and DI water (Nanopore, 18 MΩ) was used to prepare solutions and rinse glassware.We characterized the concentrations, optical properties, and sizes of nanoparticles using UV–VIS spectroscopy (Hitachi U-2010), dark-field optical microscopy and spectroscopy (DFOMS), high-resolution transmission electron microscopy (HRTEM) (FEI Tecnai G2 F30 S-Twin), and dynamic light scattering (DLS) (Nicomp 380ZLS).
We have described in detail, in our previous studies, the design and construction of our DFOMS (also called as SNOMS) for real-time imaging and characterization of LSPR spectra of single nanoparticles in solution, in single living cells, in zebrafish embryos, and for single-molecule detection.4,5,24–31,47,49,50 In this study, a CoolSnap HQ2 CCD camera and EMCCD camera (PhotonMAX) coupled with a Spectrograph (SpectraPro-2150, Roper Scientific), and a color digital camera were used for imaging and characterization of LSPR spectra of single Au nanoparticles.
Analysis and characterization of molar concentrations of Au nanoparticle solutions
We calculated the molar concentration of unwashed Au nanoparticles as described previously.42 We then measured UV–VIS absorption spectra for a series of unwashed Au nanoparticle solutions (0.48, 0.79, 1.6, 3.2, 7.9, 14.3 nM), determined the baseline-subtracted absorbance as illustrated in Fig. 1A, and plotted the subtracted absorbance vs. molar concentrations of Au nanoparticle solution [Fig. 1S(A) in the ESI† ], which showed a linear calibration curve with a linear regression of 1.0 and slope of 6.3 × 10⁷ M−1. Using the Beer–Lambert law (A = εbC), we found that molar absorptivity (extinction coefficient ε520nm) of Au nanoparticle solutions at the peak wavelength (λmax) of 520 nm is 6.3 × 10⁷ M−1 cm−1.The nanoparticles were spun-down using centrifugation to remove the by-products of the reaction and any excess of chemicals in solution, as described above. The nanoparticles in the pellets were resuspended in DI water, to produce the first-time washed nanoparticle solution. We measured UV–VIS absorption spectra for this solution, showing that the λmaxof the spectrum at 520 nm was the same as those observed for the unwashed nanoparticles. The result suggests that the size of the Au nanoparticles remained unchanged during the centrifugation, which was confirmed by HRTEM and DLS measurements (Fig. 1). Thus, we used the extinction coefficient of the unwashed Au nanoparticles (ε520nm = 6.3 × 10⁷ M−1 cm−1) to calculate the concentration of the washed nanoparticles as 13.8 nM. We further measured the UV–VIS absorption spectra of a series of the first-time washed Au nanoparticle solutions (0.77, 1.5, 3.9, 6.9, 10.8, 13.8 nM) and found their λmax at 520 nm [Fig. 1S(B) in the ESI† ]. The plot of subtracted absorbance vs. concentration for the first-time washed nanoparticles shows a linear calibration curve with a linear regression of 1.0 and slope of 6.3 × 10⁷ M−1, and ε520nm of 6.3 × 10⁷ M−1 cm−1.
Using the same approach, we prepared second-time washed Au nanoparticles and measured UV–VIS absorption spectra of these solutions, which also had a λmax of 520 nm, the same as that observed in the first-time washed nanoparticles. The results suggest that the size of the Au nanoparticles remained unchanged during the centrifugation, which was confirmed by HRTEM and DLS measurements. Thus, we used the ε520nm = 6.3 × 10⁷ M−1 cm−1 to calculate the concentration of the second-time washed nanoparticles as 6.6 nM. We further measured the UV–VIS absorption spectra of a series of the second-time washed Au nanoparticle solutions (0.37, 0.73, 1.8, 3.3, 5.1, 6.6 nM) and found their λmax at 520 nm [Fig. 1S(C) in the ESI† ]. The plot of subtracted absorbance vs. concentration of the second-time washed nanoparticles shows a linear calibration curve with a linear regression of 1.0 and slope of 6.3 × 10⁷ M−1. Thus, ε520nm of the second-washed Au nanoparticle solution is 6.3 × 10⁷ M−1 cm−1.
We also used DFOMS to determine any trace amount of individual Au nanoparticles in the supernatants. If we found any Au nanoparticles in the supernatant, we would further remove them using ultra-centrifugation (L90, Beckman), which allowed the supernatant to serve as a control experiment (all other chemicals, except Au nanoparticles, are present in the solution). Note that we would continue washing cycles (three or four washing cycles) until we generated a supernatant that did not affect the embryonic development (clean blank control experiments), which indicated that the nanoparticles were well purified and ready to be used to treat the embryos. In this study and our previous studies,28,29 two-times washed supernatants provided clean and successful control experiments. In other words, the twice-washed nanoparticles are sufficiently pure to be used to study their effects on embryonic development.
Characterization of photostability of single Au nanoparticles
We characterized the photostability of single Au nanoparticles by acquiring sequential optical images of single Au nanoparticles using an EMCCD camera with exposure time of 200 ms and interval time of 40.6 ms for the first 5 min and 300 s afterwards while these nanoparticles were constantly irradiated using a dark-field microscope illuminator (30 W halogen) for 12 h. The illumination power at the sample stage (focal plane of the dark field) measured using a power meter was 0.070 ± 0.001 W during the experiment.27–29,31 We calculated the integrated intensity of a 20 × 20 pixel area where a nanoparticle was presented (square in Fig. 2A) and the average background intensity of several detection areas with the same size of detection area (20 × 20 pixel) in the absence of nanoparticles (dashed square in Fig. 2A). By subtracting the average background intensity from the integrated intensity of single nanoparticles and individual background area, we plotted the subtracted integrated intensity of individual nanoparticles and background as a function of time (Fig. 2D). We characterized and identified individual Au nanoparticles using their LSPR spectra (Fig. 2C).Breeding of zebrafish embryos
We housed wild-type adult zebrafish (Aquatic Ecosystems) in a stand-alone system (Aquatic Habitats), and maintained and bred zebrafish as described previously.28,29,51 Briefly, we placed two pairs of mature zebrafish into a clean 10-gallon breeding tank, and used a light (14 h)–dark (10 h) cycle to trigger breed and fertilization of embryos. We collected the embryos at cleavage stage (8–64-cell stage; 0.75–2.25 hpf), transferred them into a petri dish containing egg water (1.0 mM NaCl in DI water) (NaCl, 99.95%, Sigma), and rinsed them well with egg water to remove the surrounding debris.Study of transport and biocompatibility of Au nanoparticles in embryos
To probe the transport of individual Au nanoparticles into embryos in real-time, we then placed the cleavage-stage embryos directly into a home-made microchamber, and simultaneously imaged the transport of single nanoparticles into embryos in real-time using our DFOMS, while adding purified Au nanoparticle solutions into the chamber to prepare the desired Au nanoparticle concentrations. The diffusion measurements were completed within minutes.To determine the biocompatibility of Au nanoparticles, we transferred the embryos into 24-well plates (two embryos per well) and incubated them with a series of washed (purified) Au nanoparticle solutions (2.00 mL per well of 0, 0.025, 0.05, 0.10, 0.20, 0.40, 0.60, 0.80, 1.0, 1.2 nM, which is 0, 0.53, 1.1, 2.1, 4.2, 8.4, 12.6 16.8, 21.0, 25.2 µg per well). The molar concentrations of Au nanoparticles are calculated as we described previously,27,28,42 and these molar concentrations can also be described as weight/volume concentrations (0, 0.26, 0.53, 1.1, 2.1, 4.2, 6.3, 8.4, 10.5, 12.6 µg mL−1). We also incubated embryos with egg water (in the absence of nanoparticles) and the supernatants from washing Au nanoparticles, which were carried out simultaneously as those incubated with Au nanoparticles, serving as control experiments for monitoring untreated embryos and determining possible effects of trace chemicals involved in the synthesis of nanoparticles, respectively. We incubated the embryos in the 24-well plates in a water bath at 28.5 °C, and observed them at room temperature using an inverted microscope (Zeiss Axiovert 100) at 24, 48, 72, 96, and 120 hpf. We acquired images of the normal, deformed and dead zebrafish at 120 hpf using a digital camera and a CCD camera. Each experiment was done at least four times and a total of 60–64 embryos for each experiment were studied to gain a sufficient amount of data for statistical analysis.
Imaging and characterization of Au nanoparticles in embryos and zebrafish
We imaged and characterized Au nanoparticles accumulated in living embryos using DFOMS as the cleavage-stage embryos were incubated with 1.2 nM Au nanoparticles for 4 h (Fig. 5B).We also characterized Au nanoparticles embedded in fully developed zebrafish that had been chronically incubated with a given concentration (1.2 nM) of nanoparticles for 120 h since their cleavage stage (Fig. 8). The treated zebrafish were rinsed with DI water to remove external nanoparticles, and fixed using a tissue processor (STP 120) and a tissue embedding center (Shandon Histocentre™ 3 Embedding Center) via a histology protocol of tissue sample preparation as described below.
The zebrafish were fixed using chemical fixation (formaldehyde), dehydrated by EtOH, infiltrated with Clear-Rite (isoparaffinic aliphatic hydrocarbons ), and finally embedded with paraffin , using a Microm STP-120 Spin Tissue Processor (Thermo Fisher Scientific). The tissue processor contains 12 buckets of solutions and a tissue sample holder that is controlled by computer programs to automatically move the tissue samples from a solution in one bucket to another in a desired manner. The solutions in the 12 buckets are arranged in the following order: buckets (i) and (ii): 10% buffered formalin for fixation; buckets (iii)–(viii): 50%, 70%, 95%, 100%, 100%, and 100% (v/v) of EtOH/water for dehydration, respectively; buckets (ix) and (x): Clear-Rite for removing EtOH from the tissue and infiltrating the tissue with Clear-Rite; buckets (xi) and (xii): paraffin at 60 °C for embedding the tissue with paraffin . We placed the zebrafish treated with nanoparticles (or supernatant or untreated, as control experiments) in histo-screen cassettes and transferred the cassettes to the sample holder of the tissue processor, which moved the samples from one bucket to the other, allowing the tissue of zebrafish to be fully immersed in the solution of each bucket for the desired duration (20–40 min) to complete the histology sample preparation.
For example, the zebrafish were first immersed in buckets (i) and (ii) for 20 min each to fully infiltrate the tissue of zebrafish with fixative. Note that formaldehyde reacts with the amine groups (–NH2) of tissue proteins and stabilizes the tissue in a fixed position. Dehydration was then performed to remove water from the tissue of zebrafish by fully immersing the samples into each of the solutions in buckets (iii)–(viii), for 20 min each. The samples were then fully immersed in buckets (ix)–(x) for 20 min each, which allowed Clear-Rite (a solvent miscible with the embedding medium, paraffin ) to completely replace the EtOH that remained inside the tissue. The samples were finally moved into the last two buckets (xi–xii) and fully immersed in each paraffin solution for 40 min each. The heat (60 °C) causes the Clear-Rite solvent to evaporate, creating spaces in the tissue of zebrafish, which were fully infiltrated with the heated paraffin . Note that it is crucial to completely remove water from the tissue by dehydration and fully infiltrate the tissue with Clear-Rite in order to appropriately embed the tissue with paraffin and to prevent the formation of holes in the tissue, allowing us to prepare ultra-thin-layer sections of tissue samples of zebrafish in the following steps.
We then moved the zebrafish with the histo-screen cassettes from the sample holder of tissue processor into a paraffin bath at 60 °C in the embedding center, and used the embedding center to prepare the tissue sample blocks. The embedding center includes a paraffin bath at 60 °C, a well-controlled nozzle system of the paraffin bath, a hot-plate at 45 °C, and a cold-plate at 0 °C. We added a thin layer of liquefied paraffin (60 °C) to the bottom of a small histological block mold using the nozzle system of the paraffin bath, removed one zebrafish from the histo-screen cassette to the block mold, and aligned the zebrafish in the desired position in the mold (either vertically or horizontally aligned with the bottom of the mold). The mold was placed on the hot plate (45 °C) to prevent the paraffin from hardening, allowing us to perform the alignment successfully. We then placed the mold on the top of the cold plate (0 °C), which immediately solidified the paraffin and locked the zebrafish in the desired position inside the paraffin block. We filled up the mold with the paraffin (60 °C), placed the histo-screen cassette on the top of the mold, and left it on the cold plate (0 °C) overnight, allowing the paraffin to solidify completely.
We sectioned the sample block (∼0.25–4 µm thickness) using a Microm HM360 rotary microtome (Thermo Fisher Scientific), and floated each section of the block in a DI water bath (40 °C), allowing the section to well spread over the water surface and create a smoother and flatter section. We then collected the samples using specially designed tissue slides, and dried the slides on a slide warmer (45 °C) overnight. After the slides were dried, we heated the slides in an upright position in an oven at 60 °C for 30 min, allowing the paraffin to slowly melt off the slides to remove the excess paraffin from the tissue.
The sections of the tissue embedded with nanoparticles were directly characterized using DFOMS (Fig. 8). LSPR spectra of individual nanoparticles offer chemical characterization of the nanoparticles (Fig. 2C). The methods that we have developed in this study and in our previous studies28 provide powerful new tools to determine and characterize individual nanoparticles embedded in tissues, and to image the tissues with embedded nanoparticles with no need of staining reagents.
Statistical analysis
Each experiment related to the study of biocompatibility and toxicity of Au nanoparticles was performed at least four times and a total of 60–64 embryos for each experiment were studied to gain sufficient data for statistical analysis, permitting the study of the effect of nanoparticles on a bulk amount of embryos at the single-embryo level. We present average percentages of normally developed, dead and deformed zebrafish vs. concentration of nanoparticles and supernatants (control), from all measurements, with their standard deviations, as shown in Fig. 6. We used conventional statistical analysis methods (t-test) to determine the significance of the different observations of normally developed, deformed and dead zebrafish between different concentrations (0–1.20 nM) of Au nanoparticles in Fig. 6A. We found significant differences of normally developed, deformed and dead zebrafish observed at 0.20 nM Au nanoparticle concentration from those observed in the absence of nanoparticles (0 nM, control experiments) with a confidence level of 90% (or P = 0.10). We observed a significant difference in the number of deformed zebrafish (but not normally developed or dead zebrafish) at 0.20 nM from those at other concentrations (0.40, 0.60, 0.80, 1.0, or 1.20 nM) with a confidence level of 90% (or P = 0.10), but no significant differences among other concentrations.We report all unique observations, especially rare deformed zebrafish, in Fig. 7C. We have never observed the deformed zebrafish in the absence of Au nanoparticles (control experiments). All rare events presented in this study are within the confidence level of 95% (or P = 0.05) for four sets of measurements (each with 15–20 embryos) at each nanoparticle concentration, analyzed using conventional statistical methods (e.g., t-test or Q-test). Note that study of embryos at the single-embryo level allows us to depict the rare event of interest, which otherwise would be buried under ensemble measurements, emphasizing the importance of the study of a bulk amount of embryos at the single-embryo level.
We investigated over 100 nanoparticles for each measurement of single nanoparticles to gain sufficient data for statistical analysis and for determining the size distribution and color distribution that represents the bulk nanoparticle solution at the single-nanoparticle resolution. We repeat all measurements, including characterization of photostability and LSPR spectra of single nanoparticles, control experiments, and analysis of concentrations of nanoparticle solutions, at least three times, and present representative and average data of all measurements with standard deviations. All measurements are very reproducible, well beyond the confidence level of 95% (or P = 0.05). Thus, we do not need to reject any data.
Summary
In summary, we have synthesized and characterized stable (photostable, non-aggregating), nearly monodisperse, and highly-purified Au nanoparticles, and utilized them to study cleavage-stage embryos in real-time and to probe their effects on embryonic development. We found that single Au nanoparticles passively diffused into the chorionic space of the embryos via their chorionic pore canals and continued their random-walk into inner mass of embryos. Diffusion coefficients of single nanoparticles range from 2.8 × 10⁻¹¹ to 1.3 × 10⁻⁸ cm2 s−1, as nanoparticles passively diffuse through various parts of embryos, suggesting highly diverse transport barriers and viscosity gradients of the embryos. A wide range of diffusion coefficients (3.9 × 10⁻¹⁰ to 1.3 × 10⁻⁸ cm2 s−1) of single nanoparticles in chorionic space suggests its high heterogeneity. We found that the amount of Au nanoparticles accumulated in embryos increases with its concentration. Interestingly, their effects on embryonic development show stochastic dependence on concentration. The majority of embryos (74% on average) chronically incubated with 0.025–1.2 nM Au nanoparticles for 120 h developed to normal zebrafish, with some (24%) being dead and a few (2%) deformed. This result is in stark contrast with what we reported previously for Ag nanoparticles,28 showing that Au nanoparticles are much more biocompatible with the embryos than Ag nanoparticles and suggesting that the biocompatibility and toxicity of nanoparticles depends on their chemical properties. We describe a new approach to image and characterize individual Au nanoparticles embedded in tissues using histology sample preparation methods and LSPR spectra of single nanoparticles. We found Au nanoparticles in various parts of normally developed zebrafish. Taken together, these interesting findings suggest that the random-walk (Brownian diffusion) of Au nanoparticles in embryos during their development (120 h) causes individual Au nanoparticles walking into different parts of embryos randomly, which might have led to stochastic effects on embryonic development. Work is in progress to further probe what causes the embryos to become normally developed, deformed (various types of deformation) or dead zebrafish, as they are incubated with nanoparticles.Acknowledgements
This work is supported in part by NSF (NIRT: BES 0507036; DMR 0420304) and NIH (R01 GM076440). Browning, Lee, Nallathamby, and Lowman are grateful for the support of NIH-GRAS (R01 GM076440S1), NSF-GRAS (BES 0541661), a Dominion Scholar Fellowship and an ODU honor college undergraduate fellowship, respectively. We thank CharFac of University of Minnesota (a NNIN site funded by NSF) for their assistance with the characterization of Au nanoparticles using HRTEM.References
- M. C. Daniel and D. Astruc, Chem. Rev., 2004, 104, 293 CrossRef CAS and references therein.
- D. A. Handley, in Colloid Gold: Principles, Methods and Applications, ed. M. A. Hayat, Academic Press, New York, 1989, vol. 1, ch. 1–2, pp. 1–32 Search PubMedand references therein.
- S. Schultz, D. R. Smith, J. J. Mock and D. A. Schultz, Proc. Natl. Acad. Sci. U. S. A., 2000, 97, 996 CrossRef CAS.
- X. H. N. Xu and R. P. Patel, in Imaging and Assembly of Nanoparticles in Biological Systems, ed. H. S. Nalwa, American Scientific Publisher, Stevenson Ranch, CA, 2005, vol. 1, pp. 435–456 and references therein Search PubMed.
- X.-H. N. Xu and R. P. Patel, in Nanoparticles For Live Cell Dynamics, ed. H. S. Nalwa, American Scientific Publisher, Stevenson Ranch, CA, 2004, vol. 7, pp. 189–192 Search PubMedand references therein.
- Y.-H. Chen, C.-Y. Tsai, P.-Y. Huang, M.-Y. Chang, P.-C. Cheng, C.-H. Chou, D.-H. Chen, C.-R. Wang, A.-L. Shiau and C.-L. Wu, Mol. Pharm., 2007, 4, 713 CrossRef CAS.
- C. J. Murphy, A. M. Gole, J. W. Stone, P. N. Sisco, A. M. Alkilany, E. C. Goldsmith and S. C. Baxter, Acc. Chem. Res., 2008, 41, 1721 CrossRef CAS and references therein.
- S. D. Perrault, C. Walkey, T. Jennings, H. C. Fischer and W. Chan, Nano Lett., 2009, 9, 1909 CrossRef CAS.
- R. Shukla, V. Bansal, M. Chaudhary, A. Basu, R. R. Bhonde and M. Sastry, Langmuir, 2005, 21, 10644 CrossRef CAS.
- E. E. Connor, J. Mwamuka, A. Gole, C. J. Murphy and M. D. Wyatt, Small, 2005, 1, 325 CrossRef CAS.
- J. A. Khan, B. Pillai, T. K. Das, Y. Singh and S. Maiti, ChemBioChem, 2007, 8, 1237 CrossRef CAS.
- Y. Pan, S. Neuss, A. Leifert, M. Fischler, F. Wen, U. Simon, G. Schmid, W. Brandau and W. Jahnen-Dechent, Small, 2007, 3, 1941 CrossRef CAS and references therein.
- C. L. Brown, M. W. Whitehouse, E. R. Tiekink and G. R. Bushell, Inflammopharmacology, 2008, 16, 133 CrossRef CAS and references therein.
- P. C. Ray, H. Yu and P. P. Fu, J. Environ. Sci. Health, Part C: Enivron. Carcinog. Ecotoxicol. Rev., 2009, 27, 1 Search PubMed and references therein.
- H. C. Fischer and W. C. Chan, Curr. Opin. Biotechnol., 2007, 18, 565 CrossRef CAS and references therein.
- U. Kreibig and M. Vollme, Optical Properties of Metal Clusters, Springer, Berlin, 1995, pp. 14–123 Search PubMedand references therein.
- Y. Sun and Y. Xia, Anal. Chem., 2002, 74, 5297 CrossRef CAS.
- C. F. Bohren and D. R. Huffman, Absorption and Scattering of Light by Small Particles, Wiley, New York, 1983, pp. 287–380 Search PubMedand references therein.
- G. Mie, Ann. Phys., 1908, 330, 377 CrossRef.
- P. Mulvaney, Langmuir, 1996, 12, 788 CrossRef CAS.
- K. S. Lee and M. A. El-Sayed, J. Phys. Chem. B, 2006, 110, 19220 CrossRef CAS.
- P. C. Lee and D. Meisel, J. Phys. Chem., 1982, 86, 3391 CrossRef CAS.
- K. L. Kelly, E. Coronado, L. L. Zhao and G. C. Schatz, J. Phys. Chem. B, 2003, 107, 668 CrossRef CAS and references therein.
- S. Kyriacou, W. Brownlow and X.-H. N. Xu, Biochemistry, 2004, 43, 140 CAS.
- X.-H. N. Xu, W. J. Brownlow, S. V. Kyriacou, Q. Wan and J. J. Viola, Biochemistry, 2004, 43, 10400 CrossRef CAS.
- X.-H. N. Xu, J. Chen, R. B. Jeffers and S. V. Kyriacou, Nano Lett., 2002, 2, 175 CrossRef CAS.
- T. Huang, P. D. Nallathamby, D. Gillet and X.-H. N. Xu, Anal. Chem., 2007, 79, 7708 CrossRef CAS.
- K. J. Lee, P. D. Nallathamby, L. M. Browning, C. J. Osgood and X.-H. N. Xu, ACS Nano, 2007, 1, 133 CrossRef CAS.
- P. D. Nallathamby, K. J. Lee and X.-H. N. Xu, ACS Nano, 2008, 2, 1371 CrossRef CAS.
- X.-H. N. Xu, Y. Song, and P. D. Nallathamby, in New Frontiers in Ultrasensitive Bioanalysis: Advanced Analytical Chemistry Applications in Nanobiotechnology, Single Molecule Detection, and Single Cell Analysis, ed. X.-H. N. Xu, Wiley, New York, 2007, pp. 41–65 Search PubMedand references therein.
- T. Huang, P. D. Nallathamby and X.-H. N. Xu, J. Am. Chem. Soc., 2008, 130, 17095 CrossRef CAS.
- M. Geiser, M. Casaulta, B. Kupferschmid, H. Schulz, M. Semmler-Behnke and W. Kreyling, Am. J. Respir. Cell Mol. Biol., 2007, 38, 371 Search PubMed and references therein.
- B. Rothen-Rutishauser, R. N. Grass, F. Blank, L. K. Limbach, C. Muhlfeld, C. Brandenberger, D. O. Raemy, P. Gehr and W. J. Stark, Environ. Sci. Technol., 2009, 43, 2634 CrossRef CAS and references therein.
- J. Hertog, Biosci. Rep., 2005, 25, 289 CrossRef CAS.
- A. J. Hill, H. Teraoka, W. Heideman and R. E. Peterson, Toxicol. Sci., 2005, 86, 6 CrossRef CAS.
- P. Kahn, Science, 1994, 264, 904 CrossRef CAS.
- H. Teraoka, W. Dong and T. Hiraga, Congenital Anom., 2003, 43, 123 Search PubMed.
- L. I. Zon and R. T. Peterson, Nat. Rev. Drug Discovery, 2005, 4, 35 CrossRef CAS.
- Z. Gong and V. Korzh, Fish Development and Genetics: The Zebrafish and Medaka Models, World Scientific Publishing Co., Singapore, 2004, vol. 2, pp. 87–424 Search PubMedand references therein.
- Y. W. Kunz, Developmental Biology of Teleost Fishes, Springer, Netherlands, 2004, pp. 267–428 Search PubMed.
- W. S. Hoar and D. J. Randall, Fish Physiology: The Physiology of Developing Fish, Part A, Eggs and Larvae, Academic Press, New York, 1988, pp. 1–48 Search PubMed.
- X.-H. N. Xu, S. Huang, W. Brownlow, K. Salatia and R. Jeffers, J. Phys. Chem. B, 2004, 108, 15543 CrossRef CAS.
- D. M. Rawson, T. Zhang, D. Kalicharan and W. L. Jongebloed, Aquac. Res., 2000, 31, 325 CrossRef.
- Y. Sako and A. Kusumi, J. Cell Biol., 1994, 125, 1251 CrossRef CAS and references therein.
- A. Kusumi, Y. Sako and M. Yamamoto, Biophys. J., 1993, 65, 2021 CrossRef CAS.
- I. Tinoco, K. Sauer, J. Wang, and J. D. Puglisi, Physical Chemistry—Principles and Applications in Biological Sciences, Prentice Hall, New Jersey, 2002, pp. 274–290 Search PubMed.
- X.-H. N. Xu, R. B. Jeffers, J. Gao and B. Logan, Analyst, 2001, 126, 1285 RSC.
- A. J. Bard and L. R. Faulkner, Electrochemical Methods Fundamentals and Applications, Wiley, New York, 1980, pp. 488–510 Search PubMed.
- S. V. Kyriacou, M. E. Nowak, W. J. Brownlow and X.-H. N. Xu, J. Biomed. Opt., 2002, 7, 576 CrossRef CAS.
- X.-H. N. Xu, W. J. Brownlow, S. Huang and J. Chen, Biochem. Biophys. Res. Commun., 2003, 305, 79 CrossRef.
- M. Westerfield, The zebrafish book: A Guide for the Laboratory Use of Zebrafish (Danio Rerio*), University of Oregon Press, Eugene, OR, 1993, ch. 1–4, (http://zfin.org/zf_info/zfbook/zfbk.html) Search PubMed.
Footnotes |
| † Electronic supplementary information (ESI) available: Summary of deformed zebrafish and characterization of purified Au nanoparticles. See DOI: 10.1039/b9nr00053d |
| ‡ These authors contributed equally to this work. |
| This journal is © The Royal Society of Chemistry 2009 |