Computer-enhanced high-throughput genetic screens of C. elegans in a microfluidic system†
Matthew M.
Crane
a,
Kwanghun
Chung
b and
Hang
Lu
*ab
aInterdisciplinary Program in Bioengineering, Georgia Institute of Technology, Atlanta, GA, USA
bSchool of Chemical & Biomolecular Engineering, Georgia Institute of Technology, 311 Ferst Dr. NW, Atlanta, GA, USA. E-mail: hang.lu@gatech.edu; Tel: +1-404-894-8473
First published on 27th October 2008
Abstract
Most visual screens based on fluorescent markers are currently limited in throughput and accuracy. Here we present the first genetic screen of a mutagenized population of C. elegans in a microfluidic device. Animal handling streamlined by a microfluidic device and intuitive control software enabled the identification of novel mutants and a large screening speed.
In forward, reverse, and chemical genetics for multicellular organisms,1–4 fluorescent reporter-based screens are common techniques. In the nematode C. elegans, often one is interested in changes to a specific phenotype based on morphology, reporter intensity, location, or patterns.4–6 Current standard approaches to these screens include manual microscopy, which is slow,1 and a commercial system with high-throughput but limited resolution.7,8 Recent work has shown that microfluidics can greatly assist animal handling,9–13 and that it is possible to sort animals based on well-defined phenotypes.11 Microfluidic systems, however, have yet to be applied to screen a mutagenized population of animals to discover novel mutants. In many high-throughput screening applications, phenotypes need to be sorted that have not been determined a priori or are not easily defined. To meet this challenge, we devised a computer-enhanced microfluidic screening system for phenotypical screens of C. elegans.
Previously we demonstrated a fully automated system utilizing machine learning and classification to sort mixed animal populations of predetermined phenotypes.11 While computers are accurate in quantifiable traits, human decision-making is often superior in pattern-recognition and classification in complex situations, as those in many screens of previously unidentified mutants. Additionally, programming for machine learning is outside the purview of many potential users, and most biologists would prefer to have access to a simple program that would allow screening by a person. To take advantage of the human flexibility and the computer quantitation, we developed a computer-assisted methodology using Matlab®14 to allow an expert to determine in real-time, whether animals being screened are of interest. Using this software control interface (Fig. 1a), preconfigured image processing modules can be selected if needed to help clarify and accentuate phenotypical characteristics. While animals clearly exhibiting no interesting phenotypes can be dismissed quickly, potential mutants can be examined in greater detail using the image processing modules on the same user-interface. When a worm is in the field of view, one of over forty combinations of image processing options can be selected and subtle phenotypes emphasized.
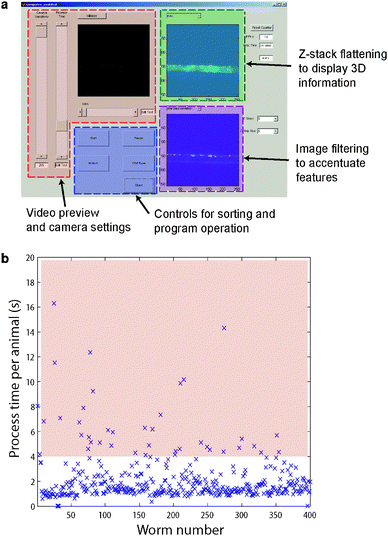 | ||
| Fig. 1 Computer-control, computer-enhanced image processing for fast screen of C. elegans. (a) The computer control interface. The video feed is shown in the top left box, and image processing steps can be selected, applied and displayed in the boxes on the right. Animals are sorted as either wild-type or mutant by selecting the appropriate button. If an image is unclear, pictures can be acquired at multiple focal planes and processed using selected image processing modules. (b) A representative sequence of total processing time per animal, showing robust and easy animal handling and processing in the device. Animals of potentially interesting phenotypes are examined in detail, typically taking more than 4 s each (shaded in pink), while the majority of animals are processed in <2 s. | ||
For markers that are out of focus, one option is to acquire a small z-stack of images at different focal planes (with user-determined step size and number), and either autofocus or flatten the z-stack before further processing the images. This significantly reduces the time relative to manual focusing of the microscope and searching for the reporter, and potentially avoiding photobleaching of the markers. There are eleven image-filtering options to accentuate features of interest, which tend to be dim or low in contrast to human eyes, but the phenotypes become more obvious with image enhancement.
Animals possessing interesting phenotypes usually take longer than four seconds to examine, but because these animals are rare, the throughput of this system is much higher than any pre-existing technology of similar resolution (Fig. 1b).
Our hardware system takes advantage of the higher magnification and higher numerical aperture of a compound microscope and the simple and streamlined animal handling of a novel microfluidic device. The chip is a two-layer polydimethylsiloxane device15 with a positioning control valve and two outlets (Fig. 2a, b). The fluid flow and worm-loading are pressure driven. Animals are reliably positioned within the field of view of the camera (supplementary Movie 1).† When the circular valve is pressurized, it only closes partially allowing fluid flow to continue but creating a cross-section too small for the animals to pass. At the same time, the valve controlling the wild-type outlet is left open most of the time to allow fluid to exit in order to load animals for rapid processing. This mechanism reduces the number of valve operations since mutants are rare events. To further increase throughput and simplify the sample-handling procedure, animals were not deliberately immobilized by cooling or pressure, as screening with a 20x objective with a relatively bright marker does not require complete immobilization. To reduce the likelihood of another worm entering the field of view when one is already loaded, we designed the device geometry such that the presence of a worm in the imaging channel increases the resistance of flow significantly and thus reducing the flow by an order of magnitude (supplementary Fig. 1).† This design allows efficient and well-controlled loading of animals, even with size variations resulted from the mutagenesis. The device also has a minimum feature size of 30 µm to reduce the likelihood of clogging. This design is simpler compared with our previous device used for high-resolution imaging and sorting,11 and has a larger tolerance to minimize the consequences of poor feature registration (either rotational or translational). This should allow the device to be easily duplicated by users unfamiliar with microfluidics. Additional details on the hardware and software control are available in the supplementary materials.†
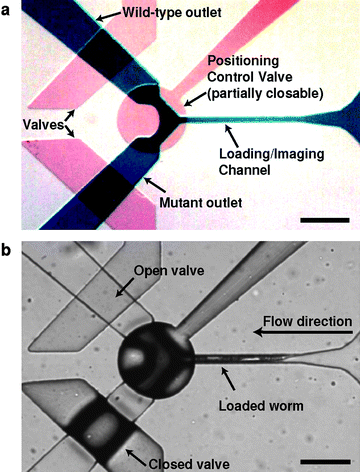 | ||
| Fig. 2 Microfluidic device for rapid screening. (a) Optical micrograph of the device active region. Channels are filled with dyes to reveal key features: blue, sample flow layer; red, valves. (b) A frame from a video showing a worm being loaded into the field of view for imaging. Scale bars are 250 µm. | ||
This phenotyping and sorting process is gentle, and in our experiments, 100% of animals were viable, crawling on agar and thrashing in buffer normally immediately after the processing. To load an animal into the imaging chamber, the outlet channel for wild-type animals is left open, while the positioning control valve and mutant channel valves are closed. This allows fluid flow to continue and carry a worm into the field of view of the camera, until its head pushes against the positioning control valve. The presence of the worm significantly increases the fluid resistance of the channel, so the flow is dramatically reduced, preventing another worm from entering. If the worm is clearly wild-type or mutant, the user selects the “Wild-Type” or “Mutant” buttons on the control interface. If wild-type, the positioning valve opens and allows the worm to be released. If mutant, the wild-type outlet is closed and the mutant channel and position valve are opened. The mutant channel and positioning valve are then reset to the closed position for the next animal.
Next we demonstrate the power of this computer-enhanced approach in a successful screen of an ethyl-methanesulfonate (EMS16)-mutagenized C. elegans population carrying a synaptic reporter punc-25-YFP::RAB-5.17 We show that most animals can be processed in <2 s, and sorting was achieved at rates up to 2500 animals per hour and at a sustained rate of at least 1500 per hour. From a screen of ∼15,000 mutagenized worms, we identified a number of novel mutants that appeared different from wild-type (Fig. 3). The identification of these mutants was greatly facilitated by applying the auto-z-stack and autofocusing (Fig. 3 d–f) and the many filters (Fig. 3g–l). One class of mutants involved changes in the localization of the reporter yellow fluorescent protein (YFP) localization along the nerve cord and significant numbers of punctuated structures (Fig. 3b,e,h,k), and another class showed a dramatically reduced expression of YFP (Fig. 3c,f,i,l). Some of the mutants would have been difficult to identify using conventional methods.
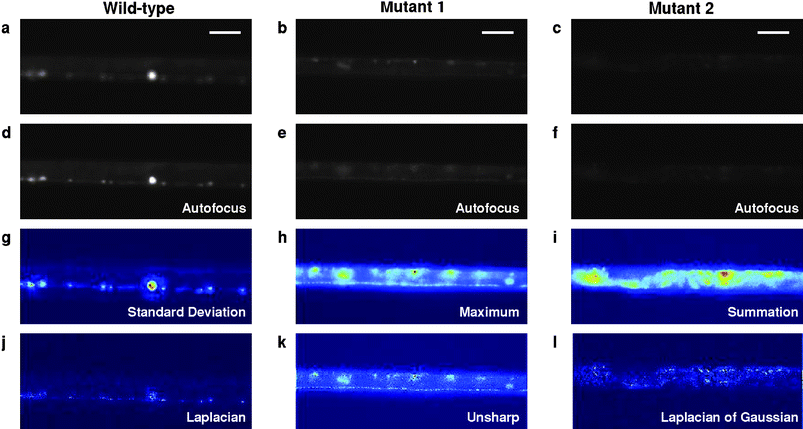 | ||
| Fig. 3 Computer-assisted phenotyping to identify mutants of interest. (a,d,g,j) Wild type. (b,e,h,k) Apparent synaptic mutant showing altered reporter expression along the nerve cord and puncta structures. (c,f,i,l) Mutant showing reduced YFP expression. (a–c) Images of animals that entered, not necessarily in focus and potentially rotated, resulting in an unclear image of the region of interest. (d–f) Images determined to be in focus by computer after a series of images at different focal planes were acquired. (g–i) Selected alternative methods of viewing z-stack by flattening the matrix of images. (g) Flattening by taking the standard deviation of the z-stack at each x-y location. (h) Flattening using the maximum value at each x-y location. (i) Flattening by taking the summation in the z-direction at each x-y location. (j–l) Applying a few of the image processing features to the flattened image to accentuate different features. (j) Laplacian filter. (k) Unsharp filter. (l) Laplacian of Gaussian filter. Scale bars 30 µm. | ||
The computer-enhanced microfluidic approach we have demonstrated here has many advantages: (1) computer-assisted screening to accentuate phenotypical characteristics, which may be missed by manual screens, (2) human decision-making to allow flexibility if presented with a novel phenotype, (3) preconfigured image processing modules for minimal algorithm-development time, (4) at least an order of magnitude greater throughput than current manual screening, (5) higher magnification, higher numerical aperture optics than commercial or some manual screening systems, (6) almost three orders of magnitude less expensive than commercial systems, and (7) simple assembly and operation for use by technicians with little or no familiarity with microfluidics. These advantages should enable new types of screens in the near future.
Acknowledgements
The authors acknowledge the National Science Foundation (DBI-0649833) and National Institutes of Health (NS058465) for funding, and Y. Jin (UCSD) for the strain, and J. Stirman for technical assistance. M.M.C. is an NSF graduate fellow.Notes and references
- E. M. Jorgensen and S. E. Mango, Nat Rev Genet, 2002, 3, 356–369 CrossRef CAS.
- J. K. Kim, H. W. Gabel, R. S. Kamath, M. Tewari, A. Pasquinelli, J. F. Rual, S. Kennedy, M. Dybbs, N. Bertin, J. M. Kaplan, M. Vidal and G. Ruvkun, Science, 2005, 308, 1164–1167 CrossRef CAS.
- B. R. Stockwell, Nat Rev Genet, 2000, 1, 116–125 CrossRef CAS.
- A. Fire, S. Q. Xu, M. K. Montgomery, S. A. Kostas, S. E. Driver and C. C. Mello, Nature, 1998, 391, 806–811 CrossRef CAS.
- M. Zhen and Y. Jin, Nature, 1999, 401, 371–375 CAS.
- K. Shen and C. I. Bargmann, Cell, 2003, 112, 619–630 CrossRef CAS.
- E. E. M. Furlong, D. Profitt and M. P. Scott, Nat Biotech, 2001, 19, 153–156 CrossRef CAS.
- D. Dupuy, N. Bertin, C. A. Hidalgo, K. Venkatesan, D. Tu, D. Lee, J. Rosenberg, N. Svrzikapa, A. Blanc, A. Carnec, A.-R. Carvunis, R. Pulak, J. Shingles, J. Reece-Hoyes, R. Hunt-Newbury, R. Viveiros, W. A. Mohler, M. Tasan, F. P. Roth, C. Le Peuch, I. A. Hope, R. Johnsen, D. G. Moerman, A.-L. Barabasi, D. Baillie and M. Vidal, Nat Biotech, 2007, 25, 663–668 CrossRef CAS.
- N. Chronis, M. Zimmer and C. I. Bargmann, Nature Methods, 2007, 4, 727–731 CrossRef CAS.
- C. B. Rohde, F. Zeng, R. Gonzalez-Rubio, M. Angel and M. F. Yanik, PNAS, 2007, 104, 13891–13895 Search PubMed.
- K. Chung, M. M. Crane and H. Lu, Nat Meth, 2008, 5, 637–643 CrossRef CAS.
- S. X. Guo, F. Bourgeois, T. Chokshi, N. J. Durr, M. A. Hilliard, N. Chronis and A. Ben-Yakar, Nat Meth, 2008, 5, 531–533 CrossRef CAS.
- S. E. Hulme, S. S. Shevkoplyas, J. Apfeld, W. Fontana and G. M. Whitesides, Lab on a Chip, 2007, 7, 1515–1523 RSC.
- Matlab® code can be obtained by contacting the authors.
- M. A. Unger, H. P. Chou, T. Thorsen, A. Scherer and S. R. Quake, Science, 2000, 288, 113–116 CrossRef CAS.
- EMS is a mutagen and should be handled with care.
- B. Grill, W. V. Bienvenut, H. M. Brown, B. D. Ackley, M. Quadroni and Y. Jin, Neuron, 2007, 55, 587–601 CrossRef CAS.
Footnote |
| † Electronic supplementary information (ESI) available: Details regarding the device fabrication and operation are included as well as a movie showing the device operation. See DOI: 10.1039/b813730g |
| This journal is © The Royal Society of Chemistry 2009 |