CO2 and compressive immobilization of C. elegans on-chip†
Trushal Vijaykumar
Chokshi
a,
Adela
Ben-Yakar
b and
Nikos
Chronis
cd
aDepartment of Electrical Engineering and Computer Science, University of Michigan, Ann Arbor, MI 48109, USA
bDepartment of Mechanical Engineering, The University of Texas at Austin, Austin, Texas 78712, USA
cDepartment of Mechanical Engineering, University of Michigan, Ann Arbor, MI 48109, USA. E-mail: chronis@umich.edu
dDepartment of Biomedical Engineering, University of Michigan, Ann Arbor, MI 48109, USA
First published on 21st October 2008
Abstract
We present two microfluidic approaches for immobilizing the roundworm C. elegans on-chip. The first approach creates a CO2 micro-environment while the second one utilizes a deformable PDMS membrane to mechanically restrict the worm's movement. An on-chip ‘behavior’ module was used to characterize the effect of these methods on the worm's locomotion pattern. Our results indicate that both methods are appropriate for the short-term (minutes) worm immobilization. The CO2 method offers the additional advantages of long-term immobilization (1–2 hours) and reduced photobleaching, if fluorescent imaging during immobilization is required. We envision the use of these methods in a wide variety of biological studies in C. elegans, including cell developmental and neuronal regeneration studies.
Introduction
C. elegans, a soil roundworm with a complete sequenced genome, has been a powerful model organism for studying the genetics of various biological processes, extending from cell apoptosis and aging to neural plasticity and mating behavior.1–4 Immobilization of the tiny worm (∼40–50 µm in diameter and 1 mm long) constitutes an important step for performing laser ablations of neurons for studying neural networks and axon regeneration,5–7 monitoring neuronal responses at the presence of various stimuli,8 analyzing the nematode's anatomical features9 and imaging cellular development and gene expression.10 Conventional techniques for immobilizing the worm typically incorporate the use of glue11,12 or anesthetic compounds.13,14 Although, such methods have been successfully used in the past, they have certain limitations. The ‘glue’ method is a single-worm and therefore labor-intensive, low-throughput technique that makes the immobilization of a large number of worms impractical. Moreover, it is not a reversible process as the worm cannot be released once glued. On the contrary, anesthetic compounds can be used to immobilize large population of worms, but their effect to the worm's neuro-muscular system and their overall toxicity is unknown. This is an important limitation especially when the worm needs to be recovered and further studied.15 Therefore, novel immobilization techniques that are reversible, minimally toxic and easy to implement would be a great tool for better understanding the various biological process in C. elegans as well as for performing experiments in a large population of worms.The unique ability of microfluidics to handle small-size biological objects, motivated scientists to design a variety of microfluidic devices for the precise manipulation of C. elegans. Worm microtraps have been successfully used for correlating interneuronal activity with locomotion patterns as well as for imaging olfactory responses.16,17 Micro-arrays of fixed-size clamps for immobilizing large populations of individual worms have also been developed.18 A two-step single worm immobilizing approach utilizing suction posts19 and its improved version integrating a deformable membrane for stable worm immobilization has also been proposed.20 In all above studies, the worms were immobilized for short period of time (seconds) and the effect of immobilization on the behavior of the worm—as a direct indication of the worm's physiological condition—was not tested.
In this work, we developed a microfluidic device for immobilizing single worms and characterizing on-chip the effect of immobilization to the worm's behavior (figure 1). We explored two approaches for immobilizing worms on-chip: (i) the first approach creates a CO2 micro-environment to cease the worm's movement and it proved to be efficient for the long term worm immobilization (1–2 hours) (ii) the second approach utilizes a deformable membrane to mechanically restrict the worm15,20 and it is appropriate for immobilizing the worm for shorter periods of time (minutes).
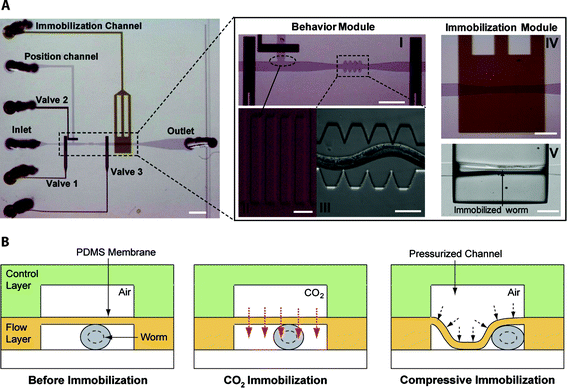 | ||
| Fig. 1 (A) The microfluidic device consists of the behavior (pictures I, II and III) and immobilization modules (pictures IV and V). The saw shape channel (III) is used to facilitate the revitalization of the worm and the on-chip quantification of the worm's locomotion pattern. PDMS pillars (II) do not allow the worm to enter the position channel. When high pressure (25 psi) is applied to the immobilization channel the worm is compressed on the microfluidic sidewalls (V). Scale bar, 1 mm (left picture). Scale bars are 300 µm, 500 µm, 10 µm, 100 µm, 300 µm for pictures I–IV respectively. (B) Immobilizing the worm by passing a CO2 stream or by pressurizing the immobilization channel (control layer). | ||
Both techniques can be used to immobilize worms of different age groups (L4's to adults). The proposed techniques are easy to implement and allow worm recovery within a few seconds after immobilization. Moreover, the device architecture of the two techniques allow to optically access the worm through a glass coverslip and thus these techniques are compatible with high resolution optical microscopy.
Experimental design
The two immobilization techniques share the same microfluidic design and fabrication process. The design incorporates the well-established two-layer PDMS ‘flow-control’ channel architecture.21 The device integrates two distinct modules (figure 1A): (i) the ‘behavior’ module that is used to revitalize the worm after immobilization by mechanically stimulating it. It consists of a saw-shape microchannel that forces the worm to move in a sinusoidal pattern so that its locomotion can be further analyzed, (ii) the second module (figure 1B), the ‘immobilization’ module, creates either a CO2 micro-environment or mechanically compresses the worm (‘compressive’ immobilization) so that further manipulations (e.g. laser ablation) and imaging can be performed.The CO2 micro-environment is created by passing pure CO2 through the control layer and diffuses through the PDMS membrane into the flow layer. The high permeability of PDMS to nonpolar gases22 results in the fast replacement of air with CO2. The PDMS membrane is 30 µm thick and shows minimum deflection at moderate pressures (∼69 kPa (10 psi)) exerted by CO2.
The compressive immobilization approach utilized the deflection of a thin PDMS membrane to restrict the worm's movement, when high pressure (∼172 kPa (25 psi)) is applied to the control channel. At such high pressures, the thin membrane collapses onto the worm squeezing it into the side of the microfluidic channel (see ESI movie 1†). In order to achieve large membrane deflections, a 20:1 PDMS mixing ratio is used for fabricating the flow layer. This reduces the PDMS elastic modulus by a factor of two23 when compared to the 10:1 ratio used for the flow layer. The width of the microchannel in the immobilization module is made wider (110 µm) than the width of the saw-shape microchannel (90 µm) to allow large membrane deflections.
Worms are loaded into the main flow channel of the chip and manipulated by activating the integrated microfluidic valves (valves 1, 2 and 3 in figure 1) via the control channel. A separate channel (the ‘position’ channel) perpendicular to the main loading channel was used to position the worm inside the behavior and immobilization modules. In order to prevent the worm from entering the position channel, PDMS pillars (figure 1A (II)) are fabricated at its intersection with the loading channel.
Results and discussion
To validate the effectiveness of proposed microfluidic methods to immobilize individual worms and to quantify the impact of such methods on the worm locomotion, we recorded on-chip the movement of the worm body. The experimental procedure consists of five steps (figure 2): individual worms are initially loaded into the behavior module for pre-immobilization behavior quantification, then positioned into the immobilization module and finally transferred back into the behavior module for post-immobilization behavior quantification. To control the worm's exact position inside the saw-shape region of the behavior module, we manually adjusted the pressure in the position channel. Worms (young adults) inside the behavior module were slightly compressed in the vertical direction and thus they were not able to escape. Worms were immobilized using air pressure of ∼ 172 kPa (25 psi) or CO2 supply at 69 kPa (10 psi).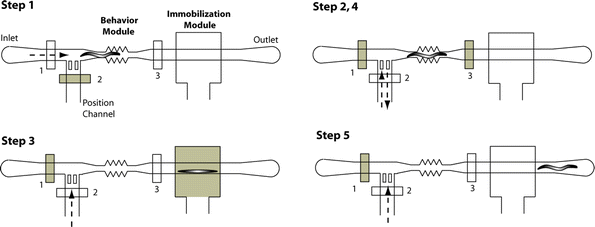 | ||
| Fig. 2 Sequence of events (five steps) for the on-chip characterization of the worm locomotion activity: 1) the worm is loaded inside the flow channel (valve 2 is closed), 2) the worm is positioned inside the behavior module by controlling the flow in the position channel (valves 1 and 3 are closed), 3) the worm is pushed into the immobilization module (valve 3 is open). The worm is immobilized by pressurizing the immobilization channel in the control layer with air (25 psi) or by applying CO2 (10 psi), 4) the worm is released and sent back into the behavior module (valves 1 and 3 are closed), 5) the worm is forced out of the chip by applying positive pressure into the position channel (valve 3 is open). It should be mentioned that all valves are partially closed when activated, allowing flow through them. That ‘leaky’ operation is typical for valves of rectangular cross-section.20 | ||
We tracked the displacement over time of a small region (10 µm × 10 µm) of the worm body (figure 3) before, during and after immobilization. We avoided the use of fluorescent markers (e.g. GFP) for tracking the worm body motion to eliminate radiation damage that could cause locomotion abnormalities. Worms were active before immobilization and maintained completely immobile at the presence of CO2 or when pressure was applied (immobilization periods up to 1 hour were performed). During the immobilization period, abrupt displacement peaks of 1.6 µm were observed. We attributed these peaks to movement artifacts generated by the tracking software. None of the methods affected the worm locomotion pattern when short immobilization periods (∼1 min) were considered. The CO2 method proved to be superior for long immobilization periods (>30 min) as the worm showed similar locomotion pattern before and after immobilization.
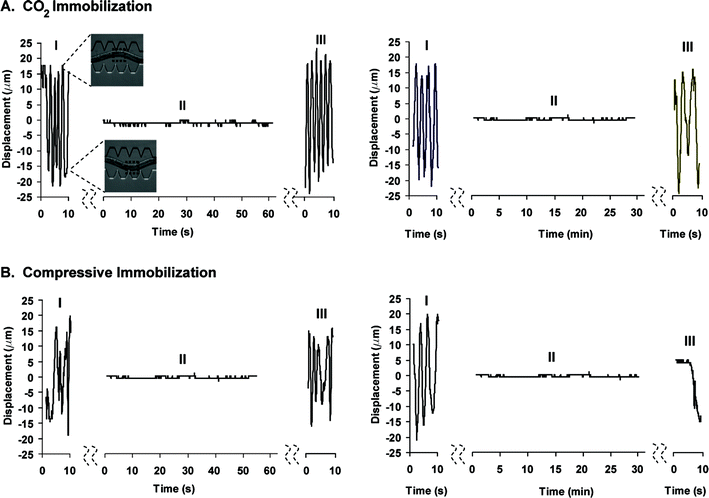 | ||
| Fig. 3 Characterization of the worm's locomotion pattern after subjecting it to CO2 and compressive immobilization for a period of 1 min and 30 min. Graphs indicate the vertical displacement of a 10 µm × 10 µm rectangular area (shown in the upper left figure) in the mid-portion of the worm's body before (I), during (II) and after (III) immobilization. | ||
A second set of experiments was performed to quantify the off-chip worm behavior after immobilization. Worms were flushed out of the chip to a food-free agar plate after immobilizing them for different time intervals and their average speed was measured (figure 4). As no food was present during immobilization, worms were in their dispersal state while on the agar plate. The dispersal state is initiated after prolonged starvation (>5–10 min off food) and it is identified by the significant decrease in the number of short and long reversal as well as omega turns.24 The corresponding control experiment was performed by loading worms into the chip and flushing them out on an agar plate without immobilizing them.
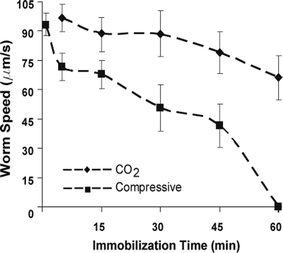 | ||
| Fig. 4 Post-immobilization worm locomotion speed on a food-free agar. The horizontal axis represents the duration of the immobilization step. Worms that were subjected to compressive immobilization for 1 hour did not show any locomotion activity (zero speed). Worms before immobilization (control experiment) had an average speed of 95 µm/s (data not shown). Errors bars represent SEM from 8 worms. | ||
We observed that the average speed of the worms on the plate decreased as the immobilization period increased. Immobilization periods of 1 hour resulted zero average speed (immobile worms) and speed reduction of ∼70% for the compressive and CO2 immobilization methods respectively. It should be noted that neither methods resulted in the death of worms for the tested conditions. Worms appeared to slowly recover after left on the agar plate for a few hours. Furthermore, we investigated the effect of longer CO2 immobilization periods (up to 4 hours) to the worm's survival. Worms immobilized up to 2.5 hours recovered completely as they were observed to behave normally on the bacterial lawn. Worms immobilized for more than 3 hours did not show any recovery.
We also observed that worms were completely immobilized within 1–2 minutes upon CO2 application. Such a delay (1–2 min) was attributed to the time that is needed for CO2 to diffuse into the microfluidic chamber and partially remove the air content from the worm's body. To validate that hypothesis, we measured the concentration of CO2 and O2 in the immobilization module. The concentration of CO2 was measured using a pH sensitive dye (thymol blue) while the concentration of O2 was measured using an oxygen sensitive, fluorescent dye (tris(4,7-diphenyl-1,10-phenanthrolin) RU dichloride complex). Within 1 min of CO2 application, the CO2 and O2 concentrations reached an equilibrium level of ∼76% and 6–7% respectively. It should be emphasized that the immobilized channel (in the control layer) is closed at its end, not allowing a fresh CO2 stream to continuously circulate through the chip. We believe that such a design of the immobilization channel (closed at its end) along with the leakage through the fluidic interconnections of the setup and the open architecture of the chip (the chip is exposed to air) are the major sources for not achieving an oxygen-free environment.
Several studies have reported the use of CO2 as an anesthetic for invertebrates with an almost immediate recovery upon its removal,25 but the molecular mechanism underlying its anesthetic action is unclear. As CO2 is known to reduce the pH of an aqueous environment, it has been hypothesized that CO2 creates an intracellular acidic environment resulting in the deformation of transmembrane proteins and modification of the cell membrane permeability. However, a recent study in Drosophila melanogaster does not support that argument.26 The presence of CO2 was shown to inhibit the synaptic transmission at the neuromuscular junctions (NMJs) by reducing their sensitivity to glutamate receptors. Other studies hypothesized that CO2 has an effect on acetylcholine and quantify the effect on dopamine and octopamine neurotransmitters.27,28 As these molecular mechanisms have been conserved in C. elegans, we anticipate that the CO2 anesthesia directly affects the NMJ transmission properties.
At the sensory level, CO2 was recently implicated in affecting neuronal functionality in C. elegans through several regulatory molecules.29,30 A CO2 avoidance behavior in well-fed nematodes was found to be mediated by cGMP signaling through the DAF-11 receptor and the TAX-2/TAX-4 cGMP-gated channel. On the contrary, a reduced CO2 avoidance behavior in starved worms was found to be regulated by insulin and TGFβ pathways.
To identify whether the low-oxygen environment (6–7% O2) or the presence of CO2 resulted in the immobilization of the worms, we replace CO2 with pure N2. The presence of N2 considerably slowed down the worm's movement but it did not immobilize them completely. This is consistent with the fact that worms are still mobile at low-oxygen concentration environments.31 We thus believe that the presence of CO2 and the low-oxygen environment act synergistically in altering the functionality of the worm's neuromuscular system.
Furthermore, the absence of oxygen is known to reduce photobleaching of fluorescent markers32 and therefore the CO2 immobilization method can be appropriate for long-term fluorescence imaging experiments such as time-lapse imaging of cell development. Photobleaching due to the removal of O2 was quantified by fluorescent imaging of GPF-expressing motorneurons (figure 5). Worms were immobilized using the two proposed methods and the fluorescent intensity of the neuronal cell body was continuously recorded for 4 min. At the low-oxygen environment, a 20% reduction in the fluorescent intensity was observed, significantly smaller than the 55% reduction observed during compressive immobilization.
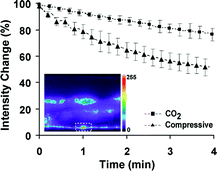 | ||
| Fig. 5 Photobleaching curves of GFP-expressing neurons during CO2 and compressive immobilization. Plot shows the percentage change in the cell body fluorescence intensity with respect to the intensity measured at time t = 0. Error bars represent SEM from 8 worms. The dashed white rectangle in the picture denotes the position of one of the VA motorneurons where fluorescence was measured. | ||
In order to show the applicability of CO2 immobilization method for long-term fluorescence imaging, we visualized the movement of bivalent chromosomes in the gonadal cells undergoing meiotic prophase. The bivalent chromosomes undergo restructuring during the late meiotic prophase33 and the ability to visualize the chromosomal movements during this cell cycle may facilitate the understanding of the chromosomal restructuring process. The chromosomal movements were observed in nematodes expressing GFP in the H2B histone proteins. The gonadal cells undergoing meiotic prophase were imaged continuously for a period of 10 minutes (see supplementary movie 2, ESI†). We tracked the movement of the bivalent chromosome (figure 6A) and measured its displacement relative to that of the cell over time (figure 6B). It should be noted that there was no significant photobleaching observed, despite the continuous 10-min illumination.
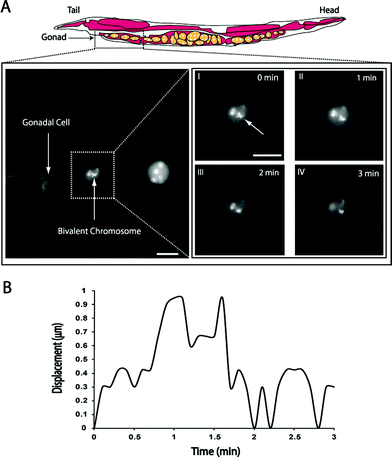 | ||
| Fig. 6 (A) Fluorescent images of gonadal cells undergoing meiotic prophase. Pictures I–IV represent the position of a bivalent chromosome at different time instants, (B) the graph indicates the total displacement of a single bivalent chromosome from its initial position (at t = 0 min) relative to the displacement of the cell. Images were obtained with a 100x oil immersion objective. Scale bar is 2 µm in all images. | ||
Conclusions
We developed two microfluidic methods for immobilizing C. elegans and characterized their impact on the worm's behavior. The first method uses CO2 to immobilize the worm while the second one mechanically compresses the worm through the use a deformable PDMS membrane. Both methods are easy to implement, allow worm recovery and can be used to immobilize worms of different ages (figure 7). The microfluidic device also incorporates a behavior module that revitalizes the worm and enables the on-chip characterization of its behavior. Our results indicate that the compressive and CO2 methods are appropriate for short-term (minutes) and long-term (1–2 hours) immobilization respectively.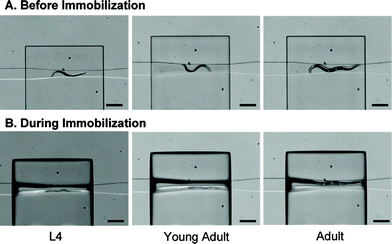 | ||
| Fig. 7 Images of worms of different ages (and thus of different sizes) before and during compressive immobilization. Scale bar is 500 µm. | ||
We anticipate that the proposed immobilization approaches can have an impact in a variety of applications, including neuron ablation for studying axon regeneration and neural circuits and time lapse imaging for studying cell development. Both methods can be further applied to accurately identify mutant phenotypes in genetic screening experiments10 or quantify gene expression over time. The CO2 method offers the advantage of long-term fluorescent imaging due to the creation of low-oxygen environment that reduces fluorescent photobleaching. Furthermore, the proposed methods can be automated to immobilize large number of worms in a serial manner,34 thus making them attractive tools for various high-throughput screening applications.
Experimental methods
Device fabrication
Soft lithography 21,22 was used to fabricate the microfluidic device. The flow and control channels were patterned on two different silicon wafers by spinning SU-8 2025 and SU-8 2050 at a thickness of 30 µm (2750 rpm) and 70 µm (1750 rpm) (Microchem Corp., Newton, MA, USA) respectively. PDMS was poured onto the two SU-8 masters to create the control (1 cm thick) and flow (70 µm thick, spun at 1100 rpm) layers. The control PDMS layer was peeled off from the SU-8 mold and subsequently aligned and air plasma bonded (50 W, 250 mtorr, 35 s) to the flow PDMS layer. The two-layer PDMS replica was then peeled off from the silicon substrate and punched with using a sharpened, 19-gauge needle (0.031 inch I.D., O.D: 0.042 inch O.D.; Kathetics) to form the fluidic inlets and outlets. Finally, the PDMS slab was bonded to a glass coverslip (#1.5) using air plasma. Access to the flow and control layers was provided by using polyvinyl tubes (0.023 inch I.D., 0.038 inch O.D.; BD Intramedic) connected via a steel pin (0.016 inch I.D., 0.025 inch O.D.) to the various ports of the device.Strains
The integrated unc-4::gpf strain35 was used to monitor GFP fluorescence from the VA motorneurons. Wild type worms were C. elegans Bristol strain N2. All strains were cultured under standard conditions,36 fed E. coli OP50 and maintained at 20–23 °C. Worms homozygous both for integrated transgene /ruIs32/ expressing histone H2B::GFP under control of a germline promoter37 and /glo-1/(/zu391/) mutation lacking autofluorescent and birefringent gut granules38 were used for live observation of germline chromosomes.Worm loading and manipulation
Worms were loaded into the chip using the procedure described in.16 For all of our experiments, we used young adults. Activation of the integrated microfluidic valves for transferring individual worms between the behavior and immobilization modules was achieved with the help of external solenoid valves (Lee Company) (ESI figure S1†). The valves were controlled using a digital controller (ValveBank II from AutoMate Scientific).Quantification of the on-chip worm locomotion pattern
The displacement measurement experiments (figure 3) were done using an inverted microscope (IX71, Olympus) equipped with a 20x objective. A black and white real-time streaming video of the worm's movement was obtained and analyzed in Metamorph software. The software tracked the worm body movement and extracted the coordinates of a 10 µm × 10 µm rectangular area superimposed on the mid-section of the worm's body. The optical resolution of the microscope setup was 1.6 µm (1 pixel in the camera corresponded to 1.6 µm).Average speed measurement on an agar plate
A video of the worm's motion was recorded for a minute and then uploaded to Matlab. Image thresholding was then performed to render a black and white image, where the white area represented the worm body and the black area represented the background. The video file along with the threshold values was then uploaded to a custom-made Matlab code. The code computed the coordinates of the worm's body centroid in each video frame and used the displacement of the centroid between successive frames to calculate the average speed of the nematode's movement.Fluorescence imaging
Fluorescence imaging experiments were performed using an inverted microscope (IX71, Olympus) equipped with a 40x oil immersion objective. Before each recording, worms were exposed (10–20 sec) to fluorescent light until the average intensity in the cell body of the VA motorneurons was decreased to approximately 10,000 fluorescent units. Metamorph software was used to calculate the average fluorescence intensity from the real-time streaming video captured with a back-illuminated camera (QUANTEM:512SC, Photometrics). The exposure time for each frame was 60 ms. The data extracted using Metamorph was then input to a custom-made Matlab code that calculated the percentage change in the average fluorescence intensity over the entire cell body area, relative to the average intensity recorded at time t = 0.CO2 concentration measurement
We estimated the concentration of CO2 during immobilization by measuring CO2-induced changes in the absorption properties of a pH sensitive dye (thymol blue).39 A 5 mM solution of the dye was prepared in ethanol and its pH was adjusted to 9.6 by adding 0.1 M of NaOH solution. The dye solution was introduced into the flow channel of the microfluidic device and its absorption intensity change was measured before and after CO2 application at 69 kPa (in identical conditions to the worm immobilization conditions). The dye was illuminated with yellow light using the transmission mode of an inverted microscope.To obtain the calibration curve between the CO2 concentration and the absorption intensity of the dye (ESI figure S2†), we applied known CO2 concentrations (0.035% (air), 5%, 20% and 100% CO2) through a microfludic device that was hermetically sealed. A CO2-impermeable tubing was used to connect the CO2 tank supply to the microfludic device. The calibration data were curve-fitted using a logarithmic relationship.
Acknowledgements
This work is supported by the National Institute of Neurological Disorders and Stroke (grant number 1R21NS058646-01). All the devices were fabricated at the Lurie Nanofabrication Facility at the University of Michigan. We thank Kentaro Nabeshima for providing the H2B::GFP strain and useful discussions and recommendations regarding chromosomal imaging. We also thank Marty Chalfie and Ursula Jacob for providing the unc-4::gfp and N2 strains respectively.References
- G. Lettre and M. O. Hengartner, Nature Reviews Molecular Cell Biology, 2006, 7, 97–108 Search PubMed.
- LA Herndon et al., Nature, 2002, 419, 808–814 CrossRef.
- O. Hobert, J. Neurobiol, 2003, 54, 203–223 CrossRef CAS.
- S. W. Emmons and J. Lipton, J. Neurobiol., 2003, 54, 93–110 CrossRef CAS.
- I. Mori and Y. Ohshima, Nature, 1995, 376, 344–348 CrossRef CAS.
- M. F. Yanik, H. Cinar, H. N. Cinar, A. D. Chisholm, Y. Jin and A. Ben-Yakar, Nature, 2004, 432, 822 CrossRef CAS.
- S. Chung, D. Clark, C. Gabel, E. Mazur and A. Samuel, BMC Neurosci., 2006, 7, 30 CrossRef.
- M. A. Hilliard, A. J. Apicella, R. Kerr, H. Suzuki, P. Bazzicalupo and W. R. Schafer, EMBO J., 2005, 24, 63–72 CrossRef CAS.
- L. Avery and B. B. Shtonda, J. Exp. Biol., 2003, 206, 2441–2457 CrossRef.
- A. Nagy, N. Perrimon, S. Sandmeyer and R. Plasterk, Nat. Genet., 2003, 33, 276–284 CrossRef CAS.
- R. Kerr, V. L. Ram, G. B. P. Vincent, R. Y. Tsien and W. R. Schafer, Neuron, 2000, 26, 583–594 CrossRef CAS.
- M. B. Goodman, D. H. Hall, L. Avery and S. R. Lockery, Neuron, 1998, 20, 763–772 CrossRef CAS.
- J. Sulston and J. Hodgkin, in The Nematode Caenorhabditis elegans, ed. Community of C. elegans Researchers, The Nematode Caenorhabditis elegans, 1988 Search PubMed.
- J. A. Lewis, C. H. Wu, H. Berg and J. H. Levine, Genetics, 1980, 95, 905–928 CAS.
- S. X. Guo et al., Nature Methods, 2008, DOI:10.1038/nmeth.1203 Search PubMed.
- N. Chronis, M. Zimmer and C. I. Bargmann, Nature Methods, 2007, 4, 727–731 CrossRef CAS.
- H. C. Sreekanth, N. Chronis, T. Makoto, M. G. Jesse, R. Daniel, B. G. Miriam and C. I. Bargmann, Nature, 2007, 450, 63–70 CrossRef CAS.
- S. E. Hulme, S. S. Shevkoplyas, J. Apfeld, W. Fontana and G. M. Whitesides, Lab Chip, 2007, 7, 1515–1523 RSC.
- C. B. Rohde, F. Zeng, R. Gonzalez-Rubio, M. Angel and M. F. Yanik, PNAS, 2007, 104, 13891–13895 Search PubMed.
- F. Zeng, C. B. Rohde and M. F. Yanik, Lab Chip, 2008, DOI: 10.1039/b804808h Search PubMed.
- M. A. Unger, H.-P. Chou, T. Thorsen, A. Scherer and S. R. Quake, Science, 2002, 288, 113–116.
- G. M. Whitesides, E. Ostuni, S. Takayama, X. Jiang and D. E. Ingber, Annu. Rev. Biomed. Eng., 2001, 3, 335–373 CrossRef CAS.
- D. Armani, C. Liu and N. Alum, MEMS Twelfth IEEE International Conference, 1999, 222–227 Search PubMed.
- J. M. Gray, J. J. Hill and C. I. Bargmann, PNAS, 2005, 102, 3184–3191 Search PubMed.
- G. Nicolas and D. Sillans, Annual Review Entomology, 1989, 116, 34–97 Search PubMed.
- N. H. Badre, M. E. Martin and R. L. Cooper, Comparative Biochemistry and Physiology, 2005, 140, 363–376 Search PubMed.
- E. H. Colhoun, Adv. Insect Physiology, 1963, 1, 1–46 Search PubMed.
- S. F. Braesch, C. R. Acad. Sci., 1977, 284, 1361–1364 Search PubMed.
- E. A. Hallem and P. W. Sternberg, PNAS, 2008, 105, 8038–8043 Search PubMed.
- A. J. Bretscher, K. E. Busch and M. de Borno, PNAS, 2008, 105, 8044–8049 Search PubMed; J. D. Corbett, M. R. Cho and D. E. Golan, Biophysical Journal, 1994, 66, 25–30 Search PubMed.
- J. M. Gray, D. S. Karow, H. Lu, A. J. Chang, J. S. Chang, R. E. Ellis, M. A. Marletta and C. I. Bargmann, Nature, 2004, 430, 317–322 CrossRef CAS.
- J. D. Corbett, M. R. Cho and D. E. Golan, Biophysical Journal, 1994, 66, 25–30 Search PubMed.
- K. Nabeshima, A. M. Villeneuve and M. P. Colaiacovo, The Journal Of Cell Biology, 2005, 168, 683–689 Search PubMed.
- K. Chung, M. M. Crane and H. Lu, Nature Methods, 5, 637–643 Search PubMed.
- A. Pflugrad A, J. Y. Meir, T. M. Barnes and D. M. Miller, Development, 1997, 124, 1699–1709.
- I. A. Hope, C. elegans, A Practical Approach, Oxford University press, 2005, 213 Search PubMed.
- V. Praitis, E. Casey, D. Collar and J. Austin, Genetics, 2001, 157, 1217–1226 CAS.
- G. J. Hermann, L. K. Schroeder, C. A. Hieb, A. M. Kershner, B. M. Rabbits, P. Fonarev, B. D. Grant and J. R. Priess, Mol. Biol. Cell, 2005, 16, 3273–3288 CrossRef CAS.
- F. R. Zaggout, I. M. El-Nahhal, A. El-Fattah, A. Qaraman and N. A. Dahoudi, Material Letters, 2006, 60, 3463–3467 Search PubMed.
Footnote |
| † Electronic supplementary information (ESI) available: Supplementary figures, movies and table. See DOI: 10.1039/b807345g |
| This journal is © The Royal Society of Chemistry 2009 |
